Good morning … equity futures marginally lower and yields are UP with 2yy leading the charge higher …
They’ve been down so long they look up? I promise you they are HIGHER on the session BUT after past few days, well, a session where yields are UP just north of 4bps hardly registers?
… here is a snapshot OF USTs as of 705a:
… HEREis what this shop says be behind the price action overnight…
… WHILE YOU SLEPT Treasuries are lower with the curve flatter after a brace of firm services PMI readings overnight along with a 'shock' 50bp hike from the RBNZ (+25bp was expected). DXY is higher (+0.13%) while front WTI futures are a hair (-0.35%) lower. Asian stocks saw weakness in Japan (NKY -1.68%) but modest strength elsewhere, EU and UK share markets are mixed while ES futures are showing -0.15% here at 7:10am. Our overnight US rates flows saw yet another quiet Asian session (HK, China out on holiday) with long-end real$ buying seen into the bear flattening during their hours. It was a quiet start in London too with the desk noting small net selling with some interest to pay the belly versus the wings. Overnight Treasury volume was ~70% of [the falling] average overall.
… and for some MORE of the news you can use » IGMs Press Picks for today (5 APR) to help weed thru the noise (some of which can be found over here at Finviz).
From some of the news to some VIEWS you might be able to use. here are a few things Global Wall St and the intertubes are sayin / thinkin:
A large British operation on JOLTS and the FED,
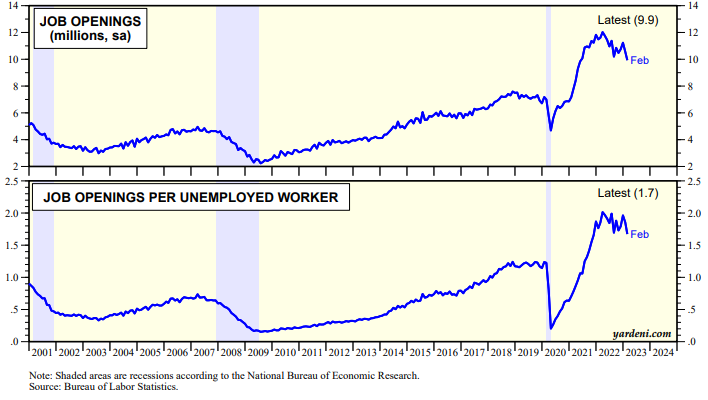
February JOLTS: Fed hikes gaining traction Job openings declined from 10.6mn to 9.9mn in February, dropping below 10mn for the first time since May 2021. The number of openings per unemployed person also fell, to 1.7. Although this suggests that the Fed was gaining traction on labor demand prior to March's banking turmoil, other indicators are more mixed.
Inserting a chart from TWTR (cuz, you know, I believe everything I see up there),
So those Fed hikes really may BE having traction AND the bond market is never wrong?? Carrying along this theme, a large French operation notes,
US rates: Market-based rate cut signals accumulating
We examine three market-based signals for timing of rate cuts: the money market curve, the 2s10s UST curve, and swaption skew. We find that risks of more imminent Fed action are accumulating.
The explosion of volatility in the short-end implies a much broader distribution of outcomes for rates at year-end than only a month or two ago.
This translates to a wide band of risks around our modal forecast, which sees the hiking cycle ending at 5.25% in May, recession in H2 2023 and rate cuts beginning in Q1 2024.
Such high implied volatility suggests ‘fat tails’ in either direction relative to the year-end forward curve, but the bigger risk is to lower yields, we think. Trades for consideration…
…Powell’s favoured recession indicator at an extreme
… Federal Reserve Chair Powell pushed back on the efficacy of 2s10s UST as a predictor of recession, instead citing a 2018 Fed research paper which favoured the near-term forward spread (NTFS) as a more accurate barometer.
(Don’t fear) The yield curve¹ focused on the spread between the implied yield of the six quarter ahead 3m Tbill yield and the current 3m T-bill yield (18m3m T-bill – 3m T-bill), defining it as the NTFS…
… History does not necessarily repeat itself. The 2001, 2007 and 2019 easing cycles saw fed funds reach 1% or the zero lower bound (ZLB), which may not occur this time. Critically, inflation is considerably higher at present when compared to levels preceding the last three easing cycles (though a recession can induce rapid disinflation).
That said, we are also reticent to claim that this time is altogether different. The NTFS fell below -75bp on 6 January. If the last three easing cycles and recessions are a guide, Powell’s favoured indicator appears to signal that rate cuts could begin as early as Q3 2023…
…Revised yield forecasts and trades for consideration
We revise US yields lower across our forecasting horizon, but most acutely in H2 2023. Our projected 2y UST and 10y UST yields for end 2023 are now 3.30% and 3.40%, respectively (Figure 7)…
With this all in mind, perhaps nows as good a time as any to insert some further eye candy … a weekly macro chart pack from a now even larger than large Swiss operation,
US Bond Yields are close to their recent lows following the miss in the JOLTS data, with the fall in yields finally gaining momentum as medium-term weekly MACD across a range of maturities is close to turning outright bullish for the first time since 2021. This would be an important bullish signal to reinforce our view that both US 2s and 10s can fall to 3.00% this year. We therefore discuss some of the cross-asset implications of lower US Bond Yields in this week’s pack.
Please note the Credit Suisse House View is also positive on US Government Bonds.
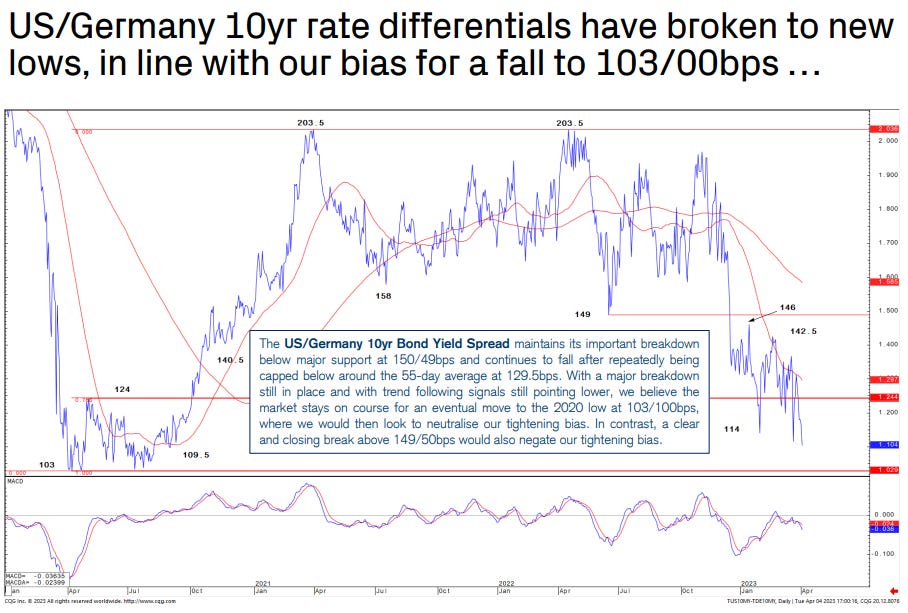
Importantly, US Bonds continue to outperform vs Germany, in line with our bias for the 10yr US/Germany Bond Yield Spread to fall to 103/00bps…
With rates momentum on verge of turning outright bullish reinforcing a technical view, now might also be a good time to double back and check in with those up in the ivory tower … Dr Ed BOND VIGILANTE Yardeni’s recently noted the obvious,
Interest rates continued to fall today after Jamie Dimon, who is the President, CEO & Chairman of JP Morgan Chase, warned that the banking crisis is "not yet over" and will cause "repercussions for years to come." He did so in his annual letter to stockholders. With all those titles, he must know what he is talking about. He observed that potential losses from held-to-maturity bonds, were “hiding in plain sight.”
Also sending interest rates lower were yesterday's March M-PMI, today's JOLTS report for February, and March auto sales …
… (2) JOLTS. Job openings fell to 9.93 million, a drop of 632,000 from January’s downwardly revised number, the first reading below 10.0 million since May 2021 (chart). On the other hand, quits rose by 146,000 to just over 4 million, suggesting that switching jobs remains easy to do. Fed officials are watching these labor market indicators closely.
… (5) Bottom line. The Fed might be done.
Finally, for those more equity-minded among us … a rather large German bank out with a note on tech (which goes hand in hand with long bonds, no?),
In December, we argued that a Q1 rally in mega-cap growth & Tech was likely, driven by a positioning squeeze (Equities in 2023: Following The Recession Playbook, Dec 2022). This squeeze has now largely played out. What next? MCG & Tech earnings rose massively through the pandemic boom and have fallen sharply through the bust, but the underlying uptrend looks to be intact. The large cycle has remained closely tied to global growth and the dollar, both of which now point to a rebound in MCG & Tech earnings off the bottom of their trend channel. We look for beats and upgrades, breaking last year’s run of falling forward earnings, and stay with our tactical long through the Q1 season as the baton passes from positioning to earnings.
And from Germany TO France for,
US Equities: Q1 earnings – seasonal strength vs fundamental weakness
Seasonal strength: Since the end of H2 2022 SPX earnings forecasts for 2023 have been downgraded >10%. However, aggregate returns for the past three earnings seasons (15th to 15th of respective months) have been >+25%. This compares to -15% owning equities outside of those earnings periods. April is also seasonally the strongest month for equities over the past 20 years. Seasonal patterns alone are not enough to make us more bullish, but they do suggest it might be wise to look for low premium bearish trades with asymmetric payoffs, whilst being very selective on selling the right tail.
Fundamental weakness: New lows in the Manufacturing ISM and recent events in the Banking sector do little to dissuade us from our recessionary biases. However, it is not obvious that this earnings season will be the tipping point for equities or more explosive for volatility. We would look to fade the rally in Tech, but would do so with a low premium and a short skew bias to trades. In contrast, we would be more interested in owning the left tail of the distribution in sectors or indices with a short Quality bias.