(USTs lower, flatter on avg volumes)while WE slept; NFIB; (10yy) shorts and longs and tightly correlated markets; good views and some less good ...
Good morning … shouldn’t have taken TCU and the points
(click on image or HERE for ESPN recap) if you are looking for something to watch as you prepare to help Depart of Tsy place this afternoons 3yr auction …
3yy triangulating after having plateaued BUT I’d note some bearish (overBOUGHT) momentum — stochastics (bottom panel) as something to watch. Time at a price (or a selloff — aka concession) into / thru this weeks reFUNding process? Perhaps JPOW speech shortly will help? Perhaps this mornings NFIB will help?
… declined 2.1 points in December to 89.8, marking the 12th consecutive month below the 49-year average of 98. Owners expecting better business conditions over the next six months worsened by eight points from November to a net negative 51%. Inflation remains the single most important business problem with 32% of owners reporting it as their top problem in operating their business.
“Overall, small business owners are not optimistic about 2023 as sales and business conditions are expected to deteriorate,” said NFIB Chief Economist Bill Dunkelberg. “Owners are managing several economic uncertainties and persistent inflation and they continue to make business and operational changes to compensate.”
Never mind … here is a snapshot OF USTs as of 705a:
… HERE is what another shop says be behind the price action overnight…
… WHILE YOU SLEPT
Treasuries are modestly lower and the curve flatter ahead of a Powell appearance at a central bank gathering where he will be on a panel with this topic: "Central Bank independence and the mandate- evolving views" as here: Riksbank DXY is higher (+0.2%) while front WTI futures are too (+0.5%). Asian stocks were mixed, Eu and UK share markets are mostly lower (SX5E -0.55%) while ES futures are showing -0.28% here at 6:45am. Our overnight US rates flows saw 'slow' sessions in Asian and London overnight. During Asian hours we saw better net selling with intermediates underperforming while during London's AM hours most of our activity was in the very front-end. As in Asian hours, London saw overall net selling (some profit-taking in 20yrs noted) today for the first time in a while. Overnight Treasury volume was about average overall with 7yrs (143%) seeing the highest and 30yrs (59%) seeing the lowest average turnover overnight.
… and for some MORE of the news you can use » IGMs Press Picks for today (10 JAN) to help weed thru the noise (some of which can be found over here at Finviz).
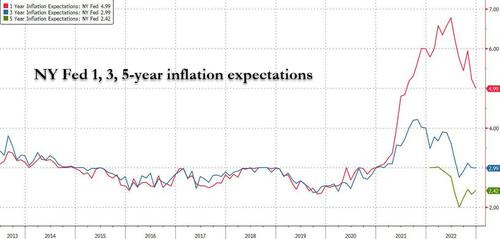
In other news, from the FRBNY yest, it’s important to remember that ‘lowest since’ is NOT low …
ZH: NY Fed Survey Finds 1-Year Inflation Expectations Drop To 5.0%, Lowest Since July 2021
… More in the full NY Fed survey which can be found here.
… but moving in the right direction is ALWAYS a welcomed development.
Moving along TO Global Wall Street inbox … With the JPOW set to speak in Sweden, here’s Advisors Asset Management on
Fed and Market at Odds on Pivot in 2023
… Optimism that the Fed is moving to a slower pace of hikes or possible pause later in the year could well be warranted, optimism they will pivot to rate cuts may well be not.
Bloomberg’s John Authers on stocks
Earnings Season Will Hang on Price-to-Recession
… The bottom line, however, continues to be the economy, which is always important and particularly difficult to forecast at present thanks to the lurches caused by the pandemic. Over the last four decades, earnings per share have only taken serious declines during recessions. They’ve also followed a fairly clear rising trend. At present, EPS appears to be far above that long-term trend, and due to revert down toward the mean. This chart from the Bloomberg terminal shows that any sensible trend line suggests that recent earnings are unsustainable:
Trend analysis tends on the face of it to amplify the economic case for gloom. This is from Evercore’s Ed Hyman:
Heightened economic volatility, coupled with pandemic distortions, have made forecasts based on traditional regressions a task fraught with peril. By the simplest assumptions, mean reversion to historical earnings growth would imply S&P 500 trailing earnings should hover around $160-$170, a 20%+ decline from $221 highs. That would be more extreme than the Pandemic’s plunge or 2001’s recession (in both, trailing EPS declined by ~17% from peak to trough) and would forecast a base case of a deeper and more protracted recession than consensus expects.
But if the recession call is wrong, there’s room for earnings to do much better than expected.
BNP on
US Equities: From macro to micro
Q4 earnings downside risks: We had non-consensus bullish calls for US equities ahead of both Q3 & Q2 2022 earnings seasons, respectively. We felt the market looked vulnerable to bear market rallies. This was predicated on how bearish positioning was. Our view for Q2 & Q3 was that earnings were not yet going to be bad enough to disappoint an already bearish buyside consensus. Our message for Q4 is different. Positioning is cleaner and less short heading into earnings. We have seen ~$150bn of US equity inflows (ex-buybacks) since the start of Q3. We see less scope for a bear market rally or short squeeze. Equities were >15% below the 200d MA into Q2 & Q3, vs. just ~2.5% below today. Earnings forecast momentum has been getting sequentially worse at each earnings season (see Fig. 1). The risk to our view is that Q4 may still be too early to see the capitulation. If we were to pick a single earnings season as most likely to drive a tipping point, it might be Q1 2023 in April. However, we do think the risks for Q4 earnings are to the downside. In this piece, we highlight our preferred asymmetric trade ideas to position for a negative market impact through Q4 earnings season.
BNP separately writes up how they are,
Starting the year with pro-risk trade ideas
… Initiating short UST 10y: The 10y US Treasuries have recently rallied following softer-than-expected data and some signs of inflation cooling. The move is picked up by MarFA™ Macro as −2.1 z-scores overdone (24bp), with fair value for 10y UST remaining stable at 3.83%.
… There is a risk that Fed speak will be on the hawkish side this week to reinforce this Fed view, giving the needed upside catalyst for the US 10y yield. We also consider shorting 10y Treasury to be a hedge to our pro-risk trade ideas around this week’s CPI release– an upside surprise would likely be negative for risk but supportive for US yields.
Back to Bloomberg on how tightly bound together bonds and stocks are and so, watching STOCKS will then, by default help game bonds,
… Back in October I flagged that equities and bonds were breaking from their normal settings to move together far more tightly than at almost any stage in history. Since then, the ties have only become tighter, as the prospects of an end to Federal Reserve interest-rate hikes helps to drive gains for both benchmark Treasury futures and contracts on the S&P 500 Index.
The odds are growing that the correlation will dissolve, given that further sustained declines in yield would require a slowdown in the economy and inflation severe enough that it would also hammer earnings expectations. That’s part of the concern underscoring forecasts from Morgan Stanley’s longtime equities bear Michael Wilson, who says profit estimates are still too high considering the likelihood of recession. And if Wilson is off the mark and a recession doesn’t hit, then those 3.5% 10-year yields may seem too low.
Some less gloomy views offered up here next by Goldilocks with updated,
Global Views: Mostly Better News
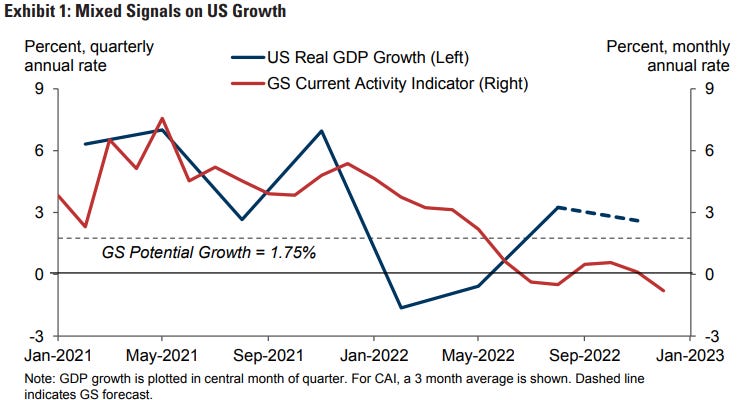
The high-frequency US growth indicators are unusually disparate at present. Our tracking estimate for real GDP growth in Q4 has crept up to 2.6% and the Atlanta Fed’s GDPNow estimate stands at a sturdy 3.8%. The job market also remains quite firm, with a 223k gain in nonfarm payrolls, a large increase in household employment that pushed the unemployment rate back down to 3.5% in December, and initial jobless claims averaging just 214k over the last four weeks. Nevertheless, weakness across a variety of business surveys, including the nonmanufacturing ISM for December, has pushed our current activity indicator down to -0.8% in Q4. If we average these signals, the implication is that underlying growth remains positive but clearly below trend, with greater uncertainty than usual because of the conflicting signals.
… 3. But a renewed monetary tightening shock is unlikely given the disinflation now underway…
… 4. Price inflation is also slowing sharply …
… 8. Even after the rally of the past few days, we think risk assets only partially reflect the better recent news on US inflation and non-US growth. One likely reason is market focus on the Fed’s continued desire—repeated in the FOMC minutes last week—to prevent financial conditions from loosening too much and thereby undermining the labor market adjustment that the committee thinks is still needed. But we would note that the desired level of financial conditions is a moving target; if wage growth and core inflation continue to come down, Fed officials will become gradually more tolerant of easier conditions. Moreover, we think global markets still have room to adjust to the sharply better growth outlook in Europe and especially China, with upside in China-exposed stocks, CNH, commodity currencies, and industrial metals.
Some LESS optimistic views (from First Trust, an unusual source)
… Put it all together and it looks like both the surge in M2 growth in 2020-21 (which created the inflation) and the abrupt slowdown in 2022 (which would cause slower growth) are still wending their way through the economy. If so, we should see weak economic data, soon. Further forward, if the Federal Reserve maintains slow M2 growth – an open question given the Fed’s reluctance to focus publicly on the monetary aggregates when setting policy – we could see a major slowdown in inflation in 2024. Time, and the direction of monetary policy, will tell.
Right now, it looks like Real GDP expanded at a 2.5 – 3.0% rate in the last quarter of 2022. But how fast it’s growing in the first quarter of 2023 – if at all – is anyone’s guess.
Since we’re on the topic of (NOT)Goldilocks, the firm aka Goldilocks offering up an interesting take on UST DEMAND into the new year,
Notional net Treasury supply is likely to rise $200-250bn in 2023 versus 2022. However, quantitative tightening implies a more material increase in Treasury net supply that has to be absorbed by non-Fed investors, with significantly higher T-bill issuance responsible for the projected year-over-year increase.
The bill-heavy supply mix ought to draw in increased money fund purchases, while levered investors are likely to be a central source of demand for longer maturities. Fed QT points to further accumulation of Treasuries on dealer balance sheets while keeping commercial banks sidelined. We see room for sustained pension demand thanks to robust funded ratios, while for foreign investors a shift in the FX backdrop should result in some rebound in official sector buying.
In aggregate, we expect the supply and demand mix will see upward pressure on USD funding costs, reflecting increased short term supply and demand for leverage. There is also likely some scope for cheapening of cash Treasuries versus futures, while rising dealer inventories will likely sustain elevated dispersion of off-the-run USTs …
… While Flow of Funds estimates are prone to material revision, historical indications of pensions’ Treasury purchases tend to be broadly correlated with stripping activity, which in turn typically follows smoothed changes in pension funded ratios (Exhibit 3).
With UST DEMAND in mind, a nice segue TO 3 themes for 2023 from Rich Bernstein where #2 (chart 3) captured my heart and mind
… Theme #1: Play defense. Worry later about playing offense.
There are two main inputs to equity valuation: 1) earnings and 2) interest rates. Investors have so far seemed to focus on #2 (the Fed and interest rates) and relatively ignore #1 (earnings).
The US, and many other countries, are in the early stages of profits recessions, yet both equity and fixed-income markets have been very slow to anticipate the potential falloff in corporate profits. Chart 3 shows corporate bond spreads through time. Although spreads have widened a bit in anticipation of corporate cash flows coming under pressure and an increasing probability of default or bankruptcy, the spread remains very low relative to historical recession periods.
… Theme #3: Accept that the world is changing
… If globalization retreats, then global competition might contract. Some are arguing that certain industries’ critical production should be limited to US producers. That might be important for national security and other considerations, but secular inflation might replace secular disinflation as the “supply of suppliers” decreases.
In as far as a couple / few CHARTS which may be of interest, 1stBOS DAILY FI CoTD
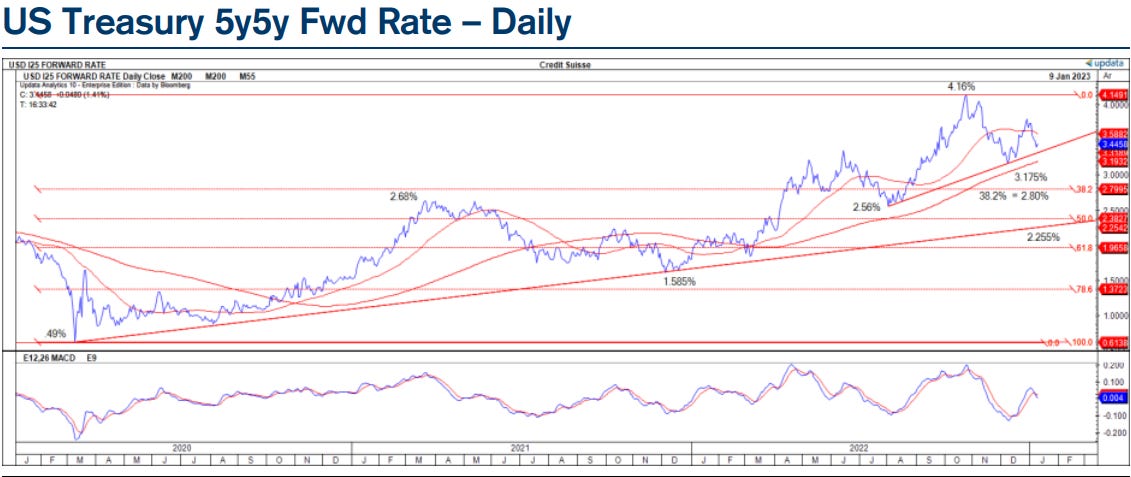
Chart of the Day: We are monitoring longer-term US fwd rates for signs on whether US Yields can see a faster than expected fall in Q1, as there is an irregular topping structure threatening in the US 5y5y Treasury Fwd Rate, which would be confirmed below 3.175%. If confirmed, we would expect a faster move lower in 5y5y fwds to 2.80% next and in US Yields more broadly, compared to our current base case expectation of a steady grind lower during Q1 in US 10s to 3.405/39% and then to the 200-day average at 3.255%. Regardless of the speed, our core objective for US 10s remains at 3.00%.
The firm staying tactically BULLISH 5y and 10y and ALSO initiated NEW tactically bullish view 30yy at support (3.85%). Stops are 4.04%, 4% and 4.04% respectively. And for some further, longer term bigger picture context and themes,
Global Market Outlook - Q1 2023
Key Technical Themes
* Risky assets have started 2023 strongly, with the CS Global Risk Appetite index mirroring this strong start. Key technical resistance levels have also been broken, especially in Europe and the UK, which points to a less negative body of technical evidence for Global Equity markets.* As a result, we maintain our core negative outlook, particularly for the US, which we expect to underperform global developed markets, however we are less convinced in our bearish view compared to 2022 and see scope for further short-term gains in Global Equities at the start of Q1. Our base case is still for further global equity market weakness later in the year. Please note, the Credit Suisse House View is also negative on Global Equities.
* Adding to the more mixed picture for global risk sentiment is the fact that US Credit Spreads are weighing heavily on very well-defined technical support levels, which if broken would complete large technical topping structures.
* Furthermore, the technical outlook for Chinese Equities has improved and we now see scope for further gains in Q1, with the broader Chinese re-opening theme a key driver in our view of the risk-on phase that we have seen so far this year.
* Falling inflationary pressures have also been a key driver of risk-sentiment and we maintain our view that US Inflation Expectations will move lower during 2023, helped by lower Commodity prices. However, we are considerably less certain about the timing of a range breakdown, and in any case, expect any move lower to be gradual for now.
* In turn, we expect falling US Inflation Expectations to drive a steady move lower in US Bond Yields, with the 10yr US Bond Yield expected to test the 200-day average at 3.25% in Q1.
* We expect the USD to see further mild weakness in Q1 which can take EURUSD to our 1.0900/44 target where we are then biased to look for a top.
* Whilst the broad BBG Commodity TR index continues to hold key support for now we continue to look for an eventual break lower later in the year. Within the Commodity space though we maintain our outlook for Gold/Precious Metals to outperform.
… THAT is all for now. Off to the day job…


