Good morning … rates are a touch lower and stocks are aggressively UNCH ahead of a holiday long-weekend (for some) just ahead. Bloomberg’s Weekly FIX details the oddity AND leads with an important visual of US Govy LIQUIDITY in decline and disrepair…
This week brings a relatively rare economic constellation: March’s US payrolls print lands on a public holiday, creating a small tear in the time-space continuum. Treasuries will trade just half a day, while the US equity market is shut.
The non-farm payrolls print completes a trifecta of labor market data this week, and the stakes are high. Job openings fell below 10 million for the first time since 2021, while just 145,000 private payrolls were added last month, according to the ADP Research Institute — below all estimates in a Bloomberg survey of economists.
The NFP figures take on an added importance given Friday’s print marks a full year of payrolls reports since the Federal Reserve’s liftoff hike last March. While signs of tightening have cropped up across the economy — for instance, in the banking system and the housing market — the American workforce has been remarkably resilient.
“Jobs growth remains stronger than we might have otherwise expected in light of the last 12 months of rate hikes – a dynamic that inevitably leads to a conversation regarding the lagged influence of tightening and whether we’ve passed the stage at which greater fallout should be a primary concern,” BMO strategist Ian Lyngen wrote in a report.
Friday’s numbers aren’t expected to show any signs of a slowdown. Consesus says that the US added 235,000 jobs in March, with the unemployment rate expected to stay put at a historically low 3.5%.
The fun part will be watching how incredibly thin markets digest the data. Liquidity is already an issue in the Treasury market — now add holiday trading conditions.
“Try to imagine hedging a book Thursday at the close for a Friday when the US Treasury market is the only one open for business with Europe closed both for Good Friday and Easter Monday...The algos will have a field day,’’ Andrew Brenner, the head of international fixed-income at NatAlliance Securities, wrote in a note. “We would not miss Friday's number and trading, it will be a stunner.’’
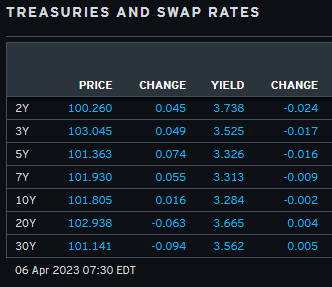
AND … here is a snapshot OF USTs as of 730a:
… HEREis what another shop says be behind the price action overnight…
… WHILE YOU SLEPT Treasuries are higher and the curve steeper ahead of the employment-related data and tomorrow's early close. DXY is modestly higher (+0.1%) while front WTI futures are little changed (-0.15%). Asian stocks were mixed/lower, EU and UK share markets are modestly higher (SX5E +0.25%) while ES futures are UNCHD here at 7:07am. Our overnight US rates flows saw better selling in the belly from real$ names- selling that was easily absorbed despite our mostly 1-way flows. Overnight Treasury volume was about average overall with 5yrs (141%) seeing the highest relative average turnover overnight, matching our activity.
… BBG And if you look the linked-in BBG article you can see the snapshot they took of 'Powell's curve' in late March of last year. Fast-forward to today and our first attachment shows the update of Powell's curve (3mo Bill yield versus the 18m fwd 3mo rate) which continues to plunge to fresh century lows (-167bp this morning). Throw in Leading Indicators YoY%, the YoY plunge in M2 money growth, Ed's recent chart of today's continuing claims level versus its rolling 1-year low, etc... and it's not hard to see why markets may be increasingly thinking 'policy error' when reading about further rate hikes. Indeed, we can't remember which colleague proposed this idea during a recent meeting, but the thought resonated with us: That upcoming strong data may be unlikely to remove priced-in rate cuts where, instead, the data is more likely to simply shift the timing of the priced-in cuts forward or backwards... We'll see how it goes.
… and for some MORE of the news you can use » IGMs Press Picks for today (2 APR) to help weed thru the noise (some of which can be found over here at Finviz).
Before jumpin in TO the inbox and intertubes, ZeroHedge did a decent job for folks like me (marginally attached to the real world of watching markets churn and burn, moment by moment), spelling out shift in Mester (non-voting FOMC member) TONE
… The Fed's hawks are quickly turning dovish - Fed's Mester clearly got the tap on the shoulder overnight...
Yesterday - MESTER: FED WILL NEED TO GET RATES UP 'A LITTLE BIT MORE', SEES FED-FUNDS RATE ABOVE 5%, HOLDING FOR SOME TIME
Today - MESTER: TOO SOON TO SAY WHETHER FED WILL RAISE RATES IN MAY, HOPING WE DON'T TIGHTEN UNTIL SOMETHING BREAKS
And the market is not waiting for the rest of The Fed to come along for the ride.
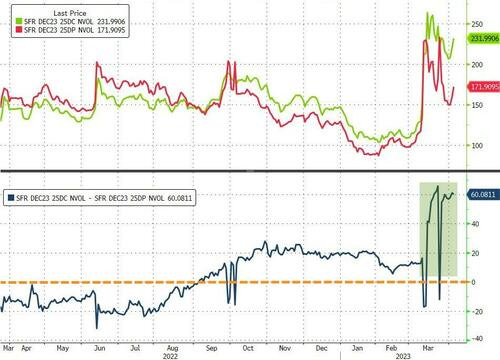
As Nomura's Charlie McElligott noted, the market is betting very aggressively on lower rates by year end as year-end SOFR Skews are soaring (higher price, lower yield)...
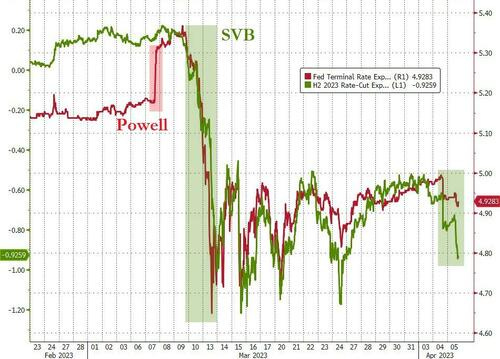
The market is now pricing a terminal rate of around 4.90% in May (40% odds of 25bps hike and done), followed by 4 rate-cuts (back down to 4.00% by year-end)...
AND … From some of the news to some VIEWS you might be able to use. Global Wall St SAYS:
Goldilocks out with a note on today’s Jobless Claims data last night,
■ Over the last year, we have shown that most of the outsized swings in the jobless claims data have been misleading. Rather than reflecting genuine changes in the pace of layoffs, they have instead reflected distortions to the seasonal adjustment factors caused by extreme volatility during the pandemic.
■ We estimate that distortions to the seasonal factors are currently depressing reported seasonally-adjusted initial claims by 40-50k and have masked a roughly 45k rise in the official series since the start of the year. This trend is corroborated by the recent increase in our real-time measure of layoffs from WARN notices. Both are rebounding from strikingly low levels in 2022, and neither has risen to a level that is particularly alarming.
■ Tomorrow’s annual update to the jobless claims seasonal factors is the first opportunity for the statistical agency to correct these problems, which were introduced in last year’s update. If the problem is fixed, we suspect that initial claims could jump to over 240k in tomorrow’s print (vs. 200k consensus and 198k reported in the prior week), but the apparent deterioration would reflect the end of a technical distortion rather than a sharp jump in the true pace of claims. If the problem is not corrected, then we would expect to see a much more modest increase in initial claims tomorrow—roughly in the 200-210k range—but we would also expect the current distorted seasonal factors to cause a large but illusory increase in reported initial claims over the next few months.
Consider ourselves WARN’d? And speaking of warnings … Another WARNING of sorts where this time, Wells out with a FORECAST REVISION,
What does the bond market know that the equity market doesn't? The yield on the 10-year Treasury is down from 4.25% on October 24, 2022 to 3.29% today. The S&P 500 is up 8.0% over the same period. Bond investors must believe that the banking crisis will soon morph into a credit crunch and a recession, so inflation will continue to fall perhaps even more rapidly than widely expected.
If so, then the Fed should be done. If the Fed persists with more rate hikes that would surely cause a credit crunch and a recession. Deflation might be the outcome of that dire scenario. Lower bond yields may be giving some support to the valuation multiples of various technology stocks for now, but a recession would surely revive last year's bear market in stocks (chart).
Nevertheless, we remain in the soft-landing camp. We continue to see a rolling recession that may be about to roll over commercial real estate. Of course, we are concerned about the potential for a worsening banking crisis and credit crunch, but we think the Fed and FDIC have stabilized the situation for now.
The latest batch of economic indicators have been weaker than expected. Today, we learned, according to ADP, that private sector hiring rose by just 145,000 in March, down from 261,000 in February and below the estimate for 210,000. Annual pay rose at a 6.9% rate in March, down from 7.2% in February. The bond market seems to be anticipating that the Citigroup Economic Surprise Index has peaked recently and is about to fall sharply (chart).
AND he concludes with copper / gold suggesting the 10yy COULD drop to 2% but … isn’t likely (assesses a 60% subjective prob to soft landing and a 40% chance of a HARDER one with rates dropping that low).
In as far as what MIGHT shape / shift that narrative? Well, what IF inflation doesn’t fall or de / dis inflation doesn’t materialize as quickly as many / most think? A large German operation looks at underlying inflation …
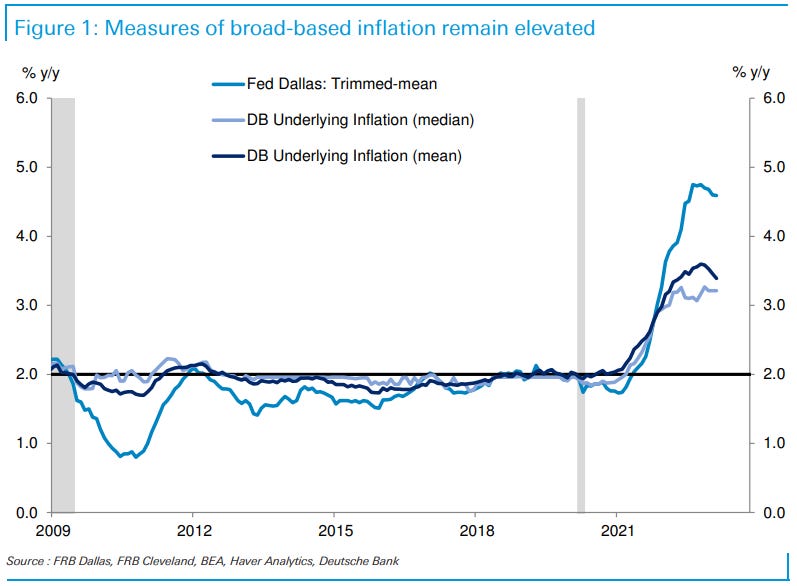
While PCE inflation data came in softer in February, the underlying details continued to be firmer. Updating our suite of statistical models, we find that our trend inflation measures remained mostly flat at historically elevated levels around 3.25-3.5%. Broad-based and persistent inflation pressures were key reasons the Fed maintained a tightening bias at the March FOMC meeting even in the face of heightened uncertainty about how banking sector turmoil could tighten credit conditions. How those conditions evolve will be a key determinant of future monetary policy actions. Our baseline expectation remains that the Fed will deliver a final 25bp rate hike in May (See Monthly charts: (Credit) Crunch time for the US economy? and Fed Watcher: Banking on credit conditions to do some of the tightening).
FWIW, I would think Fed following things like Dallas Fed Trimmed Mean (the higher # above) as opposed to the DB UIG … call me crazy but seems that this de / dis inflationary trend many waxing poetic about isn’t nearly dramatic enough. Yet. Lets HOPE?
The bond market is sending a well-advertised message to all investors…
It’s time to buy bonds.
Today let’s review one of the most liquid treasury ETFs – $TLT.
Zooming out on the weekly chart of the Treasury bond ETF TLT…
We have a potential failed breakdown below the former 2014 lows, followed by a tight, multi-month consolidation.
AND finally, from a former buyside (WAMCO) economist who is out there doing what I’m doing — writing / thinking — and trying to stay semi attached to the game,
Since the failure of Silicon Valley Bank almost a month ago, interest rates have fallen dramatically. 2-yr Treasury yields are down 130 bps, 5-yr Treasury yields are down 100 bps, and 10-yr Treasury yields are down 70 bps. This amounts to a pronounced steepening of the yield curve, and that in turn is the market's way of telling the Fed that they are going to have to cut short rates soon, and by a lot. In effect, the bond market has priced in a strong likelihood of significant monetary ease. The only question seems to be the timing: will it come at the May 3rd FOMC meeting, or will it be at the June 14th meeting? I wouldn't be at all surprised if it happened before May 3rd. If I were Fed Chair, I would announce a cut in the funds rate of at least 50 bps way before May 3rd…
… As Chart #1 shows, the last time the bond market experienced something similar was in late 2007, just before the Great Recession. That's an uncomfortable parallel to say the least.
The top part of Chart #1 shows the Fed funds target rate (white line) and 2-yr Treasury yields (orange line), and the bottom portion shows the difference between the two. Leading up to the end of 2007, short-term interest rates had been rising as the Fed tightened, but then they began to fall precipitously. Notably, the Fed was very slow to follow suit, though eventually they did. By the end of 2008 the funds rate had fallen from 5.25% to 0.25% and financial panic had spread throughout the world. More recently, over the past year the Fed has been very slow to raise rates, always following the market instead of leading the market, since for way too long they thought that the big rise in inflation was just "transitory." Looking ahead, they will likely have to catch up to the reality of declining inflation and a slowing economy by lowering rates…
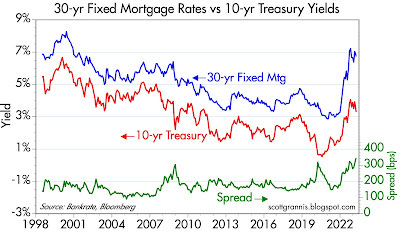
… Quick update on mortgage rates:
Chart #3 shows the relationship between 30-yr fixed mortgage rates and the yield on 10-yr Treasuries. In normal circumstances, 30-yr fixed mortgage rates tend to be about a point and a half (150 bps) above the yield on 10-yr Treasuries. (Think of 10-yr Treasuries as the North Star of the world bond market: the standard against which all other interest rates trade.) If the current spread were 150 bps instead of today's 344 bps, 30-yr fixed mortgage rates would be 4.8% instead of today's 6.7%. Mortgage rates today are hugely inflated relative to where they should be, and that has a powerful and negative impact on the housing market. They will trade lower only as the market loses its fear of inflation and its fear of an unexpected tightening of monetary policy.
AND with that little in mind, not sure WHAT the schedule is to be here for me over next few days with holidays upon us BUT a NFP report tomorrow … something likely out over weekend after data dust settles … THAT is all for now. Off to the day job…