(USTs higher / steeper on ~150% avg volumes, post China 'flation)while WE slept; credit access 'worst ever'; 60/40 is BACK, baby! (tell S&P short base?)
Good morning … We’ll start with NFIB out short while ago and move TO Chinese disinflation (eventually) … hey, it’s what I do when I’m killin’ time waiting for Lacy Hunt’s Q2 letter to arrive, what do YOU do!!??
First from DUNK at NFIB
“Small business owners are cynical about future economic conditions,” said NFIB Chief Economist Bill Dunkelberg. “Hiring plans fell to their lowest level since May 2020, but strong consumer spending has kept Main Street alive and supported strong labor demand.”
FULL REPORT HERE and a look at the HIRING INDEX (15) with some fintwit help and context
NFIB hiring plans are down to 15, a cycle low. More signs labor market softening
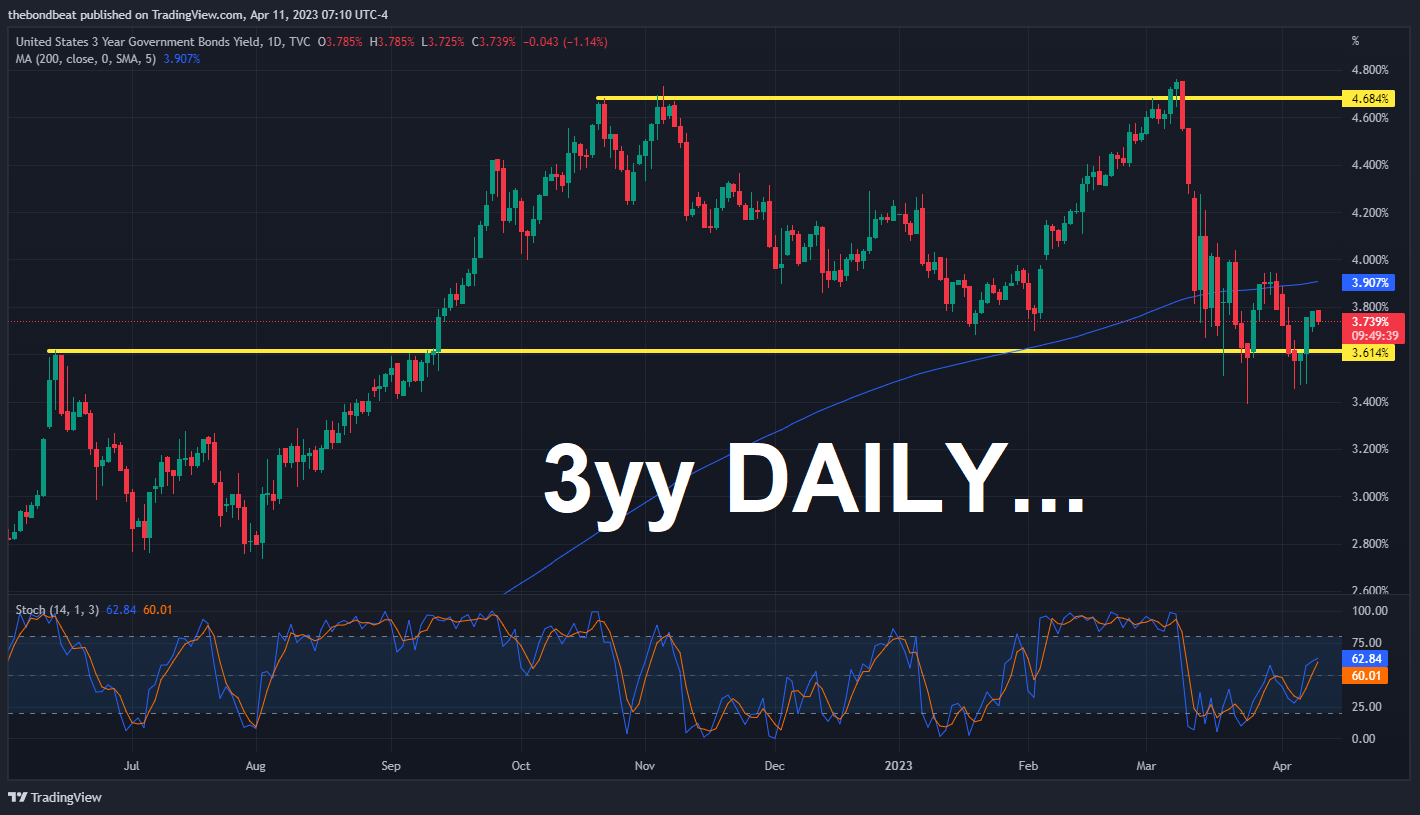
AND from NFIB we’ll head TO the bond market because, as you know, the refunding set to kick off today, and so I’ll start with a look at 3yy
Momentum (stochastics, bottom panel) suggesting path of least resistance is higher still (concession) while 200dMA (3.907%) just above … Meanwhile, 3.61% remains a level of interest (at least to me and my now much more limited and humble charting capabilities) and bares watching should a ‘bid’ develop…
… here is a snapshot OF USTs as of 710a:
… HERE is what this shop says be behind the price action overnight…
… WHILE YOU SLEPT
Treasuries are higher and the curve is on-balance steeper after China's inflation data disappointed (link above) while NFIB small business hiring plans (came at 15 this morning, a cycle low) offered further evidence of labor market softening. DXY is lower (-0.4%) while front WTI futures are little changed (-0.25%). Asian stocks were mostly higher (NKY +1.05%), EU and UK share markets reopened to gains (SX5E +0.55%) while ES futures are showing +0.15% here at 6:45am. Our overnight US rates flows saw a quiet Asian session with the majority of our activity in the front-end where real$ was a better buyer. A 6.4k TU block buy(?) seemed to set the tone there. Overnight Treasury volume rebounded nicely to ~150% of average with 2's (281%) seeing the highest relative average turnover overnight.… Our first attachment this morning looks at Treasury 5yrs in a daily chart format. The overall yield pattern looks like a mild bull channel to our eyes (drawn in) where recent probes below it (to the 3.30% area) have all been resoundingly rejected by the closes on the day of those probes. In the lower panel, daily momentum has begun to make a higher low since the move low last month and this hints of an overall tactical bear skew into this week's main events.
… and for some MORE of the news you can use » IGMs Press Picks for today (11 APR) to help weed thru the noise (some of which can be found over here at Finviz). I’d be remiss if I didn’t mention a couple from ZH where yesterday we learned,
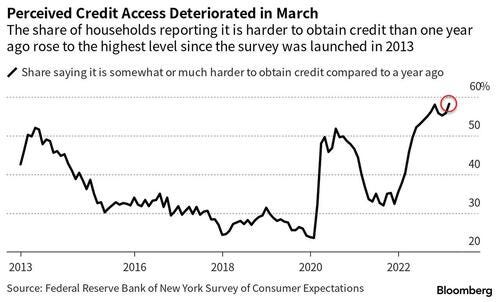
Fed Survey Shows Inflation Expectations Re-Accelerated In March, Credit Access Worst Ever
… Perhaps even more notably, the share of households reporting that it's harder to get credit than a year ago rose, reaching a series high.
Additionally, The NY Fed said they were also more pessimistic about future credit availability, which makes sense given that real estate loan growth is collapsing.
Finally, expect delinquencies to rise as a larger percentage of consumers, 10.87% vs 10.63% in prior month, expect to not be able to make minimum debt payment over the next three months.
From some of the news to some VIEWS you might be able to use — here’s what Global Wall St is sayin’ …
This first note from LPL especially near and dear to ones heart given how I may be living proof that 60/40 was in fact perceived to be DEAD. So much that I was run out of the bond biz…
The 60/40 Is Back…Perhaps Even Long Term
There deservedly was a lot of hand-wringing about the death of the 60/40 portfolio in 2022, a portfolio of 60% stocks and 40% bonds. As we stated back in June, the call for the demise of the 60/40 had likely come too late. Even at that time, we believed the challenges the markets were facing were likely already contributing to the prospect of better times ahead.
What was most surprising for the 60/40 in 2022, or course, was how spectacularly bonds failed to play their traditional role as a portfolio diversifier in a down market for equities. Equity volatility is unnerving, but many investors understand the path to potential longer-term stock gains is rarely smooth. But we are less accustomed to bond volatility and we had plenty of it (although still less than stocks). In fact, the first three quarters of 2022 were all among the 5 worst quarters for the Bloomberg U.S. Aggregate Bond Index since its inception in 1976.
But the tide does seem to be turning. While the fourth quarter of 2022 and the first quarter of 2023 weren’t spectacular for the 60/40, using the total return for the S&P 500 Index and the Bloomberg U.S. Aggregate Bond Index as our proxy for stocks and bonds, the 60/40 has been on solid footing the last two quarters, as seen in the chart below. Both stocks and bonds were up both quarters with the 60/40 for each quarter in the top 30% of historical values.
But that’s looking backward. What about looking forward? LPL Research’s Asset Allocation Committee sees reason to be bullish on the 60/40 over both a tactical and a strategic time frame.
Looking at bonds from a tactical perspective, with higher starting yields, a Federal Reserve (Fed) likely near the end of its rate hiking campaign, and inflation coming back down, not only do return prospects look brighter for bonds, we believe they have become more likely to return to their historical role of a portfolio diversifier in the event of an economic downturn…
Turning to the strategic perspective, we base our outlook on our long-term capital market assumptions, which look ahead 10 years and are based on the long-term drivers of returns. For stocks, that’s largely the outlook for earnings growth together with some expectation that valuations will move toward historical norms. For bonds, the main driver is yields, which are generally solid predictors of returns 5–10 years out. (Stock forecasts, by contrast, are subject to greater variability even over a 10-year time horizon.)
As seen in the table below, our long-term forecasts for stocks and bonds, again using the S&P 500 Index and the Bloomberg Aggregate as proxies, improved substantially from 2022 to 2023. While stock valuations remain somewhat elevated relative to history, giving us a below-historical return expectation, they did see some improvement during the downturn, with prices coming down more quickly than forward earnings expectations. The jump in bond returns is even more meaningful as the downside from higher yields (falling bond prices) turns into upside looking forward. Between the two, our forecast for a 60/40 portfolio improved 2.3 percentage points, which over the course of a 10-year investing cycle would make a profound difference to returns.
While our outlook for the 60/40 portfolio has improved and we believe many investors remain overly cautious—on fixed income markets in particular—we shouldn’t forget the lessons learned in 2022. Bonds are risky assets, even if core bonds are generally not as risky as stocks, and are vulnerable to downturns. And while high quality bonds have historically acted as an effective portfolio diversifier much of the time, they will not necessarily all the time. There were also some effective hedges against losses in 2022 that investors can sometimes forget when the 60/40 is on a roll, especially in alternative investments. We do believe that there are ways in which a portfolio can be better diversified beyond the traditional 60/40, but we think the 60/40 remains a sound foundation for a diversified portfolio, both tactically and strategically, something that is easy to forget after the challenges of 2022.
Seems like an urge of caution and I say so in an effort to offer a semi-appropriate segue — from Prof (stocks for the long run) Siegal,
Positioning for Cautious and Bearish Outcomes
It was a holiday shortened week for equity markets, but not for economic data teams on Friday, with the all-important labor market report coming after quite an interesting week on the data front.
The week started out with some of the weakest data we've had this year. The sharp drop in job openings in the JOLTS data jolted the market to the downside—as it was the first-time job openings had been below expectation in quite some time. ADP’s report on employment came in soft. And then both the ISM service data and durable goods orders also came in on the weaker side.
These weaker economic reports brought the 10-year bond yield down to 3.20% as investors braced for a weak employment report print. Yet, Good Friday’s jobs data came out in-line with consensus estimates—a good Friday indeed! Yields jumped back up and stock prices held in there in the futures market.
The payroll number came in almost exactly as expected. But the good news from a Federal Reserve rate hike perspective was month-over-month hourly earnings coming in as expected, while year-over-year earnings ticked down 1/10th below expectations. Also good news was an increase in the labor force participation rate, which has shown a really nice recovery back to nearly March 2020 levels after increasing four consecutive months.
We also had another 1/10th drop in hours worked each week. Economists focus too much attention just to the headline payroll number. But I often point out in these commentaries 1/10th of an hour worked each week is equivalent to almost 300,000 workers at the same number of hours. The drop in the hours more than nullified the jump in workers in this report. I think this exemplifies softness—not a complete falling apart but a downturn in employment trends. Further, there were large revisions to the weekly jobless claim figures, which hadn’t looked realistic to me for weeks. Seasonal adjustment factors caused an under-reporting of the weekly jobless claims—again showing more softness in the labor market.
Most importantly—all this economic data is pre–Silicon Valley Bank (SVB) failure and the banking ‘crisis.’ It will likely take 4-6 weeks before SVB’s impact is fully seen, and I am concerned about the rising risk of a recession.
The CPI will be released this Tuesday. It will be important to see the core numbers ex-housing continuing a disinflationary impulse to allow the Fed to pause rate hikes before cutting. The market is leaning towards 25 basis point hike at the next May meeting, but it is close of being a 50/50-coin flip and we have more data reports that will alter probabilities in the next four weeks.
While I am leaning cautious for now, I always think recessions are great buying opportunities. I don't sell equities in anticipation of a recession, but I know a lot of other people do, which could lead to weakness in the equity markets. I do not see a crash, and I think last October’s lows should hold. Despite all the real hits we’ve taken this year, the market has really held up quite well. That tells me many are already positioned for very cautious and bearish outcomes.
To the professor’s point, from Twitter (and yes, I believe EVERYTHING I glean from fintwit)
Speculators boosted their net-short bets on $SPX futures to the highest level since 2011, the CFTC data released on Friday show.
Seems like it is worth keeping this in mind the next time we start thinking good news is bad and vice versa, in effort to find simple explanation of price action? Moving along and as far as BANKS, banking and the economic impact of (lack of) lending goes, Goldilocks,
Small Banks, Small Business, and the Geography of Lending
The recent stress in the US banking system has been concentrated among small and midsize banks, which play an important role in financing small businesses. In this Analyst, we review the links between small businesses and small banks, the geography of small business borrowing, and the alternatives sources of credit available to small businesses.
Small businesses with fewer than 100 employees employ 35% of the private sector workforce and produce 25% of gross output. They rely disproportionately on small banks for loans, receiving almost 70% of their commercial and industrial loans from banks with less than $250bn in assets and 30% from banks with less than $10bn in assets (vs. 45% and 10% for larger businesses, respectively). The link is much stronger outside of large cities: in over half of US counties, non-GSIB banks provide 90% of loans to small businesses.
We have recently estimated that bank stress is likely to reduce lending growth by 2-6pp (link1, link2). Because small banks are likely to tighten credit more aggressively and small businesses disproportionately borrow from them, the hit to lending to small businesses will likely be larger.
Small businesses will not be able to replace small bank lending quickly and costlessly in all cases because of frictions in the financial system. Economic research has shown that existing relationships with banks and close geographic proximity—both of which allow lenders to better gauge the riskiness of a borrower—are important factors that banks consider when deciding whether to extend credit to small businesses. This will likely make it difficult for small businesses to simply turn to large banks instead because roughly two-thirds of US counties lack a GSIB branch, and the experience of the PPP program shows that it can take time for new banking relationships to form.
Small businesses also have less ability to turn to non-bank financing channels, for two reasons. First, unlike large businesses, small businesses are unable to tap public debt markets. Second, small businesses make much less use of the nonbank lenders (e.g. hedge funds, pension funds, insurance companies) whose loans now exceed those from banks for larger companies.
I’ll leave that alone and move along to some news overnight and this one is for the de / dis inflation’istas out there …
China: CPI slows as goods inflation eases, PPI stuck in deflation
Weaker-than-expected headline CPI inflation and wider PPI deflation suggest inflation is not a concern, even as the reopening-driven recovery continues. A still-lacklustre labour market and low manufacturing utilisation should help contain any rebound in inflation this year. We lower our forecasts.
March: 0.7% y/y for CPI, and -2.5% y/y for PPI
Bloomberg consensus forecast (Barclays): 1.0% (1.3%) y/y for CPI, and -2.5% (-2.0%) y/y for PPI
February: 1.0% y/y for CPI, and -1.4% y/y for PPI
Finally, from the FRBNY out at the end of last week (April 6th),
Global Supply Chain Pressure Index (GSCPI)
Estimates for March 2023
Global supply chain pressures decreased again in March, falling from .28 to 1.06 standard deviations below the index’s historical average.
There were significant downward contributions by many of the factors, with the largest negative contributions from European Area delivery times, European Area backlogs, and Taiwanese purchases.
The GSCPI’s recent movements suggest that global supply chain conditions have largely normalized after experiencing temporary setbacks around the turn of the year.
Finally, on this day in history, we remember (via Wiki),
"Houston, we've had a problem..."
Apollo 13 was the seventh crewed mission in the Apollo space program and the third meant to land on the Moon. The craft was launched from Kennedy Space Center on April 11, 1970, but the lunar landing was aborted after an oxygen tank in the service module (SM) failed two days into the mission. The crew instead looped around the Moon, and returned safely to Earth on April 17. The mission was commanded by Jim Lovell with Jack Swigert as command module (CM) pilot and Fred Haise as lunar module (LM) pilot. Swigert was a late replacement for Ken Mattingly, who was grounded after exposure to rubella.
NASA HERE for MORE
… THAT is all for now. Off to the day job…


You could do worse than reading https://s201.q4cdn.com/589201576/files/doc_downloads/2023/03/Q1-2023-Mid-Quarter-Update-vFINAL3-030823.pdf and then developing a list of key search phrases, for example, "banks with high net loan growth" while-U-wait.