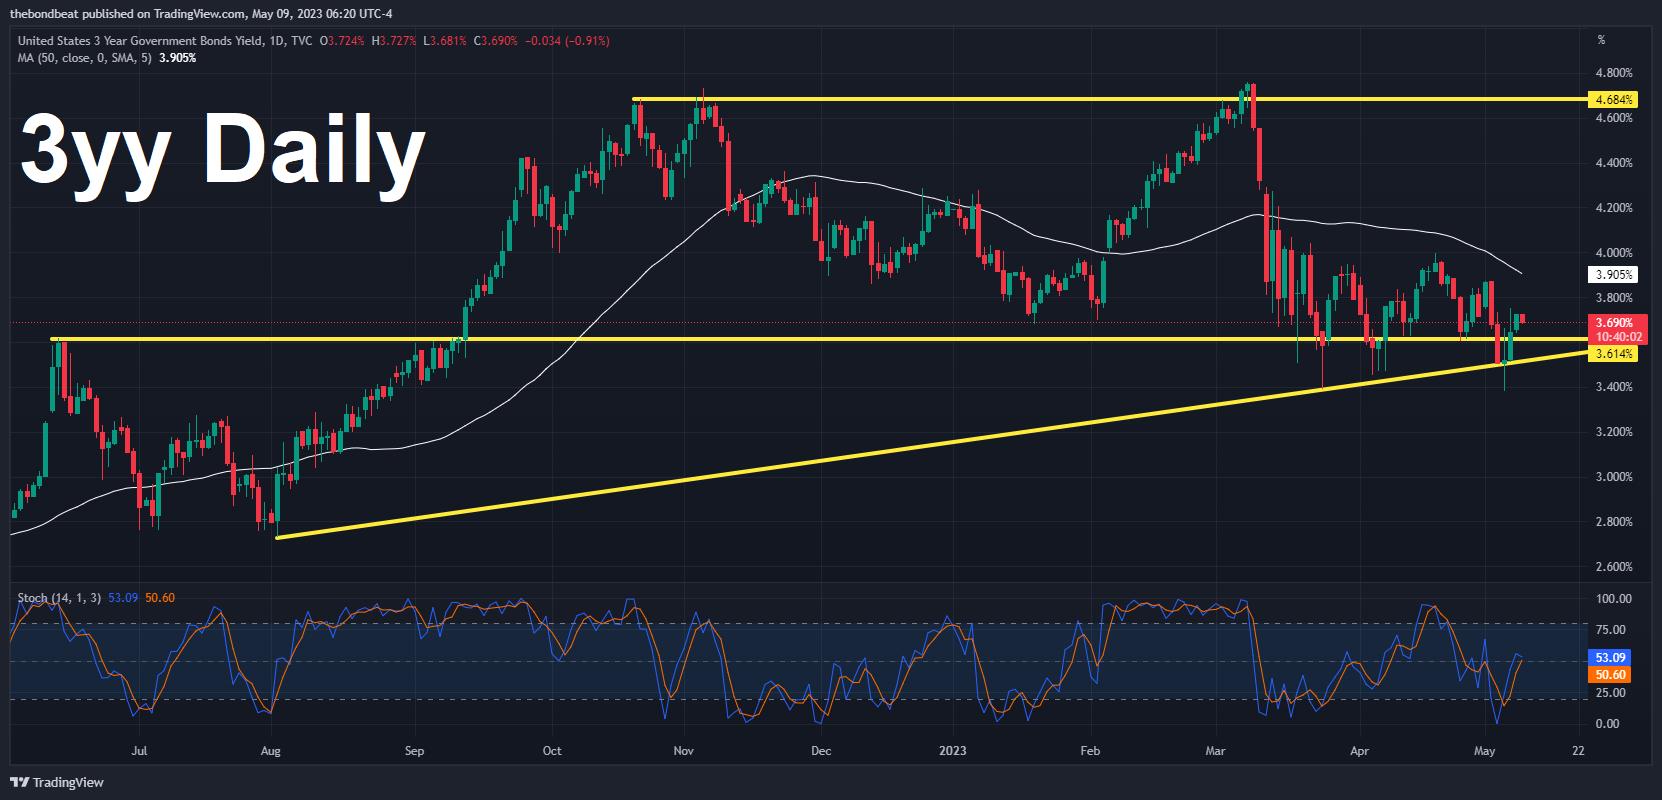
Good morning … with reFUNding kicking off today, I must begin with a marked up version of 3yy sitting on my desktop …
AND while the layout of the chart strikes ME as at least visually bullish — lower highs and a declining 50dMA (3.905%), there’s a very bla momentum setup (technical term, trust me) and so, not much here to get excited ‘bout IMO. Not yet …. What do YOU see …
Now in as far as the news of the MORNING goes, well HERE is the NFIB Small Biz Optimism REPORT
Optimism is not improving on Main Street as more owners struggle with finding qualified workers for their open positions,” said NFIB Chief Economist Bill Dunkelberg. “Inflation remains a top concern for small businesses but is showing signs of easing.
Key findings include:
The frequency of reports of positive profit trends was a net negative 23%, five points worse than March.
A net negative 5% of owners viewed current inventory stocks as “too low” in April, down six points from March. This suggests stocks are now too large relative to expected sales.
The net percent of owners raising average selling prices decreased four points to a net 33% (seasonally adjusted).
The net percent of owners who expect real sales to be higher deteriorated four points from March to a net negative 19%.
AND to be fair, some view the survey as completely WORTHLESS and so it’s only a matter of time ‘til SOMEONE, somewhere says same about SLOOS. Until THEN, well, make of this what you will…
ZH: SLOOS Finds Even Tighter Credit Standards, A Collapse In C&I Loan Demand, And A Dire Outlook For Rest Of 2023
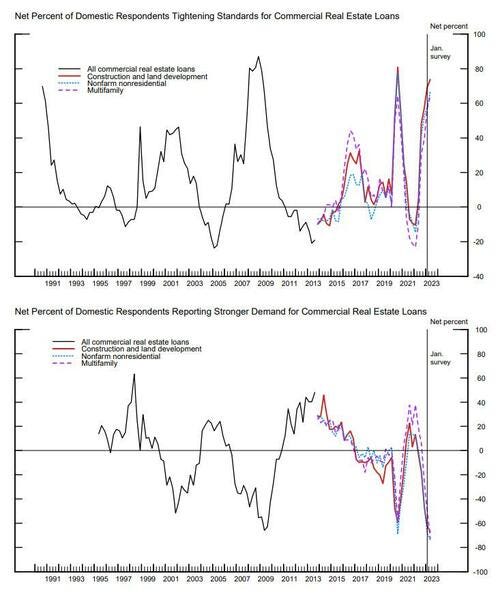
… But wait there's more: with everyone freaking out about commercial real estate, the April SLOOS included a special question inquiring about banks' changes in lending policies for CRE loans over the past year; about the reasons why banks changed standards for all loan categories over the first quarter; and about banks' expectations for changes in lending standards over the remainder of 2023 and reasons for these changes.
… Bottom line, and this should come as a surprise to nobody,banks reported tightening lending policies for all categories of CRE loans over the past year, with the most frequently reported changes pertaining to wider spreads of loan rates over banks' cost of funds and lower loan-to-value ratios.
AND … here is a snapshot OF USTs as of 707a:
… HEREis what this shop says be behind the price action overnight…
… WHILE YOU SLEPT Treasuries are higher with the curve little changed after China's import and export data disappointed expectations (link above) and NFIB fell in April to a decade low of 89.0. Meanwhile, hawkish comments from ECB's Kazaks and Kazimir have been taken well by Bunds. DXY is higher (+0.14%) while front WTI futures are lower (-0.9%). Asian stocks were mixed (Japan higher, China lower), EU and UK share markets are all in the red (SX5E -0.75%, FTSE 100 -0.5%) while ES futures are showing -0.35% here at 6:45am. Our overnight US rates flows saw better buying in the long-end from real$ names during a quiet Asian session. In London's AM hours we saw further real$ interest in the long-end and mixed activity further in the curve. Overnight Treasury volume was ~85% of average overall with 3yrs (137%) seeing some relatively high average turnover ahead of today's auction.
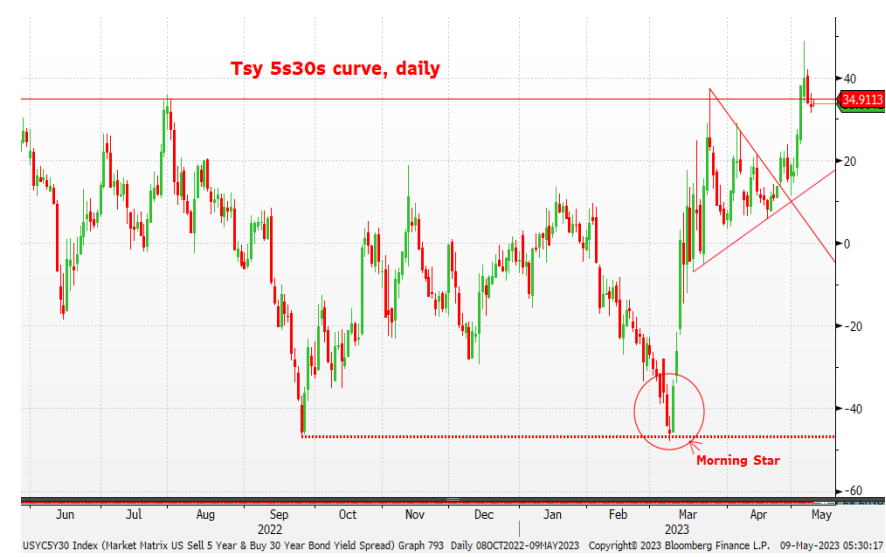
… The Treasury 5s30s curve is predictably set-up similarly with last summer's range high near 35bp acting as a topside cap. 5s30s ran out of steam there last week and also back in March as well (note that Shooting Star uptrend exhaustion candles marked the March high and last week's move high too...).
The Treasury 2s5s curve appears to have feathered its nest near 50bp of late, so far finding support from its late January to early March range highs near -55bp. This curve seems to be waiting for new news before leaving its nest.
… for some MORE of the news you can use » IGMs Press Picks for today (9 MAY) to help weed thru the noise (some of which can be found over here at Finviz).
From some of the news to some of THE VIEWS you might be able to use… here’s what Global Wall St is sayin’ …
Since I’ve already noted NFIB and SLOOS, I must continue along with a few SLOOS views,
Barcap: April SLOOS shows further tightening in lending conditions BMO SLOOS: Too Soon or Too Isolated? GS: Senior Loan Officer Opinion Survey Reports Tighter Standards and Weaker Demand for C&I and CRE Loans in Q1 … On net, the report was better than we were expecting, but the details are slightly worse (e.g., in the CRE and multifamily residential categories) than the headline C&I tightening measure suggests. Uncertainty remains high regarding the timing of tightening in the current environment. UBS: … Reports from the Federal Reserve have indicated ongoing tightening of lending standards by US banks. Larger banks are tightening out of concern for the economic outlook. Smaller banks are tightening out of concern about deposit movements and liquidity.
From SLOOS VIEWS to a few words on CHINA
Barcap: China: Weak trade data point to slow Q2 growth
The notable slowdown in exports confirms our skepticism about the sustainability of the export rebound. With new export orders falling into contraction, we expect exports to continue to weaken in coming months. The bigger-than-expected drop in imports led by commodities and autos points to weaker domestic demand.
April: 8.5 y/y for exports, and -7.9% y/y for imports (both in USD terms)
Bloomberg consensus (vs Barclays): 8.0% y/y (7.5%) for exports, and -0.3% y/y (-0.8%) for imports
March: 14.8% y/y for exports, and -1.4% y/y for imports (both in USD terms)
China reported strong export values and falling import values in April. Beijing certainly focused on getting stronger exports reported at the end of the first quarter (and first quarter GDP growth was boosted by reported export numbers). While it is difficult to marry up one country’s export data with another country’s import data, it is quite difficult to see where the reported exports are going. Slowing demand for goods does suggest that global trade volumes are likely to decline as a share of the world economy…
Turning away from China and back TO the USofA in effort to close with a bit of optimism (?)
Yes, we have banking problems. No, this is not 2008. It’s much more like the 1970s Savings & Loan problems. In other words, we do not have credit problems today, we have duration (asset-liability) problems. These are exacerbated by the fact that Quantitative Easing inflated total deposits in the banking system.
…Finally, in the past year, M2 has contracted by 4.1%, the fastest drop the US has experienced since the Great Depression. However, in spite of this decline, M2 is still up $5.4 trillion from where it was pre-pandemic. The decline in M2 will show up as a decline in deposits at some banks, but the bulge in money has still not worked its way entirely through the economy. Hence, for the time being, some modest continued economic growth.
In other words, inflation is likely to remain elevated this year and the Fed is unlikely to cut rates anytime soon. The end of the story is not written. We fully expect more banking problems, but also anticipate these problems to be dealt with by policies that kick the can down the road. The stock market appears to be saying “no problem” – we think it may be overly optimistic about that.
I reiterate, at least it’s NOT 2008?! Since we’re at that point of the morning where we are trying to connect dots from past crisis to present, another fan fav analog,
ABNAmro: That 2011 feeling: A Q&A on the US debt ceiling impasse | Insights newsletter
Historical precedent suggests negotiations to raise the debt ceiling are likely to go right to the wire, but that Republicans and Democrats will ultimately reach a compromise to prevent the US government from defaulting on its debt obligations. In the meantime, financial markets are likely to become increasingly sensitive to developments over the coming weeks as the US Treasury runs down its cash buffers.
Fitting quick read as talks being today with McCarthy and Co heading TO the Biden WH … As the meeting of the minds occurs, here’s one of
To support their pessimistic outlook, bearish prognosticators tend to focus on two charts. The first one shows the S&P 500 versus the securities held by the Fed, which account for most of the Fed’s balance sheet (chart). They contend that the bull market in stocks from 2009 through 2021 was driven by the Fed’s various quantitative easing programs. The S&P 500 peaked at a record high on January 3, 2022 as investors started to anticipate quantitative tightening (QT), which started during June of that year. The Fed remains on its QT course, which suggests to these bears that the rally since October 12, 2022 is a rally within a bear market.
We think that the stock market’s trend is driven mostly by the trend in earnings. We doubt that QT will cause either an economic or an earnings recession, let alone both. In our “rolling recession” scenario, earnings growth may be weak, but it should be positive.
The other? I’ve no idea as it’s behind the paywall…this one here, though, is def a fan favorite from back in the QE day…
For a few MORE words on debt-ceiling game of chicken (and SLOOS) — originally discussed HERE back in Feb where the WSJ was kind enough to spell out some of the rules,
It’s not the first time Washington has witnessed the looming possibility of a catastrophic default. Congressional leaders remain stuck in a partisan deadlock that risks what many believe would be a constitutional crisis — but this has happened before, and the worst has always been avoided.
Many still view this debate as nothing but political showmanship. Bill Gross, the former chief investment officer of Pacific Investment Management Co., on Monday told Bloomberg’s ETF IQ that the stalemate was “ridiculous.” He recommended buying short-term Treasury bills, expecting the debt-ceiling issue eventually gets worked out. In his words, “It is always resolved.”
But worries on Wall Street are stronger this time, perhaps exacerbated by various warnings from Treasury Secretary Janet Yellen, who said on Sunday that there are “simply no good options” for solving the debt limit stalemate and warned of “an economic and financial catastrophe that will be of our own making.” The former Federal Reserve chair upped the stakes last week by warning lawmakers that the Treasury’s ability to use special accounting maneuvers to stay within the debt limit could be exhausted as soon as June 1. Herdepartment has been finding ways to make cash available since the government hit the statutory limit of $31.4 trillion in January, but it can’t keep that going much longer:
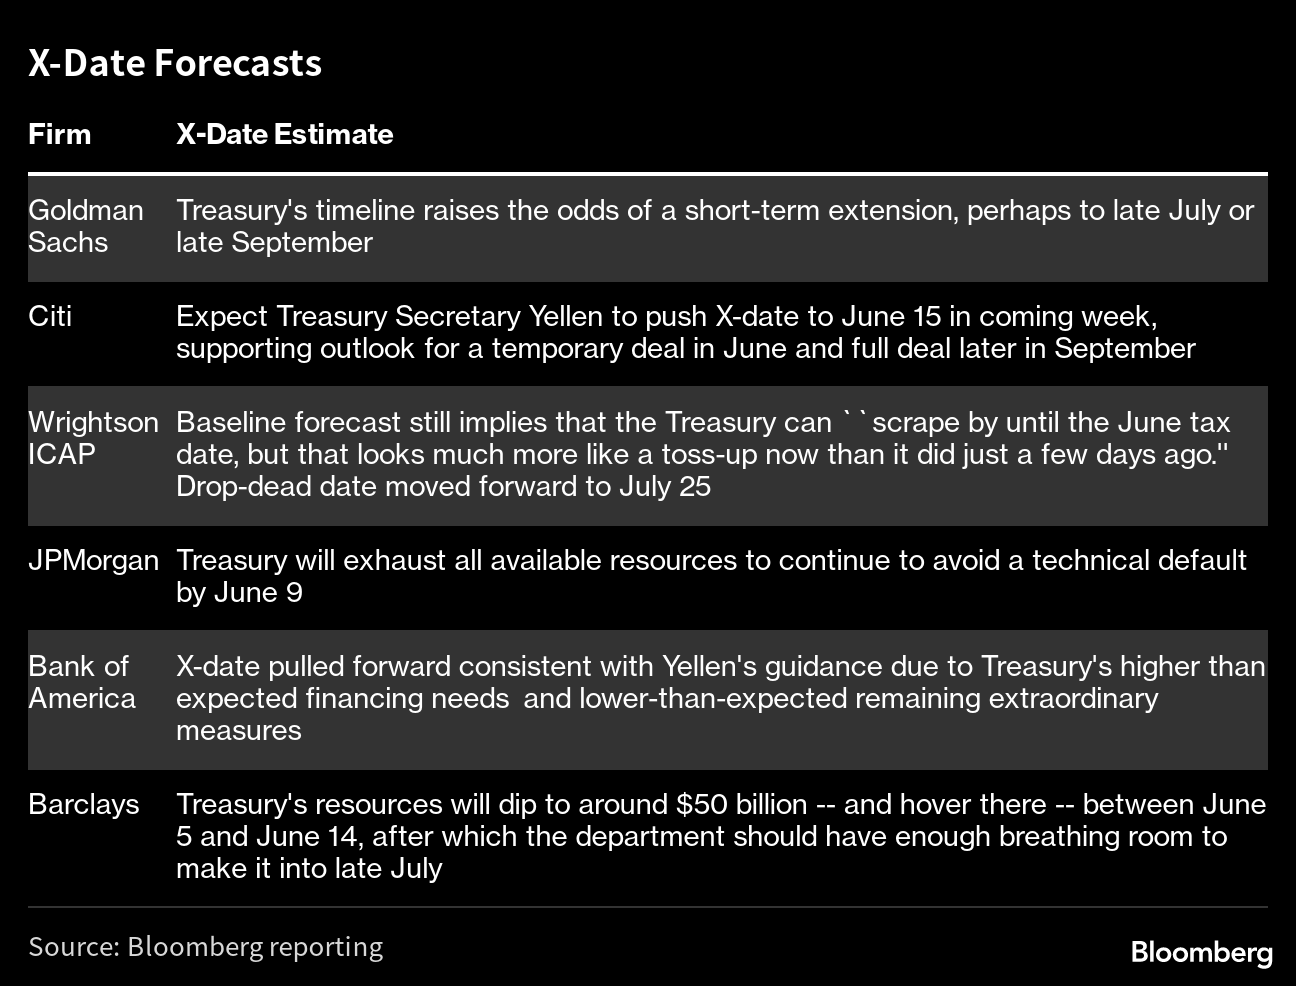
Bill Dudley, former chairman of the New York Fed, warned in Bloomberg Opinion that the situation could be “disastrous.”The angst is exacerbated by widely varying estimates of when the government might exhaust all its options, commonly known as theX-date. Some prognosticators have given their best guesses, deriving their forecasts from government cash flows and expectations around tax and spending. Colleague Alex Harris compiled them in the graph below — with dates ranging from June to July:
The uncertainty doesn’t help, and the idea that the X-date could come as early as June 1 caught market participants by surprise. UBS Global Wealth Management strategist Solita Marcelli points out that bid-ask spreads have widened and yields have increased sharply at the short end of the curve, which is more exposed to potential default worries. The difference in the yields on Treasury bills that mature before the likely X-date(May 23) and after it (June 13) has grown spectacular:
Equity investors, however, have not reacted with the same concern, and the S&P 500 continues to grind higher. The same is true of a range of other risk assets. That could create an opportunity for short sellers in the next few weeks (along with a buying opportunity when and if the ceiling is lifted).
The next big moment comes Tuesday, when President Joe Biden is scheduled to meet House Speaker Kevin McCarthy and other congressional leaders. The meeting is high stakes. Republican leaders want promises of future spending cuts before they approve a higher ceiling, while Biden is insisting on a “clean” increase. Apart from the debt talks, it could also be one of the last — maybe only — substantive policy negotiations before the 2024 elections.
Dan Suzuki, deputy chief investment officer at Richard Bernstein Advisors, said the riskier element in this impasse, compared to previous debt-limitconfrontations, comes from the dealmakers themselves, particularly in the House. There’s little incentive for Biden’s Democrats to negotiate with McCarthy if the far-right of his Republican caucus immediately rejects any deal, he says: “This is not something you can predict based on macro fundamentals. It’s psychological warfare.”
Still,further reason for anxiety does come from the macroeconomic landscape, said Peter van Dooijeweert, head of multi-asset solutions at Man Group. Things were bad in 2011, the first great confrontation and the closest the US has ever come to a payments default, but rates were low and there was no concern over inflation. Arguably, this time is riskier:
In 2011, it was a huge mess because the US had come off a debt downgrade and Europe was going through its own sovereign debt crisis. Today, the backdrop is fairly severe stress in regional banks which might involve congressional intervention to raise FDIC insurance caps. If they are mired in a debt ceiling battle, it feels difficult to imagine they can also address a burgeoning banking crisis. On top of that, Fed has hiked very far and very fast and QT is ongoing. That alone is a lot for the economy to process even before the banking troubles.
In 2013 there was another impasse, and analysts are studying how markets behaved then for an idea on how they may play out today. Here’s Marcelli of UBS again:
The S&P 500 experienced a 17% peak to trough decline in the weeks before and after a debt deal was finalized in 2011. But in 2013, the maximum drawdown in equity markets was less than 6% and the S&P 500 notched a total return of 32% in calendar year 2013... In contrast with 2011, the global economy was on an upswing with consistent improvements in business sentiment and stability in corporate profit growth expectations.
Ominously, this latest brinkmanship comes as the economic parallels to 2011 look far more striking. Let’s hope the politicians understand that.
— Isabelle Lee
Revenge of the Killer Acronyms
There’s nothing like stress on the economy to broaden your knowledge. All kinds of obscure data points begin to matter. And they often come with memorable acronyms. Last week, traders waited in trepidation for the JOLTS, or Job Openings and Labor Turnover Survey, which caused great excitement by revealing a sharp drop in vacancies. On Monday, it was time for the SLOOS (Senior Lending Officers Opinion Survey), published quarterly by the Fed. This was the first such survey since regional bank failures began in early March, which have been widely interpreted to mean that the Fed will be forced to reduce interest rates sooner rather than later, a consummation devoutly wished by many investors.
To gauge just how important lending conditions are now perceived to be, this report prompted a “flash crash” selloff in the stock market:
The swift recovery came as people read through the details and saw that the numbers weren’t as scary as the headlines appeared. Those headlines, from Bloomberg, were:
* FED: SURVEY SHOWS TIGHTER CREDIT, WEAKER BUSINESS LOAN DEMAND
* FED: SHARE OF BANKS TIGHTENING CREDIT AT 46% VS 44.8%
* FED: BROADEST SHARE OF BANKS WITH WEAKER LOAN DEMAND SINCE '09
All of these numbers are accurate, and reveal that financial conditions are indeed tightening in a way that may well portend a recession. But what they didn’t show was any sudden stop change during the first quarter. Indeed, nothing about the data suggests that anything extreme happened to the US banks recently. Ian Lyngen of BMO Capital Markets pointed out that of the 63 large and mid-market banks in the survey, more than half thought credit conditions were unchanged during the quarter. Only 3.2% thought they had “tightened considerably.”
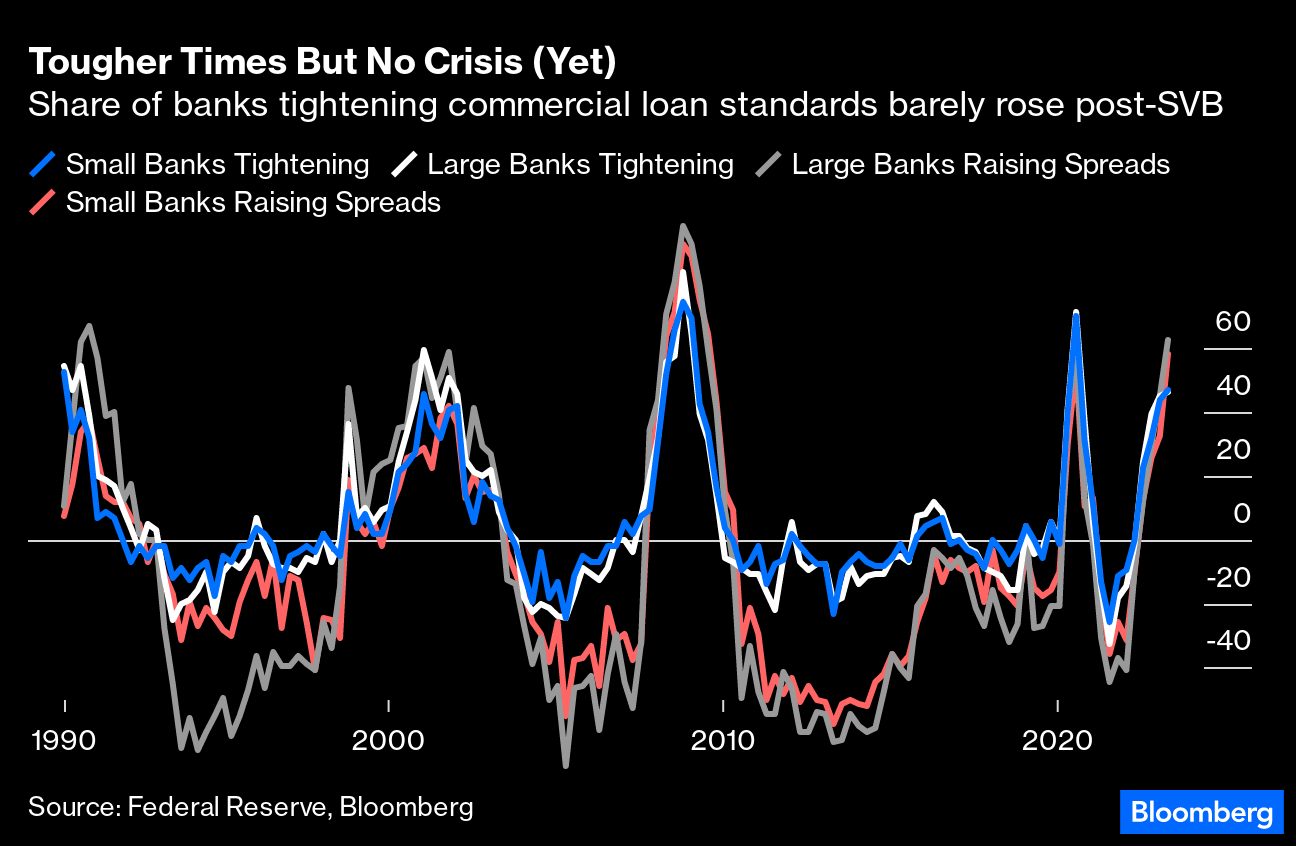
The chart below, on commercial and industrial loans, illustrates where that crisis might have been expected to show up. It documents the proportion of both larger and smaller banks choosing to tighten their credit standards, and to raise the spreads they charged over their funding rates. There is little difference institutions based on their size, a surprise after recent events, and the number of banks tightening standards barely moved. The proportion jacking up their spread did rise, but the point stands that this is not a sudden major crisis:
Against that, it’s equally obvious that credit standards are elevated, approaching their highs from the Covid lockdowns and from the recession that followed the bursting of the dot-com bubble. The SLOOSadds to the evidence that a recession might well be coming; but stocks recovered within minutes of publication because it doesn’t suggest that we are in the grip of a crisis.
The picture for commercial real estate loans, a particular center of concern, looks tougher — but at least the pressure isn’t as tight as during the worst of the pandemic. It doesn’t appear as though the spate of bank failures has changed the picture:
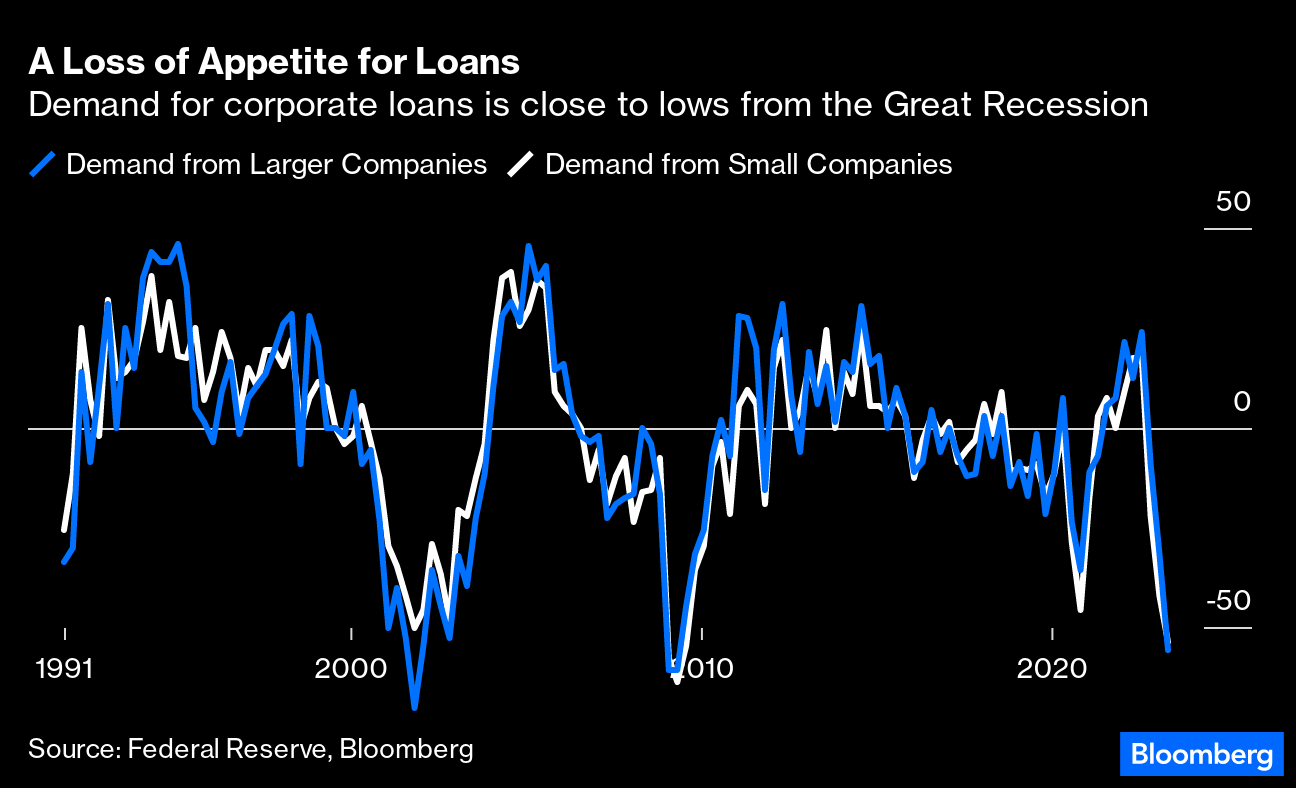
Surprisingly, the most worrying numbers came fromthe demand for credit rather than its supply. Appetite for borrowing from both large and small companies has dived more than during the lockdown era, and is close to the lows set during 2001 and the Global Financial Crisis seven years later. Lyngen admitted that falling loan demand was “somewhat counterintuitive in light of the potential need for liquidity in the near-term,” and also suggested that it might have been a reflection of the less favorable loan terms now on offer to them. However interpreted, it’s not positive:
Given this, it might seem strange that the corporate sector is still in good health. The main reason may be that the corporate credit market isn’t tightening in the same way that banks’ lending officers are. The divergence is startling, and it’s hard to see how it can be sustained, but while it lasts diminishes the pressure on financial conditions. The following chart was offered on Twitter by the hedge fund manager Boaz Weinstein of Saba Capital Management LP:
The SLOOS gave ample reason for concern. But the credit market is still softening the impact of banking difficulties, and at least the survey doused fears that the financial system is headed for a major seizure. That the headlines still prompted a brief market spasm is testament to present anxiety about the banks. People remain prepared to believe the worst…
Finally, REALLY struggling but attempting to end on a high note, a few words from Mr. STOCKS FOR THE LONG RUN,
… My bottom line: the bar is very high for raising rates again in June. I think you need much more than this hot jobs number and wage growth. We will get another employment report before the June meeting, which would have to be much stronger than expected. We have the inflation report this week and interestingly, another inflation report the day the June Fed meeting begins. We would have to get three really hot data prints for the Fed to hike rates again in June, in my opinion.
The bar is also high to reduce rates, but I do think that will happen later this year. What it will take to cut in my view is, as I mentioned above, negative payroll numbers. Job declines will open eyes and hit the headlines. We are getting into the political season and the pressure on the Fed not to be overly tight will increase dramatically if we get a string of negative payroll reports and a jump in the unemployment rate.
In the summer and fall months, I expect to see these declines. The initial disturbances from the Silicon Valley Bank (SVB) and Signature Bank failures did not have any meaningful effect in the April data. We don't really know whether the problems of First Republic and other west coast banks will be more substantial. Some at the Fed believe the tightness in bank lending standards is equivalent to a single hike. I believe the lending contraction will be constrictive and equivalent to at least 2-3 and maybe even 4 hikes…
Oh forget it … good is bad and bad is worse, at least as far as news goes? Perhaps the good professor is reading the ‘good news’ via a letter from FRBSF,
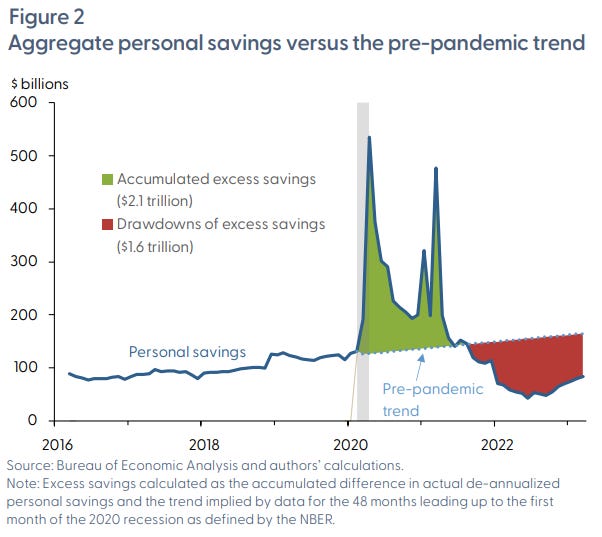
U.S. households built up savings at unprecedented rates following the strong fiscal response and lower consumer spending related to the pandemic. Despite recent rapid drawdowns of those funds, estimates suggest a substantial stock of excess savings remains in the aggregate economy. Since 2020, households across all income levels have held a historically large share of savings in cash or other easily accessible forms. Estimates suggest that those funds could be available to support personal spending at least into the fourth quarter of 2023.
…Conclusion U.S. households accumulated excess savings at an unprecedented speed following the onset of the pandemic recession, relative to other post-1970 recessions. Despite recent rapid drawdowns of those savings, a large amount—around $500 billion—remains in the overall economy.
A great deal of uncertainty surrounds precisely how the savings are distributed across household income levels and in what kind of assets they are being kept. Nonetheless, data on household assets and checking account balances support the view that households across the income distribution generally have considerably more liquid funds at their disposal compared with the pre-pandemic period.
Overall, we expect the aggregate stock of excess savings will continue to support consumer spending at least into the fourth quarter of 2023. However, uncertainty also surrounds this outlook, including the possibilities that households may now have a higher appetite for savings, significantly shift their spending habits, or receive other sources of income that offset the expired pandemic-era cash inflows.
AND … don’t forget to ‘tip your waiter’,
Good luck as you plan your 3yy trades and TRADE your 3yy plans and … THAT is all for now. Off to the day job…