(USTs higher, flatter on solid volumes)while WE slept; Happy (?) Rate-Cut-A-versary; "...The bond market thinks this economic bad news is just getting started."
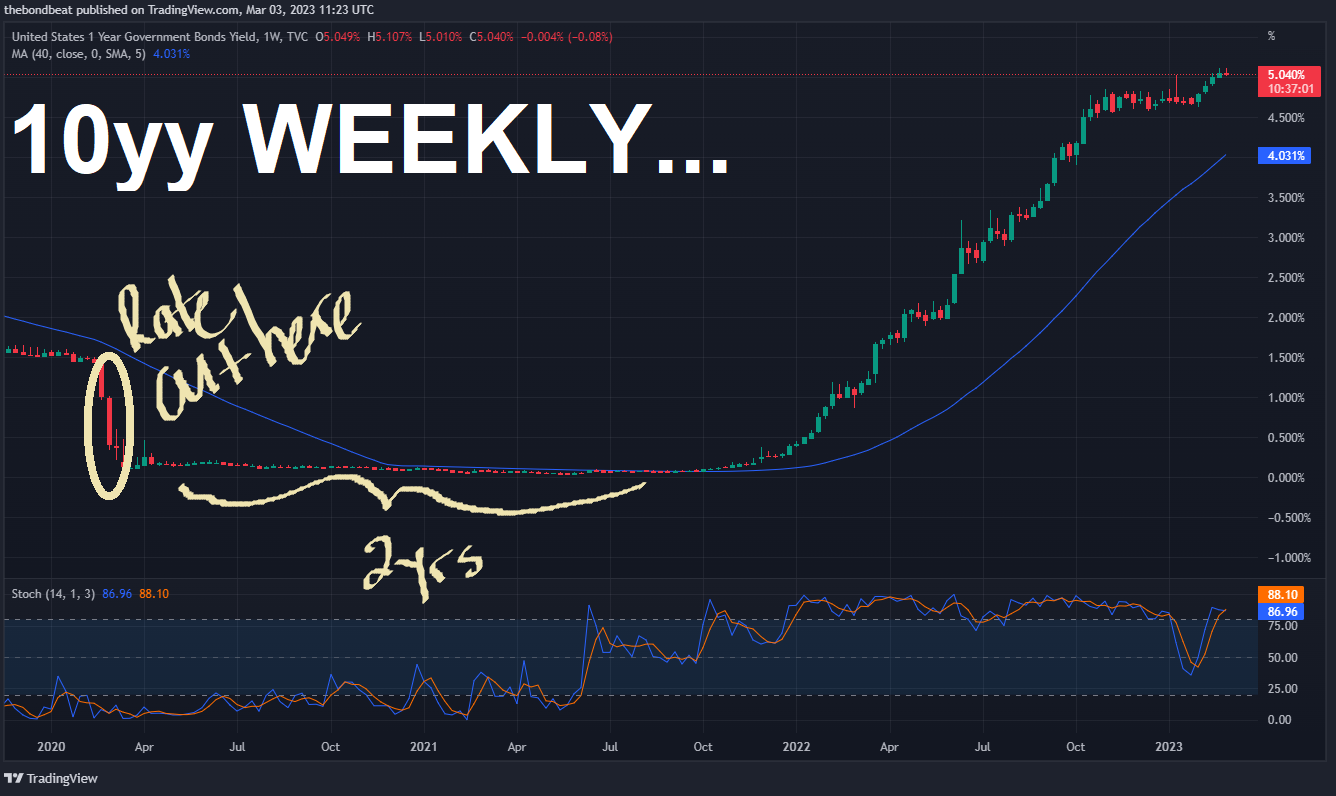
Good morning … happy Rate-Cut-A-versary!!
Fed.gov HERE and … At the time, 2yy were all of 86.5bps, 5s were 88.5bps, 10yy were 1.12% and long bonds were 1.65%. A (weekly)visual walk down memory lane …
The rest is, as they say … historic. Perhaps NOT as historic as Waller ZOOM speech (on “February’s Hot Data Releases”) being porn-bombed
… here is a snapshot OF USTs as of 705a:
… HERE is what another shop says be behind the price action overnight…
… WHILE YOU SLEPT
Treasuries are higher and the curve flatter this morning as probes of rate range supports meet extreme short positioning (see full discussion below). DXY is lower (-0.3%) while front WTI futures are too (-0.5%). Asian stocks were generally higher (Nikkei up almost 1.6%), EU and UK share markets are all higher while ES futures are showing +0.4% here at 7am. Our overnight US rates flows saw modest buying during Asian hours (real$ largely in intermediates to the long-end) while fast$ names appeared to be clipping gains in flatteners. Our London AM session was very busy with good buying of the belly this morning from FRM while EU real$ bought belly spreads. We also continued to see solid demand for bills too with repo starting to heat up for some benchmarks (saw the first cut in Bill supply yesterday with more cutbacks expected through the spring). Overnight Treasury volume was again solid at ~140% of average overall with 30yrs (182%) seeing the highest relative average turnover among benchmarks this morning.… Indeed, yesterday morning in these pages we wrote this: "We're still in a mode where we're on the lookout for signs of local bear trend exhaustion. Such an event could be weeks (and many BPs) away but a new move high that's rejected along with a close that day well below that high, and near the low of the day (tracing out a so-called Shooting Star), might do it." 10 short hours after writing that... the conditions described may have been met. This morning's first attachment takes a look at Treasury 2yrs where, we presume, a lot of the short interest flagged by RPM may be concentrated. Besides tracing out a classic-looking Shooting Star trend exhaustion pattern yesterday, we note in the lower panel that daily momentum (which has guided bearishly since the low 4% area in 2's since January) may be trying to flip bullishly from a deep oversold reading-- a sign of a potentially emerging short squeeze in the front end.
… we shift out to the back-end of the curve to 30yr Treasuries to show their tactical set-up next. Same story here: new 2023 move high rejected yesterday (false breakout?), Shooting Star traced out in the process and then this morning we're seeing an emerging bullish momentum flip (lower panel, circled). Watch today's close to see if it's confirmed.
Today’s (daily/WEEKLY) CLOSE more important than where we are now and so, staying tuned … and for some MORE of the news you can use » IGMs Press Picks for today (3 MAR — and STILL SPORTING THAT NEW LOOK!!) to help weed thru the noise (some of which can be found over here at Finviz).
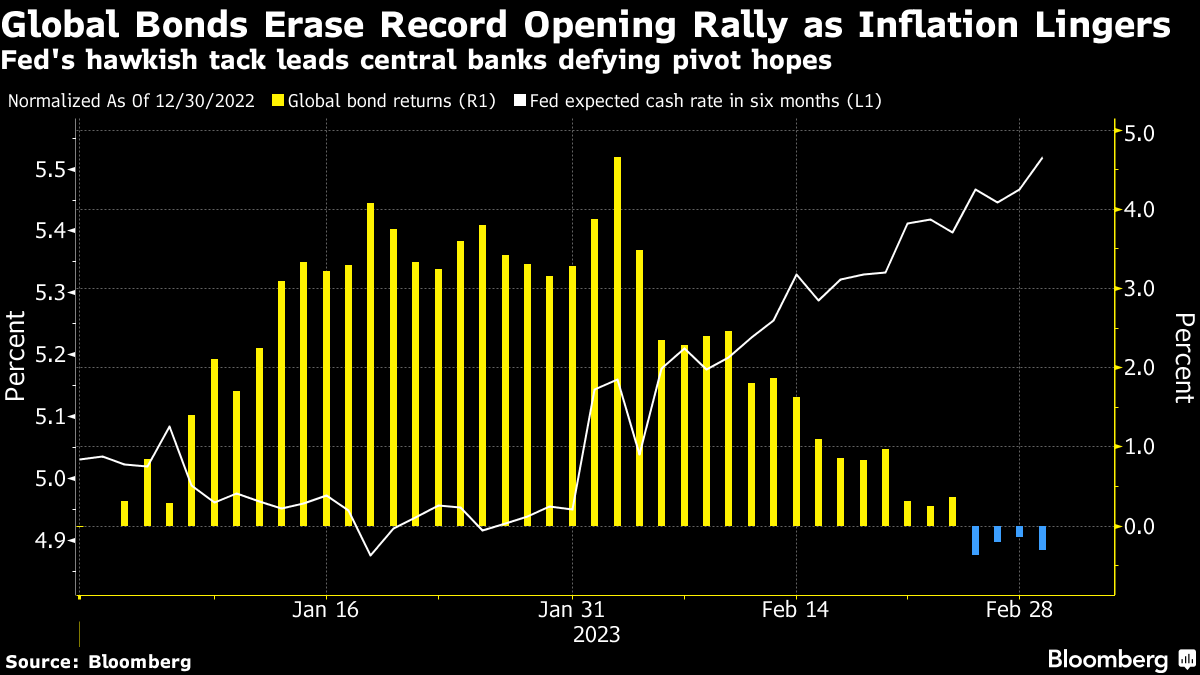
Before I begin … Bloomberg (via ZH)
Now, in as far as some of the news to some VIEWS you might be able to use. Global Wall St SAYS:
ZH notes longs getting longer’er
TD Doubles Down On 10Y Treasury Long In Anticipation Of Hard Landing
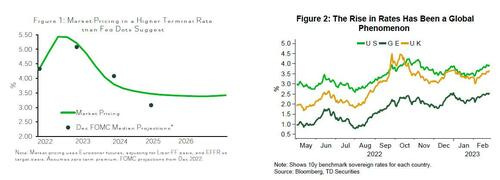
… Reminding readers that she recently initiated a long 10y Treasury as she "thought that Fed pricing was appropriate at 5.25% and bond fund inflows were supportive", since then both inflation and growth data has been very strong and the market is now pricing a Fed effective terminal rate of 5.5% (target FF rate of 5.7%) and the pricing of rate cuts has also declined" Misra writes. As a result of the recent powerful hawkish repricing, markets are now penciling in the first 25bp rate cut by Mar 2024 and a total of 170bp of cuts are priced in the 2y years after hikes end (down from 220bp in mid-Jan). In addition, global rates have risen, putting upward pressure on term premium.
So why double down now?
As she explains, "we initiated only half the risk in our trade since we were worried about strong incoming data, and we double down on the position."
The thesis is simple: the hawkish Fed is likely to take policy even more restrictive, "increasing the odds of a hard landing", and thus a recession which sends yields across the curve sharply lower. Needless to say, strong data remains the biggest risk for the trade since a higher terminal rate will drag the 10y rate higher as well.
"Monetary policy works with a lag and once the savings buffer has been eliminated we think that consumption will slow" Misra predicts, adding that the long TSY thesis is boosted by "bond fund inflows which have continued."
From BUYING DIP to buying exposure TO further upside … THIS from a rather large French operation,
Buy upside to 10y yields via payer swaptions
There is a risk that the US economy may be reaccelerating; should this be the case, we think it opens upside in 10Y yields.
Due to the ongoing uncertainties in this cycle, we express our view via payer swaptions to leverage the upside and limit the downside to the premium paid.
Trade: Buy 3m10y ATMF+15/+50bp payer spread…
Trade: Buy 6m10y ATMF+100bp payer…
We also take advantage of the continued front-end selloff and raise the target and stop on our 1y2y AMTF +25bp payer to 220c and 120c, respectively…
… Policy lags and the impact of QE: We are cognizant that the Fed policy operates on long and variable lags, and it’s possible that the Fed tightening will be more impactful soon. Indeed, our central scenario favors recent economic strength proving fleeting.
Further, most historical hiking cycles have not occurred during the QE era, and it is entirely possible that the stock of QE on the Fed’s balance sheet helps to hold down longer-end yields for the remainder of this cycle.
Still, when the last hiking cycle ended in 2018 (during the QE era), both 2y and 10y UST yields were above the fed funds rate (Figure 2).
And in effort to fully disclose my own present (as well as past)competency, I can barely spell payer spreads let alone having true insight as to these sorts of derivatives, futures and options … So I’ll continue to leave this sorta stuff to those that were and are expert … Mentioning the above as it seems to be an offset (one that seems well timed) given the ability to make money as rates continue to rise.
For some further GLOBAL rates to rise sort of eye candy, self-proclaimed AllStars of charts,
Global Benchmarks Pave the Way for Rising US Yields
… But it’s not just Sweden. Denmark and Finland are also reaching levels not seen in over a decade.
So, will the US follow?
Yes, the US 10-year yield back to 4.50% seems the higher probability outcome as long as the rising rate environment remains intact.
We don’t have a crystal ball. But based on the charts above, we have no reason to doubt this continues to be the case.
So what does the market look like if the US 10-year yield is trending above 4%?
Bonds are most likely catching lower. Growths stocks are experiencing renewed selling pressure. And the growth-heavy US averages continue to grind sideways, underperforming international indexes.
Higher rates will only exacerbate these trends – trends that remain in place from last year.
Whether US yields continue to rise will have broad market impacts that no investor can afford to ignore…
Some who may NOT be all too happy as rate rise … well, buyers of homes without large sums of cash and those who need financing.
Said another way — ZeroHedge
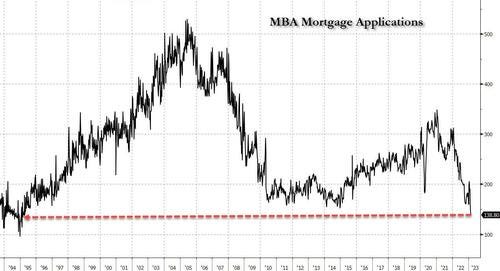
Surge In Mortgage Rates Above 7% Sends Homebuyer Applications To 28 Year Low
… As a result, mortgage applications from homebuyers have been falling for the past month and last week hit a 28-year low.
“The recent jump in mortgage rates has led to a retreat in purchase applications, with activity down for three straight weeks,” said Bob Broeksmit, president and CEO of the Mortgage Bankers Association. “After solid gains in purchase activity to begin 2023, higher rates, ongoing inflationary pressures, and economic volatility are giving some prospective homebuyers pause about entering the housing market.”
With that visual in mind, over TO BAMLs latest Flow Show,
… The Big Picture: higher rates hit Anglo-Saxon real estate…US mortgage to purchase apps at lowest level since Apr'95 (Chart 2)…US/UK/Canada/Aussie/NZ house prices -13% to 5%…we think this is where real estate/PE credit events will be (Chart 5).
Rates continuing to rise in TO what many had deemed a support zone and yet, these high / (still)rising rates will bring some sort of consequence…So says the bond market, as per Bloomberg’s Weekly FIX
The Weekly Fix: Crashing Through 4% as Fed's Path Gets Steeper
The whole Treasury market moved to yields above 4% as a relentlessly robust US data pulse met a similarly robust rhetorical response from policymakers. Federal Reserve Bank of Atlanta President Raphael Bostic, currently deemed on the dovish side by Bloomberg’s spectrometer, is mulling whether the US cash rate will need to go beyond the 5% to 5.25% range he has endorsed as necessary to tame cost pressures.
Markets are already pricing in strong odds for a 5.5% peak, and they’ve backed away from the expectation that the Fed will pivot to rate cuts this year to favor the idea it won't ease policy before 2024. Meanwhile, the trader who bet big in early February on a 6% cash rate has begun unwinding the position, which has already doubled in value since it was put on.
That number four cropped up again in Europe. For the first time, investors boosted bets on the ECB’s peak interest rate being higher than 4% after inflation in France and Spain came in unexpectedly hot. Core CPI growth for the euro area came in at a record high later in the week to underscore the case earlier laid out by the central bank’s Chief Economist Philip Lane. He said the ECB might hold borrowing costs at a high level for some time once they reach their peak.
It all made for a rough start to March after February saw investors hit the sell button across assets. Tumbling bonds completely unwound the gains they made during the market’s best January on record.
Flying High
All the same, the fact that yields are at the highest level in a decade keeps investors clinging to the hope of a strong bond-market rebound at some stage in 2023. There’s also the consolation of the actual income now on offer.
For the first time in more than two decades, some of the world’s most risk-free securities are delivering bigger payouts than a 60/40 portfolio of stocks and bonds.
Short-end yields may also get an extra fillip as the US Treasury Department is on the cusp of once again slashing the amount of bills floating around, potentially creating ripples in funding markets as investors chase a dwindling supply of securities or hunt for other places to stick short-term cash.
… The bond market thinks this economic bad news is just getting started.
To be honest … double back and check out Wallers SPEECH (“February’s Hot Data Releases”) and if anyone out there has a Terminal, and might feel obliged to send along a longer-term visual OF Citi (or BBG) economic surprise index, we might see something of interest.
HERE is some data on said Citi index via Dr. Ed VIGILANTE Yardeni from March 1st,
Surprised? Or not … moving along and for our collective inner stock-jockeys, some FOOD FOR THOUGHT (via Barclays)
Barclays U.S. Equity Strategy introduces "Food for Thought": a weekly brief, published each Friday, that seeks to highlight an interesting and timely chart for investors to consider heading into the weekend. For our inaugural edition, we feature an unexpected divergence in the performance of our business cycle baskets.
Performance of our business cycle baskets point to widespread belief that equity markets are past the trough. Not only has our early recession long/short equity basket lagged significantly YTD, our early expansion basket is up substantially over the same time period, which is telling as to how much weight the market is putting behind a soft landing or "no landing" scenario. Our early expansion basket has delivered excess returns alongside a decoupling of S&P equity risk premium from its long-term relationship to underlying economic growth, underscoring the outsized optimism baked into equity valuations as the Fed is forced to press the inflation battle amid a slowing macro backdrop.
Gettin’ the band back together this weekend (Thing 1 coming home for a few days) SO not sure I’ll have time for proper update ahead of Sunday night futures open BUT I’ll try … THAT is all for now. Off to the day job…


