(USTs higher, flatter on nearly DOUBLE avg volumes -- thanks BoJ!) while WE slept; and long bonds 'threatening an irregular topping structure BELOW 3.405/3.355%'
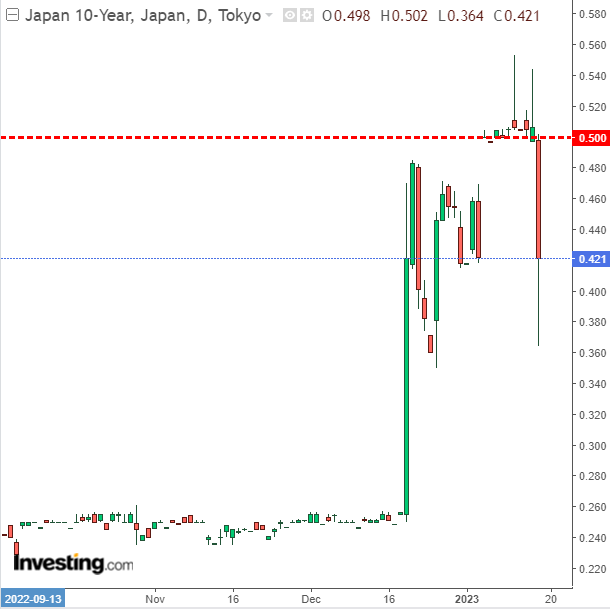
Good morning … Three things since last we left which are responsible for yesterday - and last night … I’ll begin with an uncharacteristically short-term visual of … JGBs
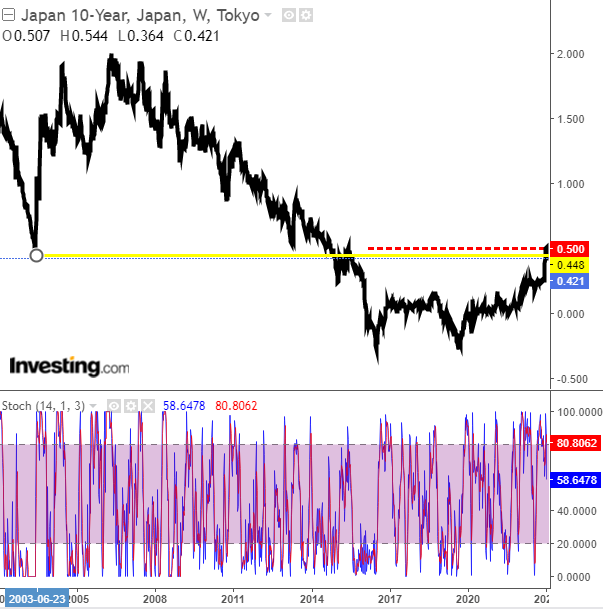
The 50bp line in the sand — area of CONTROL, if you will — stands firm. Helping GLOBAL markets here and now … in some longer-term (weekly)context,
… where momentum (stochastics, bottom panel) are actually crossing bullishly … And as GS noted,
… In terms of YCC, the BOJ added to its previous statement the bolded wording in the following sentence: “In order to encourage the formation of a yield curve that is consistent with the...guideline for market operations, the Bank will continue with large-scale JGB purchases and make nimble responses for each maturity by increasing the amount of JGB purchases and conducting fixed-rate purchase operations." This will likely be viewed as a strong message to those in the market skeptical about potential disruption to the BOJ's JGB purchases in the near term. In addition, the BOJ extended the duration of funds-supplying operations against pooled collateral (up to 10 years), as we expected, and said that yields will be set flexibly per loan duration at each operation. The supply of funds at low interest rates to financial institutions is likely intended to stimulate arbitrage with high-yielding swaps, which could help ease the yield curve distortion…
…Overall, we view the BOJ's latest decisions as revealing that it is increasingly likely to continue with its strong easing stance at least through to the end of Governor Kuroda's term (early April), for two key reasons. First, even though the BOJ has revised up its core CPI outlook during its forecast horizon to around +2% (also skewing risk further to the upside), it intends to continue with YCC while acknowledging the side-effects. Second, with PM Kishida looking to nominate the BOJ's new leadership ahead of Governor Kuroda's final MPM (March 10), we had thought the January MPM was likely to be the last opportunity to make any significant changes in YCC (the government will likely present nominees to the Diet on February 10, according to a January 17 Reuters report).
Since I cannot say things, generally speaking, better than that OR better than Jim EARLY MORNING Reid,
… The big news overnight is that there is no big news overnight as the BoJ met economists expectation that they wouldn’t change anything on YCC today despite increasing market expectation that they would. The policy does seems unsustainable if current conditions persist though as since the last meeting on December 20th, they've spent $265bn (a whopping 6% of annual GDP!) buying bonds. Indeed, as George Saravelos pointed out yesterday there are some reports suggesting the BoJ may own more than 100% of some benchmark 10yr bonds. So not only has it bought the entire stock, but it has lent it out to short-sellers who have sold it back to the BoJ. Before the meeting our Japanese economists suggested that he does expect the BoJ to abandon YCC by the end of Q2 this year, but more around forces such as the “shunto” spring wage negotiations, a positive output gap and leadership changes at the bank.
It is clear from the market reaction that although economists expected no change the market was set up for one as the Yen has slumped -2.54% against the dollar, marking its biggest one-day drop since March 2020, trading at $131.42 as I type. Given this, the Nikkei (+2.45%) is leading gains across the region. Meanwhile, yields on 10yr Government Bonds tumbled well below policy cap, declining around -10bps, to trade at 0.40% following the central bank’s decision (they did dip to 0.36% immediately after). US 10yr Treasuries are -6bps lower on the back of the news.
The BOJ did enhance its YCC by expanding its fund-supply market operations by offering funds of up to 10 years against pooled collateral to financial institutions for both fixed- and variable-rate loans. This is hoped to ease pressure on the swaps market and help market function. We will see. The press conference is to come after we go to press, so we'll see if that changes anything.
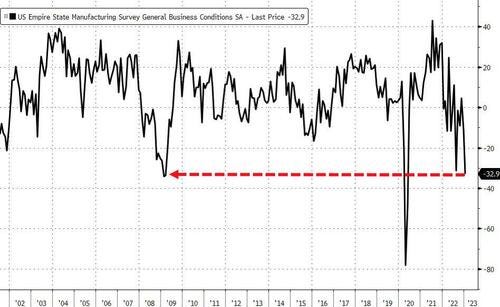
Next UP I had PLANNNED on talking about the FRBNY Empire Mfg sticksave?
Um … this was then followed yesterday by something ELSE which didn’t help, either
ZH: Stocks Tank After US Regulator Threatens To Break-Up 'Too Big To Manage' Banks
Okie dokie … here is a snapshot OF USTs as of 705a:
… HEREis what another shop says be behind the price action overnight…
… WHILE YOU SLEPT Treasuries are higher and the curve is flatter after the BOJ surprised some and maintained their YCC program while they adjusted their funding ops to help iron out the curve kinks (links above). DXY is lower (-0.26%) while front WTI futures are higher (+1.9%). Asian stocks were mostly paced higher by the NKY (+2.5% after the BOJ), EU and UK share markets are a smidge higher while ES futures are showing +0.12% here at 6:50am. Our overnight US rates flows saw some dip-buying during Asian hours before the BOJ announcement and then better selling after intermediate yields spiked as much as -7bp lower post-announcement. Then our London desk noted surprisingly light activity this morning after the Tokyo scramble with a decent share of our flows in the sectors of the curve that have benefited from the decline in Vol (20yrs, belly paper versus swaps, etc). Overnight Treasury volume was ~180% of average overall with 7yrs (232%) seeing the highest relative average turnover overnight…
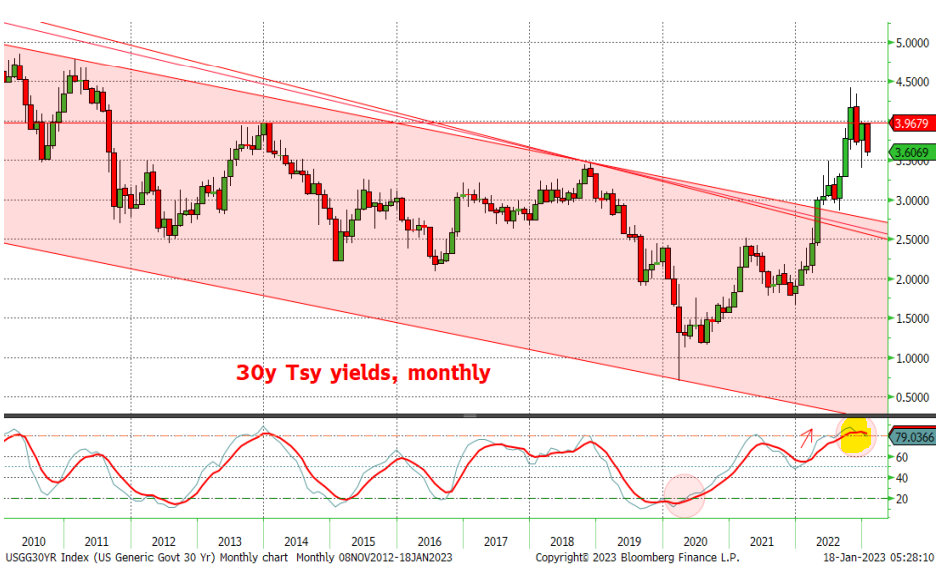
… Let's now take a look at this morning's attachments that were hand chosen to touch on the longer-term prospects for duration and curves. This morning's first attachment is an updated look at the long-term, monthly chart of UST 30yrs. What stands out here is that long-term momentum (the 14,3,3 slow stochastics, lower panel) may be book-ending the bear signal that began at the deeply overbought levels seen late spring in 2020. You can also see that the faster (%K) blue line is now below the slower (3-period average of the blue line) red line in this oscillator- a possible bull oscillator signal that could be confirmed at this month's close. Because it's a monthly chart, these two lines move at a snail's pace so here past mid-month, it's looking increasingly likely that long-term momentum will signal a reversal of the bear trend in place since the early months of the pandemic. There are, naturally, risks to this signal (if achieved) but we'll discuss those once the month-end closes are cut into granite.
… and for some MORE of the news you can use » IGMs Press Picks for today (18 JAN — and STILL SPORTING THAT NEW LOOK!!) to help weed thru the noise (some of which can be found over here at Finviz).
Since we’re all on RECESSION WATCH (?) this is where I’ll jump in to the Global Wall Street inbox — the latest from Goldilocks,
… Wage growth: Average hourly earnings growth slowed to 3.5% on a 1-month annualized basis and 4.1% on a 3-month annualized basis. Our monthly wage survey composite slowed by 0.2pp to 3.9% in December and the Indeed wage growth tracker based on offered wages in job ads remained at 6.3% year-over-year in December. Our preliminary Q4 wage tracker declined to 4.7% (qoq ar, vs. 5.0% in Q3) but remains above the 3.5% rate we estimate is consistent with 2% inflation.
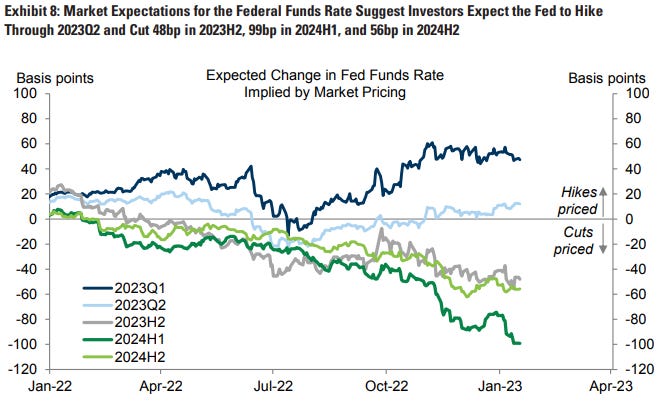
… Yield curve: The bond market is pricing hikes through 2023Q2, but 48bp of cuts in 2023H2 (vs. 42bp in mid-December), 99bp of cuts in 2024H1 (vs. 87bp), and 56bp of cuts in 2024H2 (vs. 57bp).
Which all told, dust settles, the GS recession odds are UNCH at ONLY 35%…
… Feel better? I don’t and when you consider the data yesterday along with the BoJ and layer on top of that how it appears the market was set up ahead of BoJ, well, Citi
CHARTS OF THE DAY a) Massive addition to the long side USTs ($20m - historical extremes) vs massive new addition to new short in JGBs ahead of the BPJ meeting.. but underweight Europe
… The build of long USTs vs short JGBs has been the consensus trades going into the BOJ with extreme $30m added to the long side in UST vs $17m of new shorts in JGBs (99th percentile. Meanwhile, Europe for once has been more on the side lines with deleveraging the major driver of price action.
How has global positioning changed?
In USTs short term positioning has become highly extended long (95th percentile with more the $38m of new longs recently layered in (1mths) and $54m held over a medium term horizon, but profits are small (at with longs only 7bps onside). Into the rally, CTAs have all flipped long for trigger levels remains close to current prices. Meanwhile, longer term position remains moderately short / in profits ($70m / 20bps profits).
Oh … Ok then. Guessing propensity to spend on today’s 20yr auction, then, somewhat diminished?
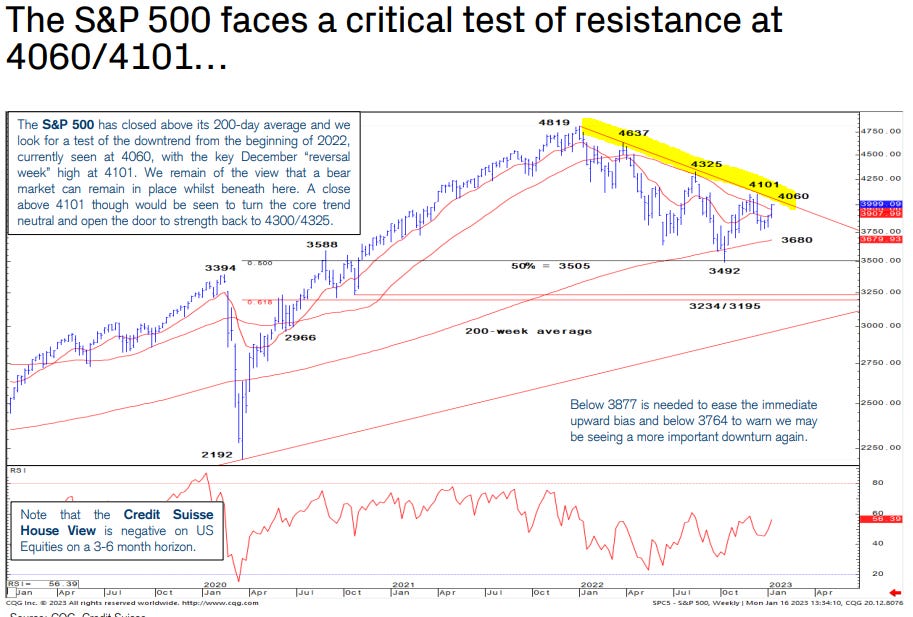
Momentum IS overBOUGHT … time at a price or a selloff (ie CONCESSION) then may be needed? HERE is (another) one for our collective inner chartist from 1stBOS
Multi Asset Macro Pack: Key Technical Themes for the next 1-3 months
… CS Global Risk Appetite has accelerated sharply higher again, reflecting the strong outperformance by cyclical equity markets and with momentum strong, we see scope this to extend further yet…
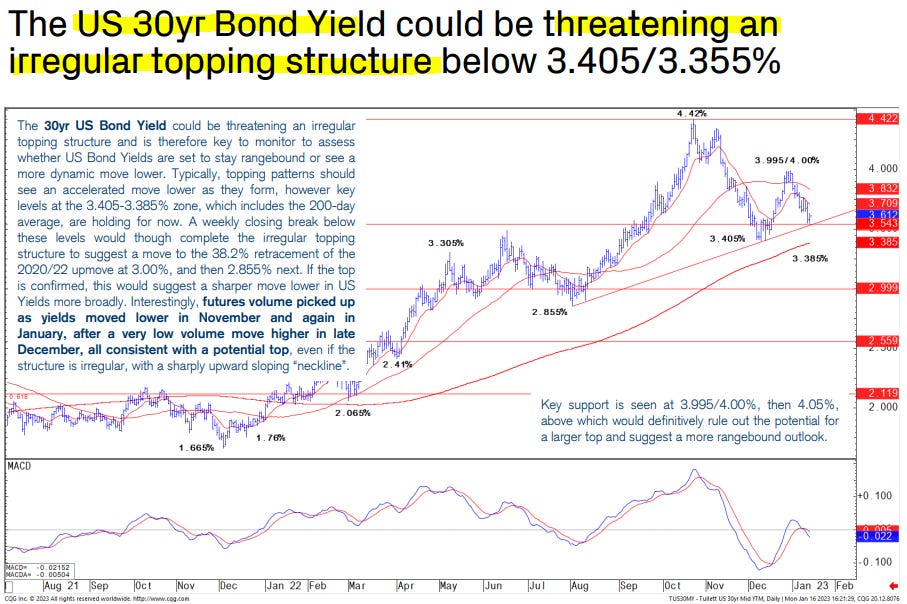
Wait, what? ‘Threatening an irregular topping structure BELOW 3.405/3.355%’? WATCHING
For more from NY (Empire no bueno) and specifically the FRBNY, Liberty St Economics department on,
… What Accounts for the Recent Trend in Discount Window Borrowing?
On March 15, 2020, at the onset of the pandemic, the Federal Reserve implemented two policy changes to make the DW primary credit program more attractive to utilize. First, the premium of the primary credit DW rate over the top end of the federal funds target range was reduced from 50 basis points to zero, ending the penalty cost of borrowing from the DW relative to market funding sources, or other alternatives such as the Federal Home Loan Banks (FHLBs). Second, the maximum term of primary credit was extended from an overnight tenor—the typical limit—to ninety days, with the option to prepay at any time. These policy changes made DW borrowing more economical and flexible, and they remain in effect today.
The notable decline in the total level of reserves in the banking system this year may have been an important factor for the rise in DW borrowing. Indeed, as the Fed has gradually shrunk its balance sheet, the cash balances of smaller institutions, particularly those with total assets less than $10 billion, have in aggregate declined sharply relative to their asset size, reducing their liquidity positions (see table below) …
… Additionally, smaller banks are generally more willing to come to the DW than their larger counterparts, as they are usually not publicly traded companies and are less subject to public scrutiny. As shown in the table below, banks smaller than $3 billion in assets on average visited the DW twice as much as other banks in 2019, just prior to the pandemic…
… Final Words The recent increase in primary credit borrowing from the DW may appear to be somewhat surprising, given the low and declining usage of the DW prior to the pandemic. We suggest that the lower rates and longer terms available under the primary credit program, combined with declining reserve balances in the banking system, have all contributed to this trend. It will be interesting to see whether this recent pattern in DW borrowing continues into the future or whether there is a return to the historical patten of DW borrowing.
Finally, from Ed Harrison of BBG fame and fortune,
The Six Big Market Questions for 2023 Markets will be confronted with six major issues in 2023: inflation and China’s reopening will dominate the macro economic backdrop. Among market dynamics, the yield curve, prospects of an equities bear market, the fate of the dollar and liquidity will be the key drivers. Expect another volatile year as a result.
… The one thing to watch in 2023 and why? Here’s my answer: the US Treasuries yield curve. In normal times, it’s upward sloping as maturities rise, with investors getting compensated for holding onto longer-maturity bonds. When it is inverted the way that it is now, it’s a sign that investors expect a downturn in growth that is severe enough to cause the central bank to cut interest rates. But the picture we’re seeing now doesn’t fit neatly into either of those boxes.
The expectations for a downturn are certainly there. The yield curve is at its most inverted since 1981. That deep inversion is a sign of extreme economic pessimism. Before a recession begins we normally see a re-steepening of the yield curve as the Federal Reserve cuts interest rates to deal with a weakening economy. However, after a brief steepening, the curve has been plumbing new depths again. The fact that we have yet to see it re-steepening despite the fact that fed fund futures show the Fed cutting rates by a half-percentage point in 2023 tells you someone is offsides. The potential for more bond (and stock) market volatility is high as a result.
And let’s not forget the recent rally in shares is sending us the opposite signal — optimism. The stock market, along with the Atlanta Fed’s GDP tracker, the jobs report and jobless claims, are all pointing to a US economy that is doing just fine. The only way to square that optimism with the yield curve is via a Fed that keeps piling pressure on the economy until it buckles so violently they are forced to cut aggressively. So, I am watching the yield curve. If it steepens strongly, that could be our early warning signal for a recession. If it normalizes gradually maybe we get off with a softish landing. Either way, these are the most polarized market signals we’ve seen in 40 years.
Ed goes on to remind,
… How is the "plumbing" of the financial markets holding up?
I am quite interested in seeing how the plumbing holds up during the US debt ceiling debates. That's because Treasuries are the haven asset in US dollars. In theory, a default - if just technical in nature - should buoy prices of that asset. People should be flocking to Treasuries for safety — just not to the particular maturities that are being defaulted upon.
In 2011, that’s certainly what we saw. After all, you have one of two scenarios — both bullish for bonds:
Government spending is slashed to avoid a crisis and default and aggregate demand drops, which helps buoy existing Treasuries
The US actually defaults and aggregate demand drops. Also bond bullish — if a bit ghoulish given the implications for the economy and people’s livelihoods
What if the plumbing is gummed up though? What if there’s not enough liquidity in the Treasury market for it to act as the safe haven? We’ve been seeing gigantic moves in Treasury yields on very tenuous data prints. That suggests something is amiss to me. The Fed has stated point blank that liquidity in the Treasury market is limited. Their take?
The market’s capacity to smoothly handle large flows has been of ongoing concern since March 2020, as discussed in this paper, as Treasury debt outstanding continues to grow. Moreover, lower-than-usual liquidity implies that a liquidity shock will have larger-than-usual effects on prices and perhaps be more likely to precipitate a negative feedback loop between security sales, volatility, and illiquidity. Close monitoring of Treasury market liquidity—and continued efforts to improve the market’s resilience—remain important.
A newly instituted standing repo facility helps as the Fed sells Treasuries under its quantitative tightening regime. Still there may be a problem to be reckoned with. A debt ceiling crisis is when liquidity issues will be most important…
Food for though t… AND … THAT is all for now. Off to the day job…