(USTs higher, curve steeper on light volumes)while WE slept; pause ≠ pivot (and those HOPES are premature); 'bonds are back' (but...); a couple more 2023 outlooks
50dMA @ psychologically important 3.999% (aka 4.00%) at the very same time momentum (slow stochastics) have RECROSSED bullishly from what looks to be more overBOUGHT (rich) than oversold (cheap)
… here is a snapshot OF USTs as of 701a:
… HEREis what another shop says be behind the price action overnight…
… WHILE YOU SLEPT Treasuries are higher and the curve generally steeper on one of the thinnest 'new news' mornings that we can remember (see above). DXY is lower (-0.4%) while front WTI futures are higher (+1.25% at 6:25am). Asian stocks were mixed, EU and UK share markets are modestly higher while ES futures are showing +0.1% here at 6:30am. This week we've gotten up too early for flow color (changing moon phase?) and overnight Treasury volume was ~80% of average with some relatively high average turnover seen in both 7yrs (110%) and 20yrs (147%).
… One interesting aspect of today's 7-year Treasury auction is that it should garner the last Fed 'add-on' bid for a coupon auction until early next year. And while any impact, if there is any, might be felt in the funding markets for upcoming current issues... it's perhaps worth underscoring that the Fed's balance sheet will be in full run-off mode for the coming few months. Here's Wrightson this morning on the topic:
"The Desk should buy $3.8 billion of the 7-year. This should be the Fed’s last tender in a coupon auction until the February refunding, as the Desk will be in full run-off mode in the coupon sector in each of the next two months."
On this, a new BIS paper discusses the QT-reserves nexus where: "central banks will need to determine the scope for a smooth reduction in reserves." In the paper the authors use evidence from the wholesale payment system to try to come up with an answer to that key question, via monitoring "the value placed by commercial banks on their reserves" BIS
… The price action in front WTI futures (CL1) looked 1y1y-like yesterday, with a 3-session lag. Yesterday morning CL1 slashed through its prior move low (~$76.50) from late September before snapping back above it to close near the day's high print. Our next attachment of the daily chart of CL1 shows that snap-back and how it traced out a well-defined, Hammer Bottom trend exhaustion signal. Longer-term momentum studies (not shown) still guide bearishly for CL1, over time, but yesterday's price action hinted of a short-term, bearish positioning imbalance that may need to be worked out like 1y1y has done in recent days.
… and for some MORE of the news you can use » IGMs Press Picks for today (22 NOV) to help weed thru the noise (some of which can be found over here at Finviz).
Moving right along in TO and through this holiday shortened week, a few things from the Global Wall Street narrative creation machine as well as random links from the intertubes …
First up from a rather large British operation,
Global Macro Thoughts: Living with shock and awe This week’s GMT is a summary of our just-released Global Quarterly Outlook. We expect the third weakest year for global growth since 1982, after 2008 and 2020. For the quarter, we are overweight bonds over stocks, and also like cash in the US as a low-risk alternative with reasonable yield.
They reiterate their preferred asset allocation (cash and long duration > equities) and remains very important ‘food for thought’ as you prepare for a holiday break to enjoy a large meal with some family and enjoying the football games…
Preferring bonds is all well and good BUT
AAM Viewpoints - Bonds Are Back, but Keep Some Powder Dry With the year winding down, fixed income markets are likely ready to forget what a historically bad year it has been by just about any measure. There is certainly no lack of pontification on just how bad, with many market observers harkening back 200 years or more to declare it the worst bond market in history.
…The adage “Don’t Fight the Fed” comes to mind and, in this case, it might be prudent to take the Federal Reserve at their word, which would dictate some continued caution on longer durations. While an appetite for longer duration out past the context of short-to-intermediate may be on the horizon in 2023, for the time being, we would keep some powder dry and wait for more clarity on the timing of any potential pause or pivot to rate cuts.
In as far as 2023 — the year ahead — HERE’s latest from NWM …
US Economics: We forecast a recession in the US, with GDP declining by 0.4% y/y in 2023. We suspect we should see a relatively mild downturn in the current setting (peak-to-trough -1.0%) followed by a comparatively modest recovery (we expect below-trend growth of roughly 1% later in the year).
US Strategy: With the US expected to enter a recession starting in 1Q23 and lasting through 2Q23, and with our expected terminal fed funds rate of 5% well-priced, we look for yields to peak if they have not already – we see 10yr yields ending 2022 at 3.9% and 2023 at 3.35%.
Seeking Alpha: This Super-Bear On Bonds Just Turned Bullish
Summary
The current trends of high inflation, some economic growth, and a hawkish Fed may be set to reverse in 2023.
Falling inflation and a recessionary economy could encourage lower interest rates and rising bond prices soon.
The Treasury yield-curve inversion of November seems to be forecasting this transition is well underway.
Moving from my Strong Sell rating for U.S. bonds during 2021 and most of 2022, to a Neutral stance in late October, I am now arguing the bullish Buy case for 2023.
… Inverted Yield Curve Bullish for Long Bonds
November has reached for the steepest yield curve inversion since 1982, according to several brokerage notes last week. Anecdotally, trading and investing since 1986, this is the greatest inversion event I can remember. The horrible news for the economy is banking and financial system liquidity appears destined to contract sharply into early 2023. I am modeling the potential for a 5% or greater jump in the number of unemployed Americans next year, as company profits may plunge in the first half of 2023 vs. 2022. If I am correct, nearly 1 in 20 workers could soon lose their jobs.
Statistically, today's positive spread between 3-month Treasury bills and 30-year bonds is the widest since 2007, just before sliding into the Great Recession real estate bust and banking crisis. Over the last 40 years, this instance plus similar spreads in 2001 and 1982 were clear harbingers of approaching recession.
Below is a graph of 30-year yields back to 1982 measured against recessions (shaded in grey), and the 3-month to 30-year structure of government interest/borrowing rates. You will notice the raw increase in 30-year rates since 2020 is the scariest jump in 40 years. There is no doubt in my mind this rise (with a 6 to 12-month lag) will create serious calamity in the economy next year. The debate currently raging between experienced commentators and analysts is whether a mild (1990-91, 2001-02) or severe (1982, 2007-09) recession is next.
Moving along from yield curves TO another most important question … being asked and observed by those down in the bowels of 33 LIBERTY STREET, NYC
… Takeaways Since the 1990s, the response of deposits to monetary policy has been attenuated. This can be explained by the growth in deposits over the post-crisis period relative to investment opportunities. Understanding deposit pricing dynamics requires thinking about the quantities of various funding sources and the presence (or lack thereof) of competing products. Taken together, current deposit betas are lower and slower given banks significant supply of deposit funding. However, going forward the rapid increase in the fed funds rate suggests that the deposit gap will be higher than recent rate cycles, causing depositors to look elsewhere and deposit rates to rise in response.
Speaking of those in semi OFFICIAL seats offering semi official observations,
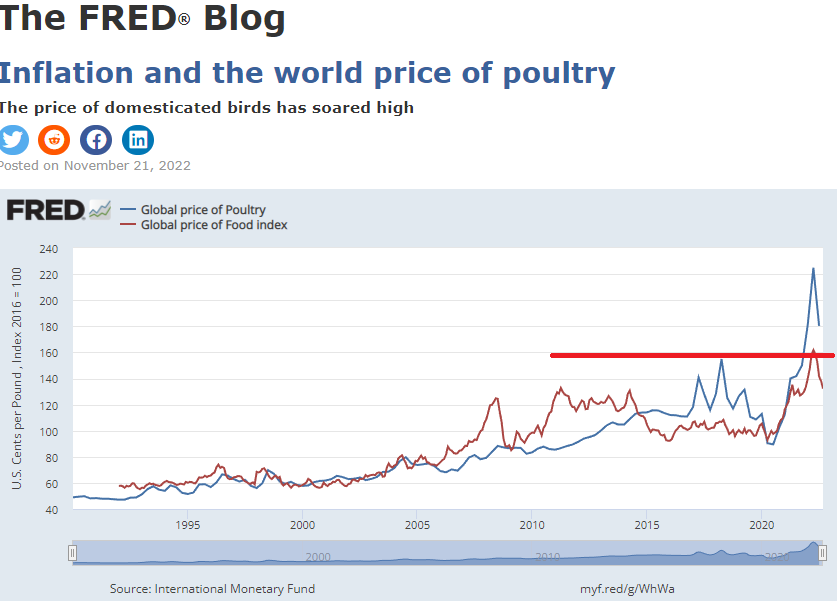
Serving poultry at the global Thanksgiving dinner table is 20% more expensive than a year ago. Global food prices in general peaked in the middle of 2022. They’re coming down now, but they’re still 3% higher than they were a year ago.
The FRED graph above shows data on the global price of poultry (blue line) and food in general (red line). Notice that the source of the data, the International Monetary Fund, serves up each data series in a different unit: U.S. cents per pound of poultry and an index with a value of 100 in 2016 for the price of food overall.
Because poultry prices are nested in the broad category of food prices, it should come as little surprise that both price series took flight at the same time in the late part of 2020. However, the global prices of other types of food, such as shrimp, are now lower than a year ago and are contributing to the decline of the composite food price index.
That composition effect is at play at the Thanksgiving dinner table for an average urban consumer in the U.S. According to the Bureau of Labor Statistics, those serving poultry alongside meats, fish, and eggs are paying 8% more than last year.
Lastly, if you care for tofurkey, notice that although the global price of soybeans has risen alongside the price of poultry, a soybean-based dinner with the same amount of calories provided by turkey is 41% cheaper.
TURKEY (ie poultry) is going to simply magnify the HIGH (and now NOT RISING, thankfully) cost of providing dinner Thursday …
AND on THAT note, sticking to the theme of the week,
And they say common sense ain’t that common … THAT is all for now. Off to the day job…