(USTs bull flattening on heels of BoJ, China PMI disappoints; STRONG volumes)while WE slept; Prof. Siegel: There’s No Question the Economy is Strong (BUT... money supply...)
… This was in advance OF last nights much anticipated BoJ meeting where this mornings first link on IGMs Press Picks…
Nikkei- BOJ drops explicit 1% ceiling for 10-year JGB yields
… which produced a market h’line
ZH: Yen & UST Yields Tumble After BoJ's Mixed Messages, But...
… The most important changes of these is the BOJ's description of the 1% rate as "a reference", which sounds similar to the July 28 BoJ meeting, when Governor Kazuo Ueda made his first surprise move by maintaining the 10y yield target at 0% but said its 0.5% ceiling was a reference point and not a rigid limit. Back then, the BoJ offered to buy bonds at 1% and the JGB 10y yield was up 0.15% over the following week.
Likely, the BoJ would allow 10y bond yields to creep higher with potential rinban operations risk if the 10y bond yields advance higher much too quickly.
Additionally, the BOJ has also decided to abandon its daily fixed-rate bond-buying operations, its major tool for impacting rates, citing the “large side effects” it might entail. The BoJ also raised its economic growth but more importantly, its inflation forecasts...
… AND alongside the BoJ news, Harkster notes …
China's PMIs missed expectations in October, manufacturing slipping back into contraction territory (49.5 vs Sept 50.2). AUD, CNH, HSI, CSI ... all in decline following the disappointing data set
… And Nordea update on EZ ‘flation
Nordea- Euro-area flash inflation: Lower headline, high core
… and perhaps yesterday’s market moves were because of some ‘good news’ from Dept of Treasury …
Reuters - US Treasury cuts Oct-Dec borrowing estimate to $776 bln, yields ease
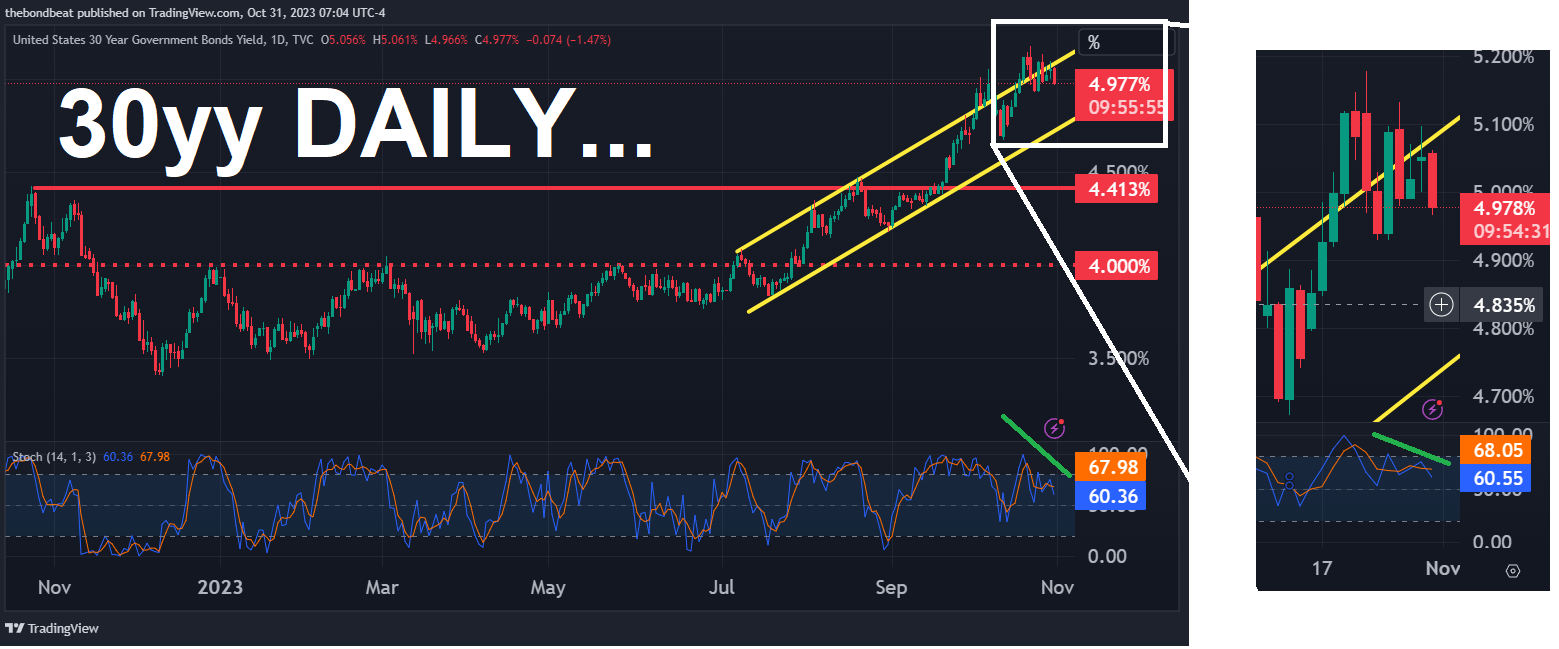
AND … here is a snapshot OF USTs as of 705a:
… HEREis what this shop says be behind the price action overnight…
… WHILE YOU SLEPT Treasuries have bull flattened overnight after the BOJ loosened its grip on JGB 10yrs, China's PMI data disappointed (links above) while EU inflation and growth readings also came shy of the consensus. DXY is lower (-0.15%) while front WTI futures are higher (+1%). Asian stocks were mixed (China markets lower, most others higher), EU and UK share markets are all in the green (SX5E +1%) while ES futures are showing +0.25% here at 6:50am. Our overnight US rates flows saw some possibly early, month-end-related flattening interest (largely 5s30s and 7s30s but also 3s5s) from real$ alongside some light interest in P's. As of 5mins ago, our flows have been essentially one-way (into flatteners) ahead of the +0.07yr Treasury extension. Overnight Treasury volume picked-up nicely to ~125% of average overall with 30yrs (195%) seeing some stand-out turnover, matching our desk activity.
… Treasury 5yr yields which sit this morning atop their aggressively drawn, multi-month bear trendline. We'd normally construct a trendline capturing all the intraday move lows in rates but we chose this one because it simply looks like the trend that 5yr yields have been on. The 5.00% level (approached Oct 19th) looks like your support while resistance may sit near spot levels (bear trend, as drawn) then 4.539% (October's low yield prints) and 4.495% after that.
… and for some MORE of the news you can use » The Morning Hark - 31 Oct 2023 and IGMs Press Picks (who CONTINUES to be sportin’ that new, fresh look) in effort to to help weed thru the noise (some of which can be found over here at Finviz).
Moving from some of the news to some of THE VIEWS you might be able to use… here’s SOME of what Global Wall St is sayin’ (in a similar sorta way you’ll find content if you pay for ZH PREMIUM …
Barclays - China: October PMIs signal weaker momentum
Disappointing manufacturing PMI and slowing services and construction PMIs underscore a deceleration of growth momentum and poor sentiment entering Q4. We maintain 2.8% q/q saar forecast for Q4 GDP despite year-end fiscal stimulus. We look for another 50bp in policy rate cuts and 75bp of RRR cuts by mid-2024.
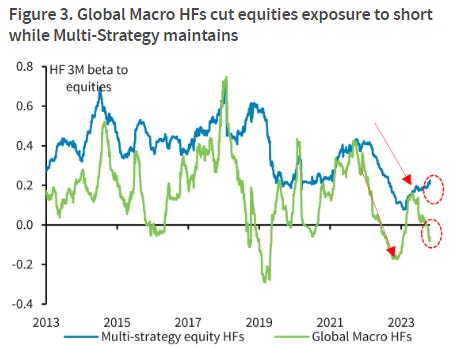
Barclays - Long & Short of It: Longs in Short Supply - Plenty of Suspense, but Not Too Scary
Equity MFs de-risk, and global macro HFs are now short equities. CTAs also increased equity shorts, though vol control and risk parity exposure remain above average. Still, lackluster volatility through the selloff seems to rule out investor panic. Rising rates continue to support flows into gov bond funds and USD futures.
… Recent retail flows favor bonds over all else as yields continue to climb. US equity MFs saw outflows for a third consecutive month; lackluster forward guidance and a low equity risk premium weakens the case for holding US equities from an asset allocation perspective, particularly as yields on cash remain historically high. Overall retail flows were skewed toward Gov't bond funds, with money flowing out of most risk assets, including global equities and US credit (both IG and HY). Surprisingly, US money market funds saw $84bn outflows over the last 2 weeks, but they still remain the clear winner in terms of inflows this year, having received well north of $1 trillion in new money on a YTD basis.
… Global Macro HFs have become short equities
BNP - US equities: Correction but not capitulation
Correction but not capitulation: The US equity market has seen a significant move lower, entering correction territory with a -10% high-to-low move. Although a large correction, it has not manifested as a capitulation, in terms of either earnings expectations or flows and positioning. Earnings downgrades have started through the Q3 2023 earnings season, but bottom-up consensus forecasts are still for double-digit EPS growth in 2024.
Positioning data shows a retracement, but only back towards more ‘normal’ levels. US equity ETF inflows spiked in June-July and have since faded, but are still showing net inflows on a rolling 1m or 3m window. CFTC data still points to above-average net buyside SPX futures positioning. Net longs in SPX are mainly concentrated in asset managers. The HF picture is one of de-grossing, with both long and short holdings low. Systematic flows are also mixed: CTAs are -1.5 s.d. short, but volatility target funds have shown only very modest signs of starting to de-risk. The AAII Bull-Bear indicator has pulled back from exuberance through summer and is near long-term average levels, but notably still well above peak bearishness seen at the market lows in Q3 last year.
Fading the rally: SPX <30 on an RSI appeared oversold, but has also broken down through key support levels. In our view, the market entering an earnings downgrade cycle with rates at highs leaves only limited room for a modest equity relief rally. We suggest considering fading rallies…
BNP - Global economic impact of AI: The future is coming faster (3rd bullet caught my eye … so when everyone’s put out of work we can have this to remember … we’ve got THAT going for us … which is nice …)
Adoption can be relatively fast. Generative AI is likely to transform economies faster than previous episodes of significant technological change. We could see mass adoption among corporates in the coming two to five years. We estimate a 1% productivity gain already by the end of the decade.
Readiness varies across countries. Advanced countries look better positioned than emerging countries to harness the benefits of AI, according to our country ranking of AI readiness.
Impact is likely disinflationary. The disinflationary impact of AI could be around 1% a year, especially on services prices, helping to offset other potential long-term inflationary forces.
The S&P 500 closed at 4,117 on Friday, more than 10% below its recent peak in late July. Some are saying it’s a brand-new bear market for stocks. In this view there was a bear market in 2022, a bull market from October 2022 through July this year, and a new bear market that started in August.
We don’t think this is the appropriate way to look at things. This is not a new bear market. Instead, it’s the same bear market. We had a bear market in 2022, a temporary rally, and then the bear market reasserted itself…
…Clearly, we are not “permabulls” and never have been. From 2009, all the way through 2021 we remained bullish. We didn’t run with the herd of other forecasters worried that the world had come to an end in 2008. And, while we are bearish today, we don’t think it’s the end of the world now.
Eventually, stock prices will reflect fair value. More importantly, we expect the political pendulum to swing back toward the center. Big government directed economies eventually suffer…then recover when policy shifts back.
Goldilocks - 2024 Inflation Outlook: Approaching the Target (Fed’s WINNING, if we believe … )
■ Core PCE inflation fell substantially in 2023, from the 5-5½% range in 2022 to 3.7% year-on-year in September 2023. Trimmed sequential measures have also slowed, and our Core Inflation Tracker is already consistent with a 2.5-3.0% underlying pace. Looking ahead, we expect 2024 core inflation to reflect the interplay between two forces: 1) disinflation from the advanced stage of rebalancing in the labor, housing rental, and car markets, and 2) an inflationary boost from pent-up cost pressures, primarily in healthcare. We expect these crosscurrents to net out decisively to the downside, lowering core inflation during 2024 by 1pp to 2.4% at year-end.
■The strongest reason to expect a further decline in inflation in 2024 is also the most durable: the progress already achieved on labor market rebalancing. The jobs-workers gap has fallen from 6mn to roughly 2½mn, approaching the 2mn level we have assumed would be consistent with sustainable wage growth. Wage growth has already fallen more than 1.5pp to 4.2% annualized, and leading indicators suggest additional declines ahead: wage growth for Indeed.com job postings halved over the last year…
■ … We are lowering our December 2024 core CPI forecast by two tenths to 2.7% year-on-year, and we continue to expect a significant decline in core PCE inflation from 3.7% currently to 2.4% in December 2024. We expect the backdrop of falling but above-target inflation to validate the Fed’s decision to hold the fed funds rate at its current level until 2024Q4.
Goldilocks - Upgrading Our Longer-Run Global Growth Forecasts to Reflect the Impact of Generative AI (hmmm … interesting and you’ve likely seen note or a version OF it by now but …)
■ Earlier this year, we estimated that the efficiency gains promised by generative artificial intelligence (AI) could provide a significant boost to global labor productivity. While considerable uncertainty remains about the timing and magnitude of AI’s effects, our baseline expectation is that generative AI will affect productivity within our ten-year forecast horizon. We are therefore upgrading our global GDP forecasts from 2027 onwards to incorporate the impact of generative AI…
■ … the enormous economic potential of generative AI suggests growth upside even after taking these offsets into account. In the coming weeks, we will therefore raise our growth forecasts in the second half of our ten-year forecast horizon as part of our 2024 outlooks, including by 0.4pp in the US, by 0.2-0.4pp in other DMs, and 0.1-0.2pp in advanced EMs by 2034.
After Accounting for Offsets, We Expect a Moderate Boost to GDP Growth in the US and Other DMs and a Smaller Boost to Advanced EMs in the Second Half of Our Forecast Horizon
Jeff- Treasury Borrowing Estimates: A Modest Reduction in Financing Needs... No Change to Refunding Expectations
… The downward revisions to borrowing projections come primarily because tax receipts have been coming in strong. The IRS granted an automatic extension to California taxpayers to mid-October from mid-April (subsequently pushed back again to mid-November), and now Treasury's cash balances are swelling as a consequence…
… So, what are we to make of these projections? Honestly, there isn't much here to sink our teeth into. The borrowing projections are a bit more modest than last quarter, but otherwise there isn't enough detail in the data to move us off of our expectations for the Refunding.
UBS - BoJ tweaked YCC marginally, but maintained policy rates
… Outlook report surprised to the upside As widely expected, the board members revised up their CPI projections. However, extent of the upward revisions was significantly larger, especially in FY24 (Figure 2). Core CPI inflation projection (median) was revised up 30bp, 90bp, and 10bp, in FY23, FY24, and FY25, instead of our expectation of 50bp, 10bp, and 10bp. But, more eye-catching was an upward revision in core-core CPI, which excludes energy. The media projection looks for 1.9% in both FY24 and FY25. The lower than 2.0% was what we had expected, but upward revision in FY25 should suggest that their judgement on underlying inflation has risen, in our view. Despite the upward revisions, the BoJ decided not to raise policy rates
… The Bank of Japan made an infinitesimal change to its policy of controlling long term yields—the 10-year bond does not have a yield ceiling of 1% any more—it is now “about” 1%. Markets appear to be less than excited about a six-letter word. It does, perhaps, signal a slow move towards a policy change.
WisdomTree- Prof. Siegel: There’s No Question the Economy is Strong
… One cautionary indicator: money supply data shows signs of weakness again and the data decreased back towards April levels. We had three consecutive monthly increases from April, but the declines the last two months are not encouraging. Even before these two monthly declines, money supply was not growing enough in my opinion to support 2-3% real growth plus 2-3% inflation, which would be a 5% rate. Of course, there’s a big lag between money supply growth and the impact on the real economy. But this recent weakness is something the Fed should pay attention to …
… And from Global Wall Street inbox TO the WWW,
Bloomberg- Higher Neutral-Rate Expectations Show Why Treasuries Hugging 5% (maybe its just this simple….)
By Ven Ram, Bloomberg markets live reporter and strategist
What happens when ever-widening deficits, resilient demand in the economy and expectations that interest rates will continue to stay aloft collide with one another?
Higher Treasury yields on longer-dated maturities, that’s what.
While this week is punctuated by several central bank meetings, the US Treasury Department will also lay out its plans for new bond sales.
That road map matters more against a backdrop where the fiscal deficit doubled in the year through September to just above $2 trillion. The economy has taken it all in its stride, with growth in the third quarter coming in at almost 5%, well more than twice the pace seen in the second.
Meanwhile, inflation expectations for the next 12 months have now accelerated past 4%.
That’s a pretty heady mix, so it isn’t surprising that readers in the latest MLIV Pulse survey reckon that the US neutral rate - a sort of nirvana where the economy is at full employment without stoking inflation - has doubled to at least 100 basis points from pre-pandemic levels. Which is why 10-year Treasury yields haven’t really pulled back from 5% despite all the tensions in the Middle East. So much so that the median of MLIV readers is for the 10-year yield to settle around 5% by the end of this year.
While that seems entirely plausible, there may be upside risk lurking to yields even beyond, should the Federal Reserve be compelled to tighten policy further to get inflation back to target. While we were in a period of disinflation through the first half of the year, that hasn’t quite been the case in the second. Problem is, the Fed doesn’t quite have any other tool apart from interest rates to get that down.
Given how restrictive its policy rate is, the central bank may well decide to wait and watch for a while more, but those stellar growth numbers from the third quarter may just make policymakers less wary of doing more eventually.
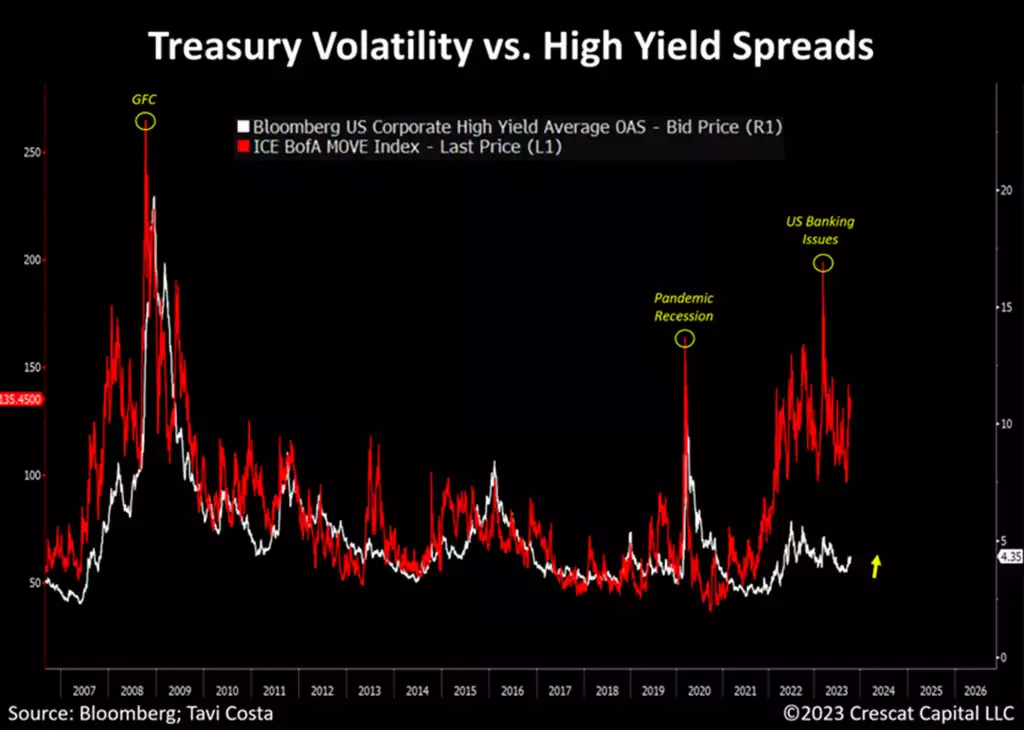
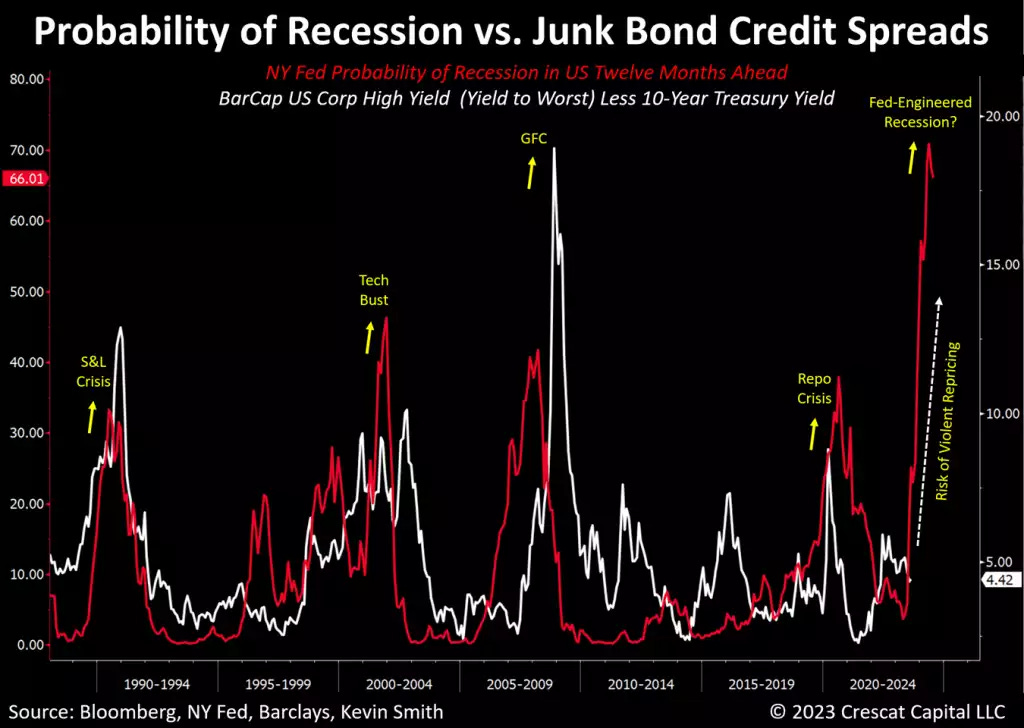
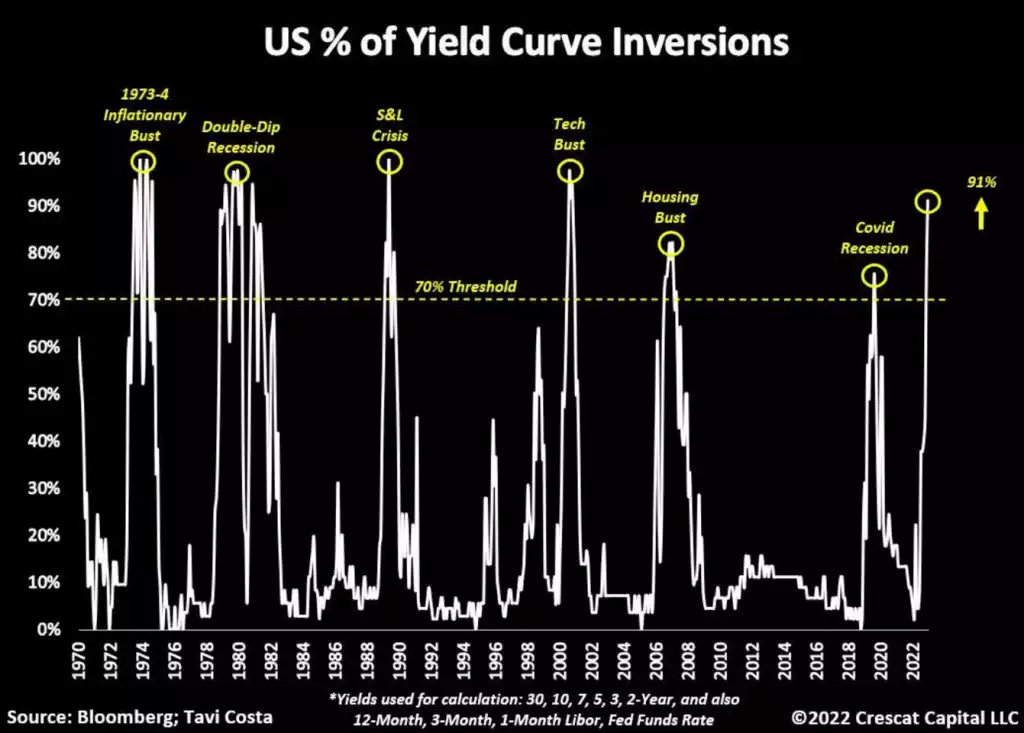
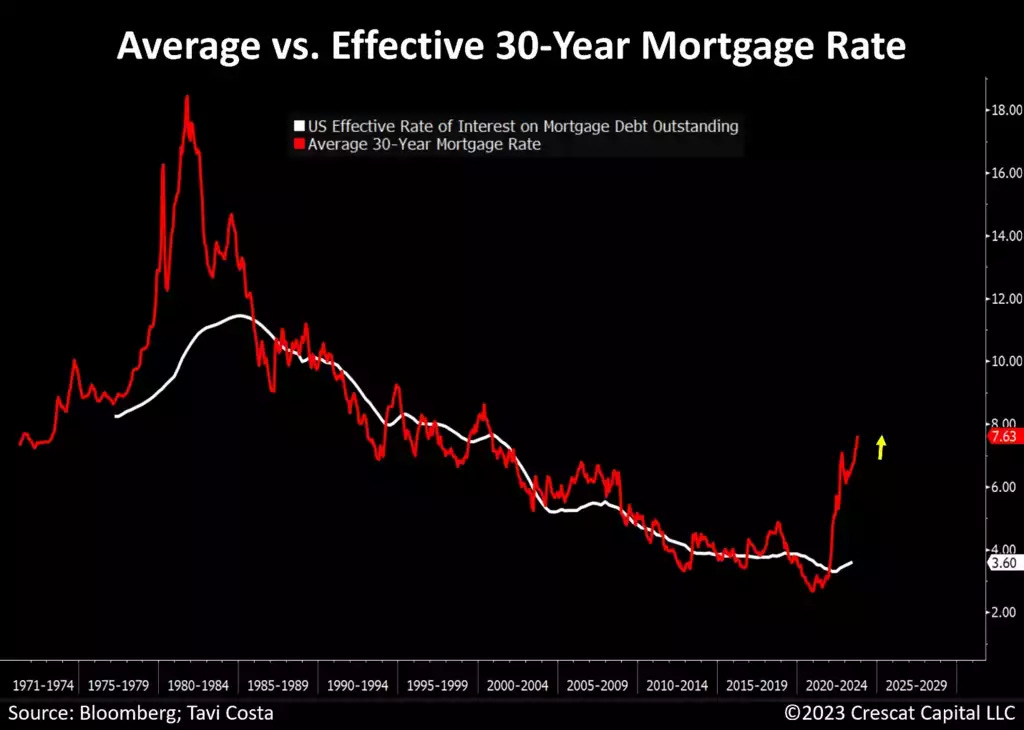
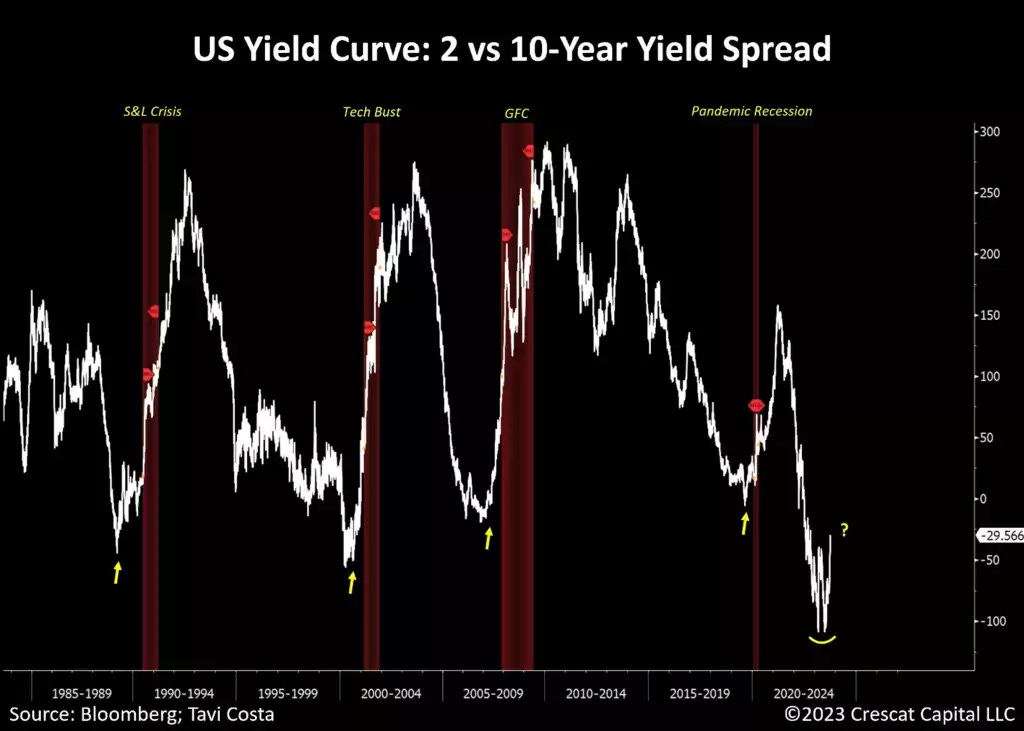
Crescat Capital- Something More Has to Give (famous visual content and FinTwitter and I’ll focus on one section on RATES)
… Downside Risk in Junk Bonds
On the fixed income side, we anticipate an impending volatility event as forecasted by the divergence in the BofA MOVE Index of Treasury volatility compared to high-yield credit spreads as shown in the chart below.
The NY Fed’s own Probability of Recession Twelve Months Ahead model is forecasting a historically high probability of an economic contraction. As shown in the chart below, this indicator normally signals an impending violent downward repricing in the junk bond market which we believe could be directly ahead.
Also, as shown in the chart below, our own more comprehensive yield curve inversion model than the NY Fed’s warns of an impending high-probability S&P 500 downturn and recession.
… The Lag Effect
The chart below serves as a compelling illustration that we have not yet experienced the full impact of tighter financial conditions filtering through the economic system. Despite the recent increase in mortgage rates, effective interest rates for most individuals remain at historically low levels.
Corporations are in a similar decent position for now but on the verge of a substantial surge in interest cost as they face a significant wave of debt refinancing in the next 12 to 24 months. Sovereign institutions are also facing a comparable scenario. The US Government, in particular, will need to refinance nearly 50% of its total debt in the next three years at likely substantially higher interest rates.
… Yield Curve Inversion
The recent steepening of the yield curve also suggests that unemployment rates are likely to start rising significantly in the next couple of months.
Although the chart below does go back to that period, the current development in the yield curve has unfolded remarkably similar to the 1973-4 during the stagflationary crisis. Back then, we had a deeply inverted curve, across multiple duration spreads, that then subsequently had an un-inverted period despite the Fed being forced to raise rates due to inflationary pressures.
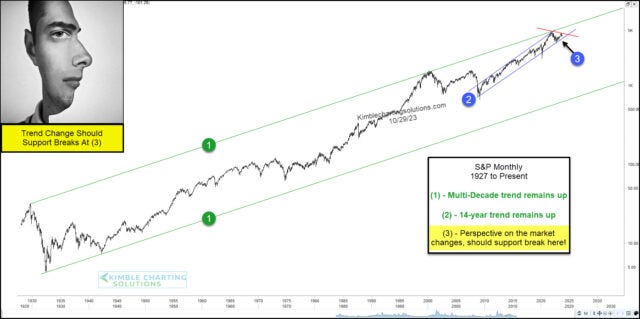
Kimble - S&P 500 Index Nears Important Long-Term Trend Support! (for those of us who are visual learners…)
The Value Line Geometric Index has rolled over and last week the index pulled back to support near 500. This is the level from which the breakout occurred in 2020 and where the selling stopped in 2022. If bulls want to make a stand, this is certainly a logical place to do so.
WolfST- Marketable US Treasury Debt to Explode by $2.85 Trillion in the 10 Months from End of Debt Ceiling to March 31, 2024
… Both quarterly net borrowing amounts for Q4 and Q1 assume a quarter-end balance of $750 billion in the government’s checking account, the Treasury General Account at the Federal Reserve Bank of New York. So according to the Quarterly Refunding announcement today:
Q4 2023 net borrowing: $776 billion, lower than its July 31 projection for Q4 of $852 billion, “largely due to projections of higher receipts somewhat offset by higher outlays.”
Q1 2024 net borrowing: $816 billion.
In total, over those two quarters marketable debt will have increased by $1.59 trillion! This follows the $1.01 billion increase in Q3, and the surge in June after the debt ceiling ended…
… In terms of today, current marketable debt as of Oct 27 reached $26.56 trillion (red line). By March 31, five months from now, it will be $27.6 trillion, as per the Quarterly Refunding data today.
Roughly $600 billion of the $1 trillion in new debt in Q3 was used to refill the checking account, the TGA, which had been drawn down to near-zero during the debt ceiling fight as the government continued funding its unmitigated deficit spending. The TGA ended Q3 with a cash balance of $657 billion.
As of October 27, the TGA balance was $828 billion.
The total amount of Treasury securities outstanding has reached $33.68 trillion. Of that amount, $26.56 trillion are held by the public, and $7.12 trillion are securities held by government entities, such as government pension funds, the Social Security Trust Fund, etc…
… So US investors, pension funds, insurance companies, bond funds, etc., need to be persuaded to step up to the table and buy those securities. And to pull ever more buyers to the table, yields have risen, and the tsunami of new issuance indicates that even more buyers, reluctant buyers, will have to be pulled in with even higher longer-term yields to come.
A happy halloween to you and yours — real or otherwise,


Creative Pumpkin carving !!! hope it isn't the S&P 500 ??? Nice if it was the CPI.....
Fantastic work !!!!
I learn SO MUCH by reading your articles....should be required reading for every American.
Can't disagree with your Outlook....
Outstanding work !!!!
I have little to no faith in QE trend lines....unless/until CBs go Money Printer Go Brrrrr again!