Good morning … Welp, they LIKED 10yy as much as they disliked 3yy,
ZH: Record Demand For Blockbuster 10Y Auction Sends Yields Tumbling
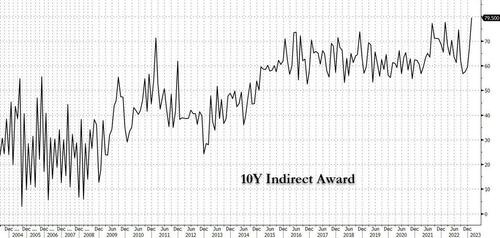
… While the bid to cover was also a big improvement, coming in at 2.66, up from 2.53 in January and the highest since Feb 22, it was the internals there were truly off the charts: after a series of already elevated Indirect awards in the past years, January's Inidrect takedown soared from 67.0% to 79.5%, which was the highest on record!
The question then IS … will they like / want BONDS …
An interesting setup where my lines are more CRAYON than hard-and-fast technically correct BUT you’ll get the jist … 30yy are triangulating with (daily)momentum oversold (stochastics, bottom panel) … perhaps they’ll respect this narrowing range ? Tune in later today at 1p (and some sorta recap tomorrow as the week comes to a close … 0
For NOW, though … here is a snapshot OF USTs as of 705a:
… HEREis what another shop says be behind the price action overnight…
… WHILE YOU SLEPT Treasuries are modestly higher this morning ahead of claims, the bond auction and next Tuesday's CPI. It was another tough morning to find rates-related news (see above) where DXY is lower (-0.45%) while front WTI futures are little changed. Asian stocks were were mostly higher (China-linked exchanges especially), EU and UK share markets are all in the green (SX5E +1.35%) while ES futures are showing +0.75% here at 7am. Our overnight US rates flows saw a soft opening in Asian hours on weakness in Aussie bonds (Aussie 10's +5.5bp) with prices going into the London crossover near the Asian lows before a decent bid emerged in intermediates/TYs after yesterday's smashing 10yr auction. Our flow saw fast$ selling into the uptick while Asian real$ continued to buy across the curve- though in more sociable sizes this morning. Overnight Treasury volume was below average across the curve and around 75% of average overall.
… Our first two attachments this morning look at the daily charts of some close, front-end duration cousins: SOFRZ3 futures and Treasury 2yrs notes, respectively. The first attachment shows how SFRZ3 futures recently broke a bull trend off their early November move low with prices quickly racing down toward a cluster of late October/early November daily closing/opening price lows in the vicinity of 95.15, as illustrated. There should be good support ~there and the doji's (closes and openings very similar or the same) of the past few sessions indicate market 'indecision' over whether to test that 95.15 area ahead of CPI, or not. Predictably, Treasury 2yrs look very similar as they've so far respected support derived by January's twin daily rate highs near 4.49%. The idea here is that a daily close above that 4.49% range high would unleash stored bearish energy in 2's and offer a clear-er path up to November's move high in yields at ~4.80% or beyond.
… and for some MORE of the news you can use » IGMs Press Picks for today (9 FEB— and STILL SPORTING THAT NEW LOOK!!) to help weed thru the noise (some of which can be found over here at Finviz).
From some of the news to some VIEWS you might be able to use. Global Wall St SAYS:
Another company—Disney this time—has announced headcount reductions. We get US initial jobless claims data today, and the macroeconomic data does not match the high profile press releases of job losses. A major reason is that large companies are not that important economically—smaller businesses matter most to labor markets. Smaller businesses tend to have underemployment rather than unemployment. It is quite hard to fire 10% of a three-person company.
The announcements of job losses may still have an economic impact. Post-pandemic labor market churn has been significant—it is one reason for elevated job vacancy data. Churn pushes up wages and pushes down productivity. If people feel less secure about the labor market, falling churn could depress labor costs even more…
Said another way,
Moving from employment and layoffs TO what may / may NOT ‘ail the US yield curve’. Why? Because. Goldilocks,
■ It has been over four decades since markets last witnessed the current degree of US yield curve inversion. In today’s Global Markets Daily, we explore various rationales for this extreme curve inversion, and how deep inversion can coincide with falling recession odds. ■ Our modified curve model suggests that the 2s5s portion of the yield curve is responsible for much of the deviation in observed curve behavior from history. In our view, the most compelling reason for the discrepancy is the presence of a strong prior among investors about r* being low and similar to estimates from the last cycle, despite the very different nature of the current cycle. ■ We think that the extent of inversion, particularly in the real curve, is unlikely to persist. Our expectation is that this moderation will be achieved in part by an upward reassessment of long run real rates.
… We believe this cycle is different, with an economy that can support a higher long run real rate than currently assumed. The next few months should offer clues on which of these views is correct. If the low r* view is correct, the Fed’s policy stance would indeed be substantively restrictive, and we will likely have a decidedly worse growth outcome than we currently anticipate. If, on the other hand, our economists’ baseline for a still robust economy comes to pass, it will be hard to argue that the Fed has been severely restrictive, and investors will likely update their long run rate priors, thereby moderating inversion to more ‘typical’ levels.
Finally, as markets evolve and price dictates / validates, so too do those tasked with creating OF narratives and so … a rather large German institution offering an update,
After an eventful week we mark our US rates views to market. Rates have recently moved towards our end-Q1 forecast, and an upside inflation surprise next week could push the 10y yield close to our 4% projection. Further ahead, we still see recession in H2 as the most likely outcome and are biased towards lower front-end rates and a steeper curve, but are awaiting clearer evidence of labor market loosening to recommend related trades. Market pricing has been gradually coming around to the view that front-end breakevens fell too low given the inflation outlook, leading to higher front-end breakevens and a flatter breakeven curve. The resilience in activity and labor market data following 4.5ppt of Fed rate hikes suggests r-star could be higher than commonly thought, with important implications for longer-term yields.
… In short, we think the 2ppt drop in estimates of r* following the GFC rests on shaky ground. Mechanically the drop is a product of the sluggish post-GFC recovery with short-term rates at the ZLB. But a big part of that was household deleveraging and elevated risk aversion coming out of the GFC, which we don’t see as enduring features of the economy going forward.
This issue isn’t yet in much focus, but if growth and the labor market remain resilient, it will be. Over time, we could begin to hear from the Committee on it, and start to see more SEP longer-run dots move higher; we’ve already seen a few marked up since June.
This would have big implications for longer-run rates. It would raise yields across the curve via the impact on expected short-term rates and by boosting term premium, given higher r* would reduce the likelihood of hitting the ZLB and of future Fed QE to provide monetary stimulus.
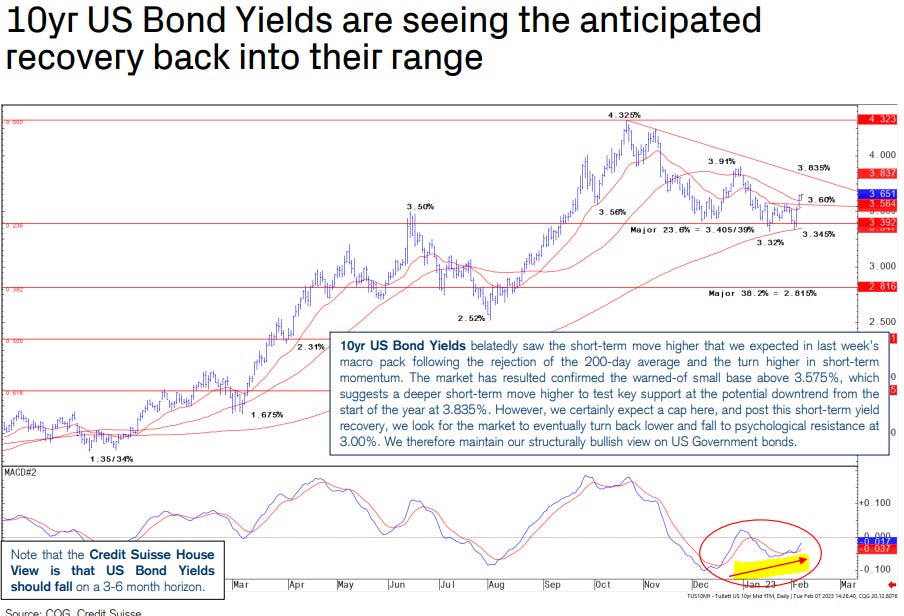
AND for the visual learners out there (like me), a chart or two. 1stBOS weekly
… The 10yr US Bond Yield resultantly backed away further from the key 200-day moving average at 3.35% and broke short-term support at 3.575%. We see scope for a test of the potential downtrend from the start of the year at 3.835%, where we would look to fade the recovery and increase duration exposure.
Thereafter, we expect an ongoing steady grind lower in yields, interspersed with regular corrections like the one we are seeing now, ahead of an eventual move to our 3.00% objective. As we argued in our Q1 outlook, any move lower in yields is likely to be extremely gradual, as realized inflation still remains high, and technically, US Inflation Expectations are still holding up in their range for now.
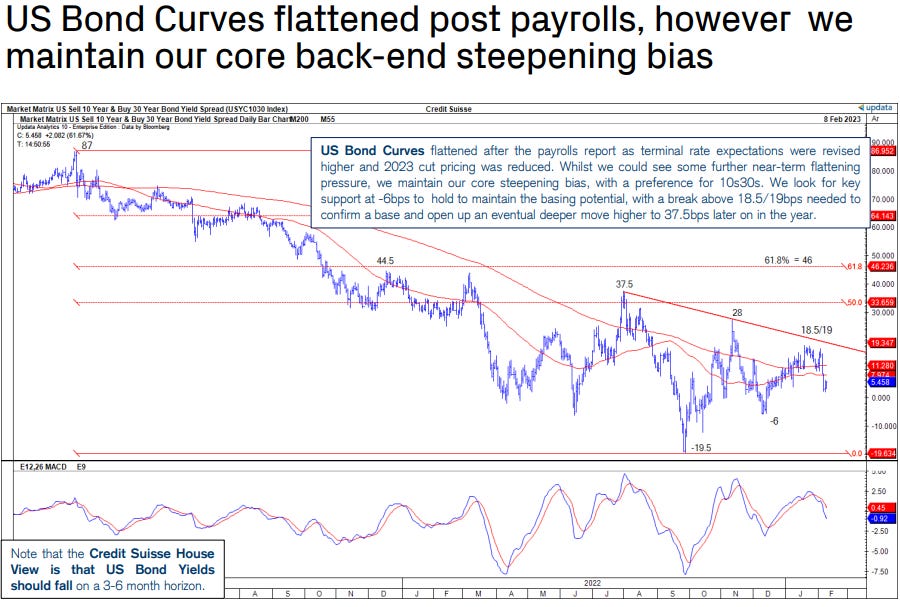
US Bond Curves have broadly flattened after the payrolls surprise, however we maintain our core US 10s30s steepening bias.
Finally, it would appear that while rate CUTS remain priced into end of 2023, some positioning / trading of OPTIONS having something else to say. Bloomberg,
… The Federal Reserve’s pushback against the pivot narrative is starting to gain traction, and if it really starts to grip markets that could see a rapid unwind of much of this year’s everything rally. Consider bond investors, who are apparently holding tight to their conviction that the past year’s harsh interest-rate increases will cause a severe economic slowdown — potentially a recession. That should push the Federal Reserve to soon stop hiking and start considering rate cuts. Yields on Treasuries maturing in two years or more are all solidly below the Fed’s cash-rate target, while swaps show sustained expectations for rate cuts within a year.
Meanwhile, a surge in options that pay off in the event of significantly higher rates in September has broken out. At the very least that underscores demand to hedge any long positions in rates and bonds against the potential that the Fed remains hawkish longer than expected. It also underscores the dangers for those who’ve been buying bonds and equities anticipating a pivot. The fate of similar decisions to pile in around mid-2022 offers a warning of what could come.
More later but for now … THAT is all for now. Off to the day job…
,while thinking (~20230213) about the narrative trying to explain the "bear market rally" since October 2022 as a consequence of four big central banks supplying liquidity to the Markets. Following the link on the CMDI FAQ page about CISS leads to a warren of rabbit holes ... the point being the recent OECD CB squirt of liquidity would appear to line up with IG Big-Corporate bond market stress arc increasing and now subsiding on the chart.... Out of time as I must tend my own garden, so I'll just post some links for CISS spelunking for the plethora of readers who might be as unawares as I was and probably still am.


db's r* bit was interesting.... anyway, I came across this link attempting to measure bond stress I haven't seen in these here parts before,
https://www.newyorkfed.org/research/policy/cmdi#/interactive
,while thinking (~20230213) about the narrative trying to explain the "bear market rally" since October 2022 as a consequence of four big central banks supplying liquidity to the Markets. Following the link on the CMDI FAQ page about CISS leads to a warren of rabbit holes ... the point being the recent OECD CB squirt of liquidity would appear to line up with IG Big-Corporate bond market stress arc increasing and now subsiding on the chart.... Out of time as I must tend my own garden, so I'll just post some links for CISS spelunking for the plethora of readers who might be as unawares as I was and probably still am.
First, an example for German 10y:
https://sdw.ecb.europa.eu/quickview.do;jsessionid=DD2F4FE6CF67BDABC4FF1E12056CE251?SERIES_KEY=290.CISS.D.U2.Z0Z.4F.EC.SS_BM.CON
Second, for the total EU chartgasmic experience:
https://sdw.ecb.europa.eu/browseExplanation.do?node=9689686
...