(USTs bid on '45-50% volumes after non-responsive session in Asia')while WE slept; "Market Timers Hall of Fame" is an empty room
Good morning.
Bloomberg: … It’s a data-heavy day in the US, with November’s PCE inflation print in focus. Plus China thwarts its gaming giants again, Nike’s slump reverberates across the world and Musk says indexing has gone too far. Here’s what people are talking about.
… Markets rundown
US futures are a little lower as I type while Treasury yields and the dollar are steady. Beware of ‘‘razor-thin’’ liquidity, though: stock volumes are very low across many of the world’s financial markets on the final trading day before the long Christmas weekend. And speaking of liquidity, those zero-day options may not have been to blame for Wednesday’s drop in the S&P 500 after all……PCE inflation day
We’re not on vacation yet. November’s PCE inflation data are due at 8:30 a.m. New York time, which could help cement (or muddle) the case for lower interest rates in the coming quarters. Several Fed rate-setters, including Governor Christopher Waller and Atlanta Fed President Raphael Bostic, have said this is their key metric. Economists predict inflation will have been subdued in November, and by one measure it may hit the Federal Reserve’s target: Bloomberg Economics says that on a six-month annualized basis, core PCE likely advanced just 2% — right at the Fed’s target. We’ll be looking for details that may explain why Fed Chair Jerome Powell was confident about progress on disinflation, while others could reinforce comments that attempted to walk back Powell’s stance.
I had hoped to make this — likely the last hit of 2023 due to travels — one of epic proportion (similar to the moves in equity markets late the other day) but the truth is I got nothin’ …
This spot here on the intertubes is one where I’m just thinkin’ out loud and somehow you all (both of you) have stumbled upon it and so for that, allow me to begin by saying thank you.
I’m grateful for your eyeballs and for you allowing me to vent (and stickin’ around for it all — for whatever reason).
As my 2nd year out of an institutional FI seat comes to a close, I’ve got to say that life on the other side of ZERO rates (and vol) has been … well interesting, to say the least.
I’ve always strived to put forth some sorta global / macro markets view and incorporate whatever Global Wall Streets sayin / SELLIN and to do so in an independent way. Some who dont have access TO how Global Wall Street thinks / acts and others who DO simply looking for a synopsis.
Freedom isn’t free but this ‘Stack will be on into the foreseeable future but my deepest and most sincere thanks to those who’ve pledged. I used to ask for compensation via transactions. FLOW. It was not unlike Bezos / AMZN where the trading in USTs — a space notorious for little to no spread and so — having to hope I could make it work with VOLUME.
It was interesting and terrific (and mostly viable biz plan … while rates were something ABOVE zero and even when they headed down for the count, the PEOPLE I had the pleasure of helping into and through the pandemic … those I was dealing with made the job NOT a job.
And so from that to this — whatever it is we’re all doing here — I’ll say it’s ALWAYS ‘bout the people. NOT yet written by AI and no plans in the immediate future …
It is people that make up global markets — whether they are institutional people or just regular folks trying to figure it all out (I’m still in that camp — always have been — just trying to figure it all out).
Talking heads and popular kids will come and go on ‘bobble head TV’ — falling in and out of favor based on (have NO idea to be honest but rarely is it based on skill — sure there are a FEW out there — some of which may even be reading here — but, well you get the point) … There are a few voices out there which have helped guide ME over the years and to name them all … well, would be difficult and so I won’t…BUT to those who’ve helped ME over the years — and to those I’ve met only recently via this ‘Stack — (near and far), you know who you are — I’d like to say thank you.
I’m grateful for any / all referrals back here to this spot on the web and I appreciate any / all dialogue, commentary and criticisms … It’s how we grow, learn and evolve alongside markets.
And with that said, I’ll step down off my soap box and offer up a single last chart of my own doing to consider as we turn the page from 2023 on into 2024 and whatever it may be that lies ahead…
… from a guy who thought Fed was WINNING and broke something back in March (SVB) but then came up with new funding to sticksave the world … I’ve got a weekly look at 10yy and they are overBOUGHT as they are (and have been for while) on the DAILY (inset) … clearly rates can remain low / overBOUGHT longer than one’s view can remain solvent.
This past year was to be THE year of the bull steepener. Seems to easy to roll that view TO 2024 and yet, 6 rate hikes priced is just that, no?
How / WHY can these cuts be justified? Welp, Fed WINNING …
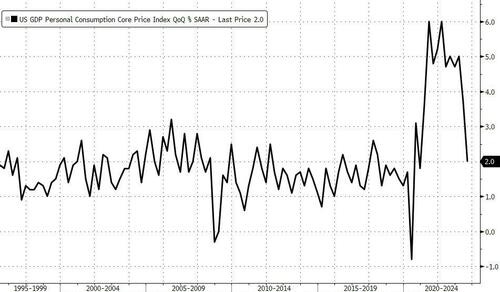
ZH: Final Q3 GDP, Personal Consumption Revised Sharply Lower As Core PCE Slumped To 2.0%
… But even more important than the (meaningless) GDP components was the price data, which came far weaker than expected and was a notable drop from the previous estimate, to wit:
GDP Price Deflator 3.3%, Exp. 3.6%, Last 3.6%
PCE Prices 2.6%, Last 2.8%
Core PCE Price Deflator 2.0%, Exp. 2.3%, Last 2.3%
… Translation: three months ago, when the Fed was still pointing to more rate hikes in 2023, core PCE had already fallen to the Fed's target and only the lack of "accurate" data is what apparently prevented the Fed from turning more dovish. Of course, the same lagged effect of accurate data is why the Fed's rate cuts will be coming just as inflation is once again starting to run away to the upside, guaranteeing a catastrophic repeat of the 1970s Arthur Burns Fed.
… rate cuts PAID but … oh boy lets HOPE ZH wrong (but I’m reminded constantly by this Fed that HOPE isn’t a strategy) and there’s more on inflation re-accelerating from others just below …
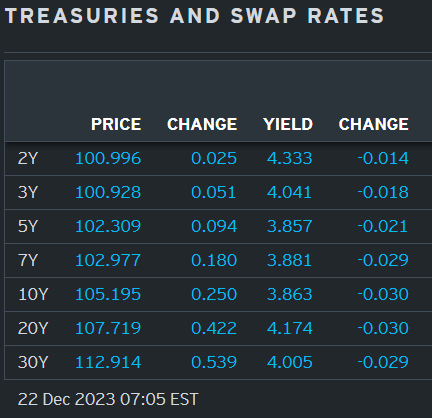
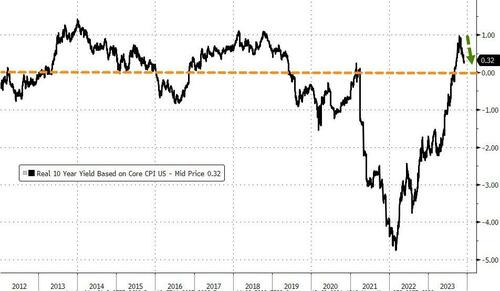
In other words, my hesitation to ‘buy IN’ to rate cuts here / now is NOT only driven by ZH :) … here is a snapshot OF USTs as of 705a:
… HERE is what this shop says be behind the price action overnight…
… WHILE YOU SLEPT
Treasuries are richening modestly on 45-50% volumes after a non-responsive session in Asia. JGBs actually proved quite volatile however, thin liquidity exacerbating a ~8bp cheapening move in 20y paper on the poorly-subscribed 15.5-30y liquidity tap auction. Flow wise, color was very sparse with some receiving going noted in long-ends from DRM, while the London session saw bull-flattening extend somewhat on the weaker UK GDP revision. DAX & S&P futures are down -0.1% here at 7am, crude +1%, XAU +0.7% on the leadership seen in US real rates (5y RY -3bps). 2s10s curve -0.6bps and 2s5s10s +0.5bps.
… and for some MORE of the news you can use » The Morning Hark - 22 Dec 2023 and IGMs Press Picks (who CONTINUES to be sportin’ that new, fresh look) in effort to to help weed thru the noise (some of which can be found over here at Finviz).
Moving from some of the news to some of THE VIEWS you might be able to use… here’s SOME of what Global Wall St is sayin’ …
Advisors Asset Management: MACRO TRENDS COULD STILL HAUNT 2024 (tell these 4 or 8 guys ‘bout this Market Timers Hall of Fame)
… We have lived with an inverted yield curve since October 2022 — the longest streak ever in U.S. history of the 10-year Treasury Note yield minus the 3-month Treasury Bill yield curve spread. The chart below shows that in each one of these cases, a recession followed. That is 100% accuracy over history. The fact that this inversion is the longest on record indicates it’s not likely that a “soft landing” follows, but a recession.
… My final point here is to look at a list of “events” that precede a recession. These are events that typically mark recessionary bear markets going back to 1871. They include:
Yield curve steepening
Tightening of credit conditions
Fed rate cuts
Equity markets decline and bottom
Earnings per share trough and then equity markets recover
We have arguably begun this process and as the chart below indicates, we are roughly somewhere between 12 and 15 months away from an equity market trough. If history rhymes here, then 2024 can be a positive, yet bumpy, year for stocks. It might be 2025 that is the bottoming year.
Remember, the “Market Timers Hall of Fame” is an empty room. We are not trying to time the market and we are firm believers that investors should be fully invested at all times. However, what we are saying is that owning the few expensive stocks in a broad index like the S&P 500 is likely to punish concentrated holders in 2024 just as it rewarded them in 2023. We believe a diverse portfolio that is reflective of high-quality companies tends to be resilient in turbulent markets. We want investors to know what to expect and how to think about their portfolios before a slowdown is upon us. After all, survivors are really the only winners in the long-term game of investing.
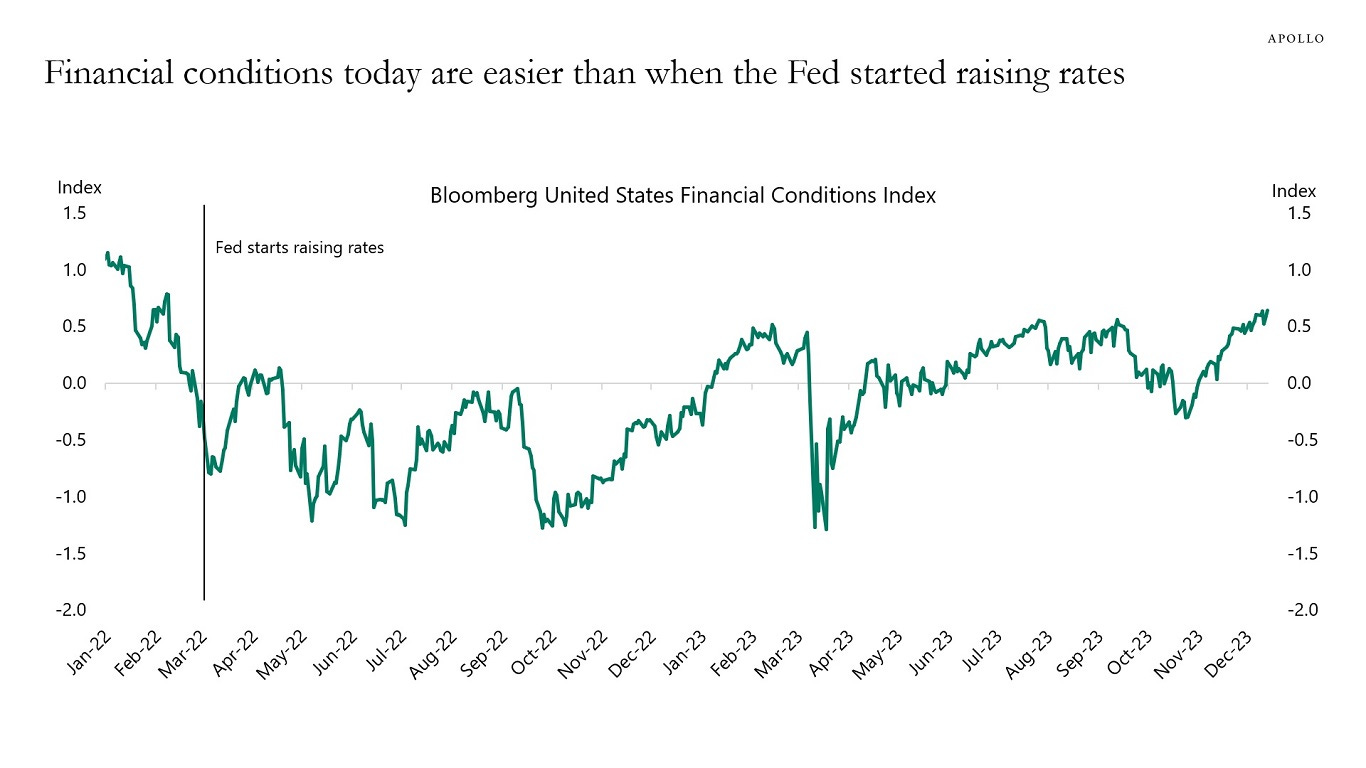
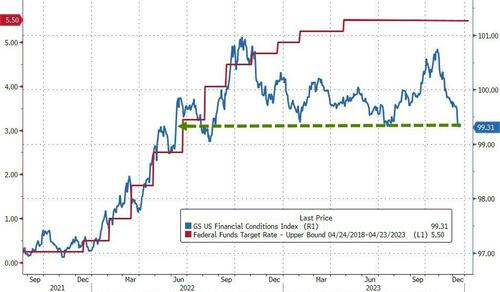
Apollo: Easy Financial Conditions Boosting Growth and Inflation in 2024 (Fed actually considers this sorta esoteric measure and it makes some sense if they tell us rates UP were equal to HIKES than … what now?)
Financial conditions are easier today than when the Fed started raising rates in March 2022 (see chart below), and the same picture can be seen for the measures of financial conditions from the Chicago Fed, St. Louis Fed, and the Kansas City Fed. With core CPI inflation still at 4.0%, this will be a problem for the Fed in 2024.
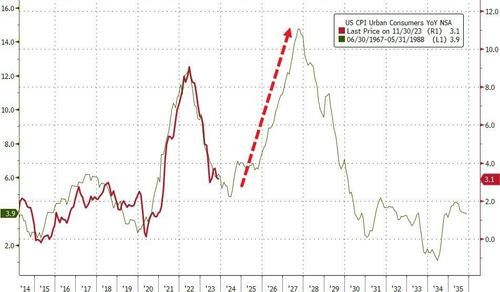
Apollo: A Second Mountain in Inflation? (there’s a lesson from history in here…)
With the Fed worrying less about inflation and more about growth, the risks are rising that easier financial conditions triggered by the Fed’s pivot could start another rise in inflation driven by higher prices on housing, labor, services, and goods, see chart below.
Barcap US Economics: Q3 GDP update marks down core PCE price inflation
Today's third estimate subtracted 0.3pp from Q3 GDP growth, to a still-robust 4.9% q/q saar. Downward revisions were mostly focused in PCE services, including financial services and travel. The estimates also trimmed core PCE price inflation in Q3 by 0.3pp, to 2.0% q/q saar, reflecting revisions to non-market components.
Bespoke: From 52-Week High to Down 1%
Big Turnarounds
It was a tale of two markets yesterday. In the morning, the S&P 500 rallied to new 52-week highs only to give it all back and more in the afternoon. By the time the closing bell rang, stocks were at the lows of the day and finished down over 1%. There aren’t many places in the world where you can go skiing in the morning and swim in the ocean in the afternoon, but the market did its version of that yesterday.
While yesterday’s reversal was jarring, in the context of a daily chart of the S&P 500 ETF (SPY), it barely looks like anything more than a blip. Even after yesterday’s decline, SPY is more than 5% above its 50-day moving average (DMA) and more than 8% above its 200-DMA.
While yesterday’s reversal doesn’t look like much on a one-year chart of SPY, in the ETF’s history dating back to 1994, reversals of that type have been incredibly uncommon. The last time the ETF traded at a 52-week high on an intraday basis but finished the session down over 1% was back in April 2014, and in the ETF’s near-30-year history, there have only been seven other occurrences before yesterday. In the chart of SPY below, we have marked where each of those prior reversals occurred with a red dot. As shown, none of the prior occurrences marked a significant top for the market.
In the table below we show the performance of SPY following each of the prior occurrences along with its performance going forward. While performance over the following week was mixed, the ETF was still up more often than it was down, and the median gain was nearly 1%. A month later, SPY was higher six out of seven times for a median gain of 3.38% with gains six out of seven times. Three, six, and twelve months later, the ETF also had positive median returns, but more notably, it was higher every time…
BNP US equities: Skewed risks | Navigating an asymmetric 2024 outlook
Margin disappointment to drive earnings downgrades…
Skewed risks: We see the risks in 2024 as very asymmetrically skewed to the downside. If we do see disinflation, rate cuts, and earnings reacceleration it could be risk-positive, but volatility-negative. This bullish consensus scenario lacks the same recalibration the market had post the Fed’s pivot in Q4 2023. Instead, shocks to the consensus are much more likely to be on the downside. Risks from geopolitics, fundamentals, valuations and positioning all imply a fatter left tail for equities. However, one place where we see no evidence of a fat left tail is the options market. Implied volatility is at lows and skew is extremely flat. This leaves downside equity volatility at very low absolute levels and in our view attractive to own.
Avoid both extremes in rotation: There were two equity regimes in 2023. The first was an extreme lack of breadth that drove massive NDX outperformance, led by the Magnificent 7. The second was a “dash for trash” in Q4. Our outlook for 2024 suggests that investors avoid both of those extremes going forward. NDX looks vulnerable given very elevated valuations. And while the Magnificent 7 were largely immune to the rolling recession in industrial cyclical parts of the economy, we feel that they would be less insulated from a consumption slowdown or a spike in unemployment. For the RTY, we do see a fatter right tail in the case of an acceleration in growth. However, we also see risks that the “dash for trash” has overestimated the relief from anticipated Fed rate cuts, at a time when nominal GDP is rapidly decelerating and effective interest rates for corporates are still rising. Our preferred part of the market to be long is the body of the distribution – for example, equal-weight S&P500 (SPW). This avoids the tails that are either risky or too expensive and has an industrial cyclical bias versus the market cap-weighted S&P500 (SPX). SPW is our preferred long and NDX our top US index short.
FirstTrust: Data Watch - Real GDP Growth in Q3 Was Revised Lower to a 4.9% Annual Rate
Implications: … Today we also got our second look at economy-wide corporate profits for Q3, which were revised slightly higher, now up 3.4% from Q2 verses the 3.3% gain reported last month, and down 0.6% from a year ago versus the -0.7% reported a month ago. The government includes Federal Reserve profits in this data, and the Fed is making losses. So, we follow profits excluding those earned (or lost) by the Fed, which are still up 5.5% from a year ago. Moving forward, we expect a further slowdown in corporate profits as the economy continues to re-normalize after the massive fiscal and monetary stimulus of 2020-21. In turn, this will be a headwind for equities. In addition to corporate profits, we also got revisions for Real Gross Domestic Income, an alternative to GDP that is just as accurate. Real GDI was unrevised, increasing at a 1.5% annual rate in Q3 but is down 0.1% versus a year ago, consistent with underlying economic weakness. These are figures that are normally seen in and around recessions. Regarding monetary policy, inflation continues to move lower. GDP inflation was revised down to a still elevated 3.3% annual rate in Q3 versus a prior estimate of 3.6%. GDP prices are up 3.2% from a year ago, still well away from the Fed’s 2.0% target…
Goldilocks: USA: Q3 GDP Growth Revised Down to +4.9%; Q3 Core PCE Inflation Revised Down to +2.0% Annualized; Philly Fed Below Expectations
BOTTOM LINE: Real GDP growth was revised down 0.3pp to +4.9% annualized in the third quarter (qoq ar), below consensus expectations and driven by a 0.5pp downward revision to consumption growth to a still-strong +3.1%. We will update our Q4 GDP tracking estimates following tomorrow’s personal income and spending report. Price indicators were revised down, consistent with our expectations and the signal from Chair Powell’s press conference last week. We left our month-over-month November core PCE inflation estimate unchanged at +0.07%, now corresponding to a year-over-year rate of +3.13%, and our headline PCE inflation estimate unchanged at -0.06% (mom), now corresponding to a year-over-year rate of +2.45%. The Philadelphia Fed manufacturing index declined by more than expected. The composition was mixed, with declines in the new orders and employment components but an increase in the shipments component. Both initial and continuing jobless claims increased by less than expected.
Goldilocks: Higher Interest Rates and Riskier Lending Are Driving the Rise in Credit Card Delinquencies
… We see three likely reasons for the increase in delinquency rates. First, the borrower pool appears to have become riskier. Fiscal stimulus and reduced spending inflated some households’ credit scores in 2020, leading banks to lend to riskier borrowers who are now delinquent on 2020 vintage cards at elevated rates. Second, interest rates on credit cards have risen by about 40% (or 6pp) since 2019. While middle- and high-income households paid down their balances enough to offset the impact of higher interest rates, low-income households did not and now face significantly higher monthly interest payments. Third, the resumption of student loan payments in October 2023 delivered a roughly 7% hit to income for the average household with student loans in the bottom income quintile and has likely made it difficult for some to pay their credit card bills…
… Looking ahead, higher interest costs and student loan payments are likely to keep delinquency rates elevated in early 2024, especially for low-income households. We expect the new (30+) delinquency rate for credit cards to rise gradually from the current level of 8% in 2023Q3 to 9.5% in 2024H1, before falling to around 9% at the end of 2024 as interest rates moderate and income grows …
Moodys WEEKLY MARKET OUTLOOK: Housing Market Turning a Corner?
In the U.S., the 30-year fixed mortgage rate ticked down to 7.1% in the first half of December. While still more than double the rate as recently as early 2022, it is nearly a point lower than what was available to homebuyers in October. This reduction, owed in large part to inflation’s steady moderation and the Federal Reserve’s acknowledgment of that fact, has initiated an uptick in refinancing. Refinancing hit its highest level since the beginning of 2023 in the week ended December 10, though levels are still historically low…
UBS: Q3 GDP revised down, inflation too (rate cuts, anyone??)
Core price gain revises down to Fed's 2.0% target
Core PCE prices' third quarter increase revised down 0.3 pp to 2.0% (saar) in the third release of Q3 GDP. That was close to our expectations for the revisions to prior months and leaves us on track to see the 12-month change in core PCE inflation fall to 3.1% in November, below the median of the current posts on Bloomberg. The 6-month annualized pace of inflation we expect to fall below 2.0%. We outlined these expectations in the inflation monthly publication this week and in the preview and discussion of the the implications for monetary policy on page 2 of Friday's US Economics Weekly. Note that in the .pdf report the links will take readers to the respective publications.Q3 GDP revised down in third estimate to 4.9%
Initial claims for unemployment insurance little changed
Philadelphia Fed manufacturing survey falls below expectations to -10.5
Wells Fargo: Will the LEI Be the Grinch That Stole the Soft Landing?
Summary
The Leading Economic Index has declined for twenty straight months, a run that historically would indicate recession is imminent. Will the LEI steal the soft landing or will it change course in 2024 like the Grinch's view of Christmas?Yardeni: Roaring Stock Market
The stock market came roaring back today led by the stock prices of companies that are benefitting from the Roaring 2020s. Strong results and guidance from Micron Technology boosted shares 9% today, while lifting other chip and semiconductor equipment stocks (chart). Micron is the largest US memory chip maker. Its chips go into a wide range of products.
The rally since the correction low on October 27 has been breathtaking (chart). Here is the performance derby of the S&P 500 and its 11 sectors since then: Real Estate (22.9%), Consumer Discretionary (21.1), Financials (18.7), Information Technology (18.7), Industrials (16.9), Communication Services (15.8), S&P 500 (15.3), Materials (13.8), Health Care (9.3), Utilities (6.4), Consumer Staples (6.4), and Energy (-0.2). Six of the 11 sectors have outperformed the market.
… And from Global Wall Street inbox TO the WWW,
AllStarCharts: Bonds Rock as Rates Roll
Last month’s bond rally has legs.
Long-duration bonds have gone from printing multi-month highs to reclaiming their March pivot lows in just a few weeks.
So, let’s revisit our recent swing trades as they continue to run…
Thirty-year T-bond futures sliced through our initial target of 122:
Luckily, a completed bull flag provides a precise level to define our risk.
We can take another long position in T-bond futures, targeting 134, but only if it holds above 124’09.
Here’s a look through the equities market…
The long-duration bond ETF $TLT is on the verge of reclaiming a critical shelf of former lows:
Let’s call our line in the sand 100.
A decisive break above that psychological level likely sends price to that hundred-dollar roll of 110. That’s our target.
If trading the futures markets isn’t for you, or catching a 10 percent gain in TLT doesn’t make sense, I get it.
There are better trades on the sheet.
But don’t take your eyes off the bond market.
Those “better trades” will continue to work if TLT is trending above 100 as the positive correlation between stocks and bonds remains in place.
Bloomberg: Why Traders Are Refusing To Give Up On The Idea Of A March Fed Rate-Cut
Authored by Ven Ram, Bloomberg cross-asset strategist,
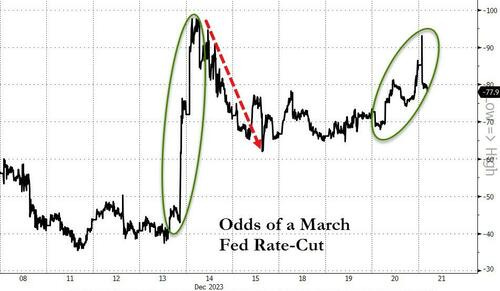
Despite pushback from Fed officials, the markets are growing in conviction that an interest-rate cut is possible as early as March.
History is on the side of markets.
Interest-rate traders, who were ascribing almost a 100% chance of a 25-basis point cut in March after last week’s dot plot, had trimmed their assessment to some 60% by the start of this week as Fed officials from John Williams to Loretta Mester to Raphael Bostic all pushed back on the notion of an early reduction.
Traders have since raised that possibility again, this time to around 90%.
What gives?
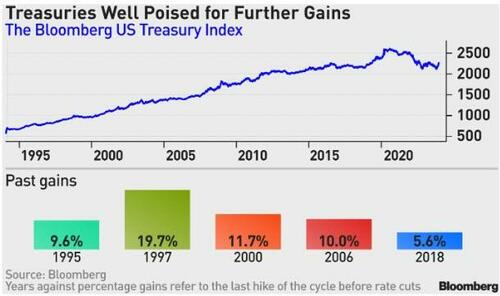
Well, the median time for the Fed to go from a hike to a cut has been 231 days in data going back almost three decades.
Given that we got the last rate increase in July, the Fed’s March meeting will have won history’s sanctification.
That’s not all: the Bloomberg Treasury Index is bound to recover to levels last seen when the Fed started raising rates.
The Bloomberg Treasury Index has made hay in the interregnum between tightening and loosening cycles, having gained unfailingly in each of the past five iterations.
Gains between the end of 2018 when the Fed ended raising rates and August 2019 when it cut rates were about 5.6%, the least historically.
Assuming a conservative reprisal of those gains, the index is on track to re-claim around 2,352, last seen around the time when the Fed started tightening rates in this cycle.
The Fed’s latest dot plot showed that policymakers were willing to reduce the funds rate by 75 basis points next year, spurring a 2% rally in the Bloomberg Treasury Index last week, its best performance since the early days of the pandemic.
The dovish dot plot may have stemmed from the Fed’s conviction that rates needn’t be as restrictive in the face of headline inflation that has halved to 3.1% this year.
However, core inflation remains sticky at 4%, posing a risk to the market’s pricing.
Denials by Fed Speakers notwithstanding, should the Fed be persuaded otherwise by continued progress in disinflation to cut rates, two-year Treasury yields may slump below 4% while the pace of gains in 10-year Treasuries slows, causing the yield curve to re-steepen.
Bloomberg: Fed Backs Self Into Corner Just As Inflation Revives
Authored by Simon White, Bloomberg macro strategist,
The magnitude of last week’s dovish swing by the Federal Reserve now makes a rate cut next year highly likely.
Yet, as is so often the case with central banks focused on lagging variables, it could come at exactly the wrong time, with a profusion of indicators showing inflation will be rekindled later next year. Rate-cut expectations look overdone, but any repricing may not come until the whites of inflation’s eyes are seen — when that happens the move will be dramatic.
No analogy is perfect.
But history rhymes because there is one thing that is immutable through time: human nature.
The 1970s were different to today in several respects, but the immutability of human behavior makes it quite conceivable a similar inflation pattern could recur…
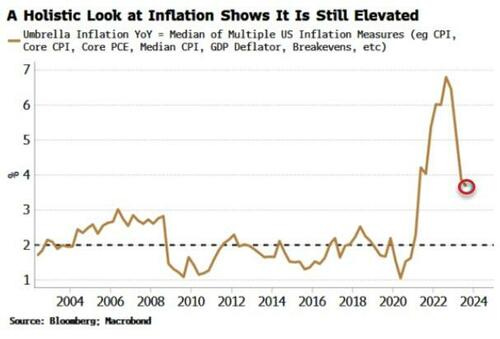
… Focus is often on headline CPI, which has retraced 85% of the way from its recent highs toward the 2% target. But a more comprehensive look at inflation shows the drop has been much less dramatic, with the median of a broad set of price-growth measures still very elevated compared to pre-pandemic norms.
Nonetheless, inflation’s steep decline is justifying the benign outlook the Fed and other central banks increasingly have. But a turning point looks very much on the cards. It’s starting to feel like we’re in the midst of Act II, the premature all-clear — and Act III is soon about to begin.
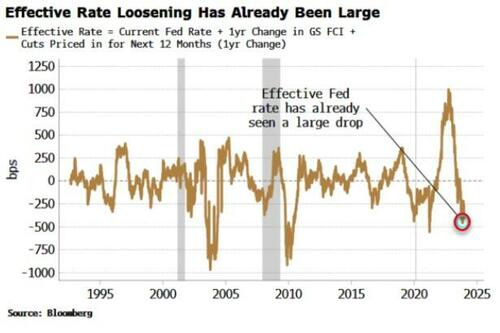
Note we have already had a large de facto easing in rates. Goldman Sachs’ Financial Conditions Index is designed such that it translates into an effective change in the Fed rate. If we add this implied fall in the policy rate due to the loosening in financial conditions to the cuts that are priced in by the market for next year, the effective Fed rate has already experienced a significant decline.
Thus before the Fed has even cut rates, inflation potential has risen — and is why the Fed’s recent pivot is a monumental gamble.
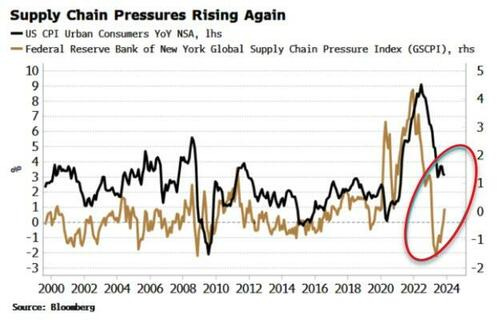
We can see this pipeline inflation explicitly. The following charts need little commentary and show clearly from multiple angles that disinflation will soon be over, and price growth will begin rising again later next year.
First is supply pressures. After easing significantly as the world came out of lockdown, they are now climbing quickly again. The fracas in the Red Sea is a reminder of how brittle supply chains are in a world of heightened geopolitical risks.
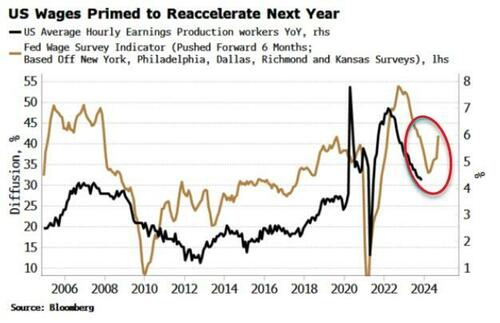
Next is wages. Wage growth has been falling, but remains positive in real terms. Importantly, leading indicators show wage growth will start to pick up again next year. The NFIB survey’s compensation plans component has started rising again, and the Fed regional wage surveys have picked up strongly, which lead average hourly earnings by about six months.
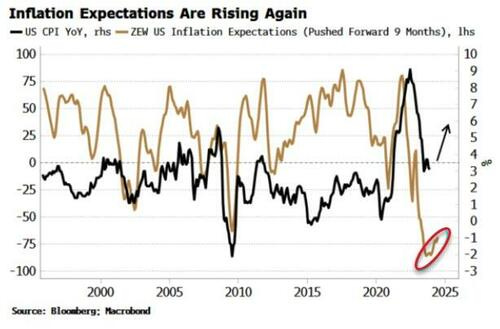
Third is inflation expectations. After seeing a steep fall when central banks were hiking, they have started to rise again.
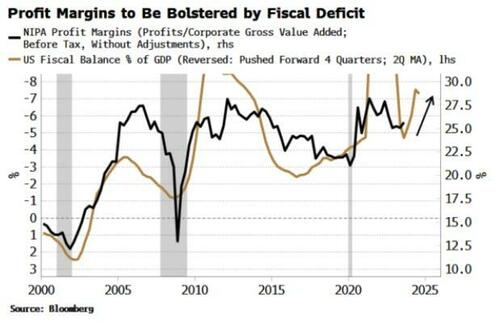
Then there is profits and profit margins. Profits are now the biggest contributor to corporate prices, in contrast to the decades before the pandemic, when labor costs were the largest driver. Profit margins fell after the pandemic, but they have stalled at a higher level. The large fiscal deficit is likely to push profit margins higher again next year.
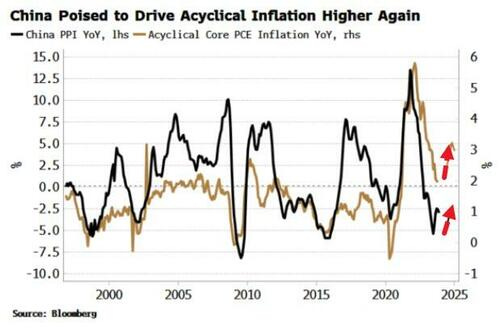
Fifth is China. It has been one of the key drivers of US and global disinflation (more so than the direct impact from central-bank rate hikes). The central government in China is using its capacity to borrow more to stimulate, while the PBOC is pumping increasingly more liquidity into the system. China is likely to turn a corner in 2024, which will stoke significant inflationary tailwinds.
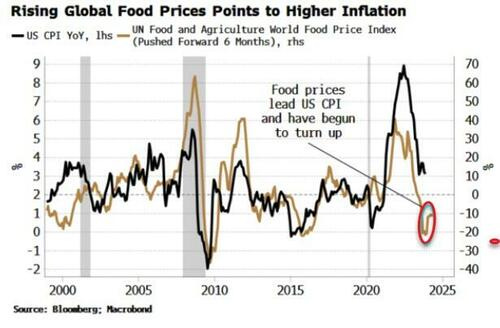
Then there are global good prices, which have started to rise again too. These lead US CPI by about six months.
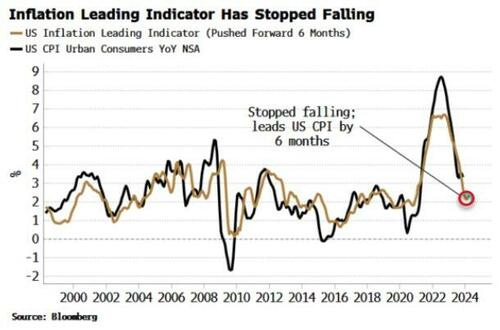
Finally, my leading indicator for inflation, which leads US CPI by six months, looks like it has stopped falling and is on the cusp of rising again.
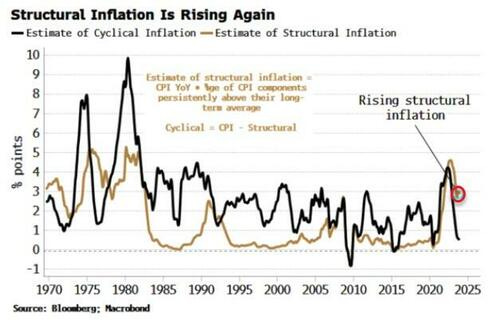
Most of US inflation’s fall has been driven by cyclical factors, e.g. energy. Structural inflation – defined as the sub-components of CPI that are persistently above their long-term average — has fallen too, but remains elevated (see chart below).
Here lies the rub: structural inflation looks like it has started to turn back up while the risk of cyclical inflation turning up again too is rising (oil has been climbing), reinforcing the nascent rise in structural inflation.
The result: headline inflation begins to re-accelerate.
To miss one or two signs of rising inflation may be misfortune, but to miss at least eight looks like carelessness. With CPI fixing swaps seeing a continuation in the disinflationary trend through 2024, markets will likely have to re-adjust their inflation outlook at some point next year. However, the Fed’s fervent dovish conversion could see it cutting rates all the same — right when the third inflation act is about to begin.
Bloomberg: Five Things You Need to Know to Start Your Day (Asia … on the year of the bond … which actually turned out to be the year ot the mag7)
… The so-called “year of the bond” ended up being more a case of year of the (mega-cap tech) stock. The MSCI All-World index of equities is up 19% through Thursday, making up for much of 2022’s 20% plunge. Even as fixed-income assets came charging back with the Fed’s pivot toward interest-rate cuts, Bloomberg’s Global Aggregate bond gauge is up a relatively puny 5.1%.
With US stocks surging toward record highs even as bond markets are busy pricing in a recession, the new year is likely to bring plenty of challenges. One concern for equity investors is that years as festive as the current one usually have been followed by more paltry returns. The MSCI index rose 15% or more during 12 of the past 30 years, and there’s only been one occasion when it then beat those returns in the ensuing year — back in 1999 just before the dot.com bubble burst. The median outcome offers some consolation, at about 10%, but the odds for another surge like this year’s are scant, at least based on the historical record.
Bloomberg The Weekly Fix: Christmas party in bonds drowns out Fed’s humbug
The Year of the Bond
Fixed-income assets are sailing into the end of 2023 in a very festive state indeed — a sharp contrast to the way things went for much of what was supposed to be “the year of the bond.” While we started with a sizzling rally, the ride soon turned very bumpy. The Federal Reserve and its peers looked past some painful economic fallout and kept hiking interest rates higher than most anyone in the markets had countenanced.Bloomberg’s global bond benchmark was up 4.7% at the start of February — its best start to any year since its 1990 inception — before tumbling to erase all those gains before that month was out. After fluctuating for a period, a decisive downturn came in July and by late October the index was nursing an almost 4% loss as hawkish policymakers and profligate governments sparked chatter that the bond vigilantes had risen again to demand ever higher yields…
… Higher, But Not for Longer?
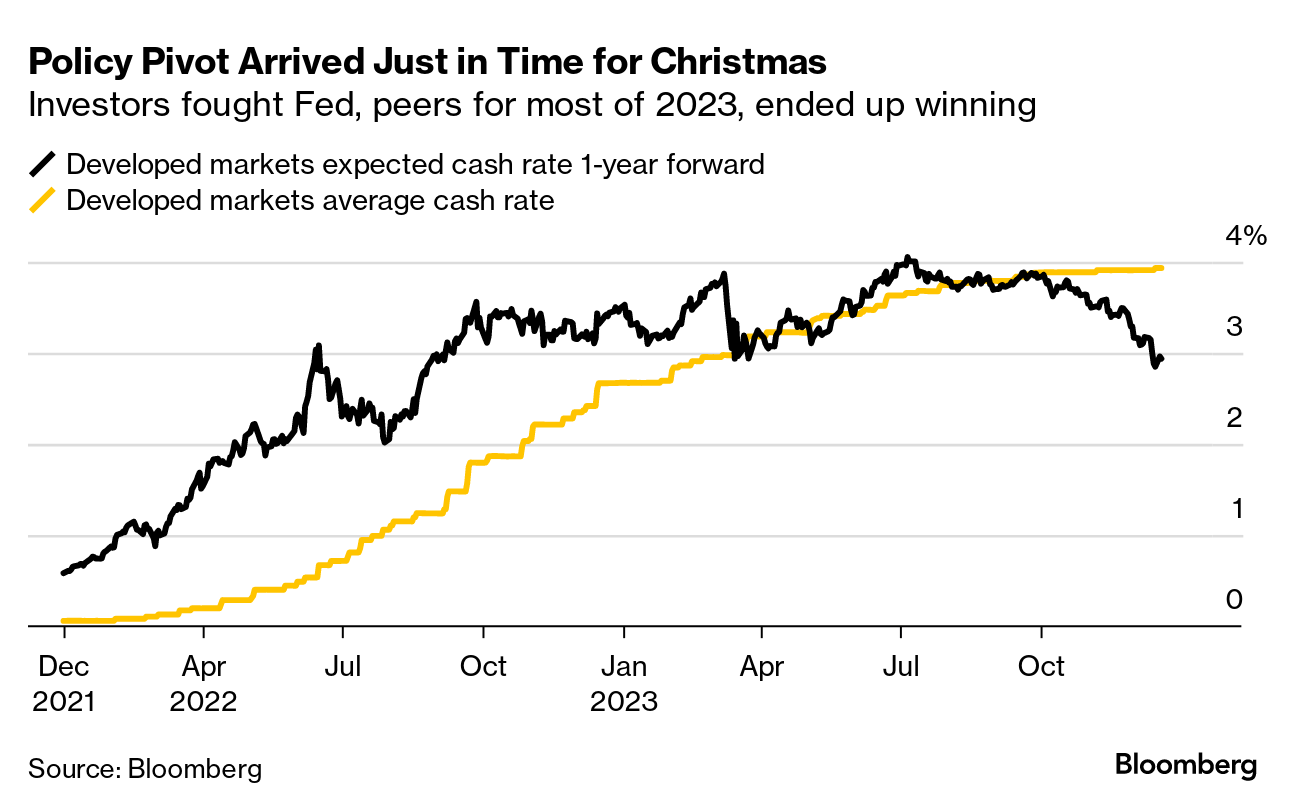
Traders started this year expecting the average cash rate across developed markets to rise 75 basis points: it ended up climbing 125 basis points. That goes some way to explaining the wild and at times bruising fluctuations that afflicted bond investors. Traders persistently projected that rates would turn lower after about six months out, and those positions came undone in spectacular fashion on a number of occasions.Bets on lower rates flourished after the banking crisis hit during the first quarter, with the collapse of Silicon Valley Bank and the disappearance of Credit Suisse Group into a forced merger. The crisis sent speculation to a fever pitch that central banks had done enough to “break” their economies so they would now be cutting rates in order to “fix” them. The move in markets was strong enough for at least one trader to make a tidy profit on rate cut bets — turning what had looked like a losing position into a big win. Even so, central banks stayed with their tightening stance as inflation stuck around. Instead, a bit of liquidity and a policy pause was all that came, and most so-called recession trades fell flat.
There were also signs that the wild fluctuations hitting markets owed much to the massively leveraged basis trade — which relies on the arbitrage between the prices of Treasury futures and the bonds that can be delivered to satisfy such contracts.
The record shorts that underpinned such trades were matched by record longs held by asset managers, undoubtedly helping to spice up some of the swift moves up and down in yields experienced during the year. There were also some stand-out trades that rode the roller-coaster to an exhilarating finish. Billionaire investor Bill Ackman shorted 30-year Treasuries in August at about the right time, before switching to bets on 2024 rate cuts in late November. Former bond king Bill Gross also did well with his own wager on early rate cuts.
ZH: "No Longer In The Bull Camp" (Peter Tchir / Academy … worth a look)
… Bottom Line
Maybe the party isn’t over, but I’ve had my fun and think it is time to run (okay, more of a quiet exit than anything too bearish, but I’m out of here!).
… AND that’s ALMOST it …
… And from BankUnderground’s (BoE) top 5 posts a picture worth a(nother) 1000 words,
… THAT is all for now. Off to the day job…back in 2024 and all the best as you plan your trades and trade your plans!








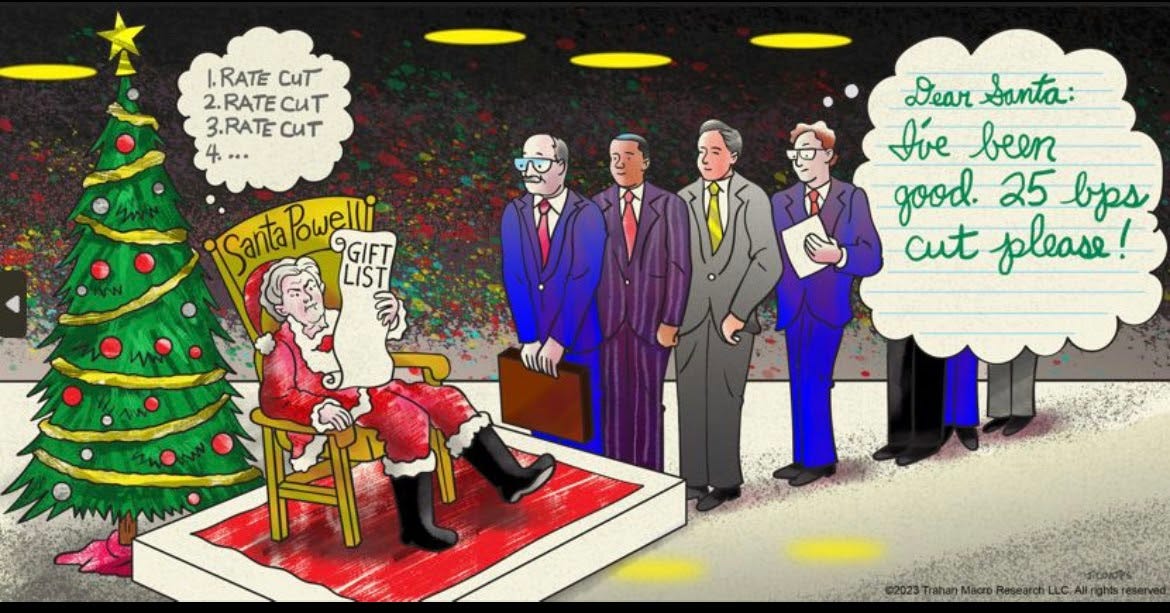


(Price) Inflation's strange, Santa Caps for 99 cents to $1.99, while food prices at the 99 cent store make me go WTF?!? I see many elements of the When Money Dies Crack-Up Boom in this society/world....
But won't keep you long, the last of your 2023 was EPIC, thanks for providing ALL views of the macro economic & markets, and your own special Personal Touch of knowledge & wisecracks, lets HOPE lol our 'leaders' gain wisdom, guilt, and restraint (I dream big lol) heading into 2024.
Fantastic Newsletter !!!
So much Information....
Lots of Historical Wisdom, there..
I truly appreciate your words of Caution for 2024......
It's easy to get caught up in the Bullish enthusiasm, going on right now.
2024 could prove more difficult, than people think.....
Hope we get that Soft Landing, but so many Variables have to line up, for that to happen.
Not necessarily the Base case.....Probably Mild-Moderate Recession is.....
Thanks for all your Hard Work !!!