Good morning … So what did I miss yesterday? TO MSs global macro mkts wrap,
BoE increases pace of hikes back to 50bp; Gilts twist flatten, with market terminal Bank Rate pricing at 6.10%; NOK outperforms after Norges Bank delivers a 50bp hike; USTs grind cheaper, led by the belly; Mexico TIIE rallies after CPI, Banxico remains on hold; US 10y at 3.795% (+7.6bp).
…Although 2y USTs sold off 7.6bp, to 4.79%, pricing for the Fed’s terminal rate wa s little changed ~5.35%,yet markets more clearly priced in a higher-for-longer rate path in 2024. This came amid comments from Fed Chair Powell, who stated he did not see rate cuts happening anytime soon and Atlanta Fed President Bostic, Wednesday evening, who said he did not expect rate cuts for “most of 2024.” In the inflation space, the $19bn 5y TIPS reopening auction was strong and stopped-out at 1.832%, ~3.8bp through. End-user demand soared to a record and left primary dealers with the lowest share on record at 3.9%…
That was then and so, overnight, 10yy have dropped about 6bps — why?
Thanks for reading The BondBeat! Subscribe for free to receive new posts and support my work.
CNBC: Treasury yields decline as investors digest Fed speaker comments
Perhaps it has all combined to weigh a bit (too much) on stocks and so, a flight TO USTs out the curve because, you know, a Fed fighting inflation means the long bond can / will breath a bit easier at night … ?
10yy WEEKLY ahead of this afternoons close … I’m (still)watching triangulated TLINE
TLINE: 3.80 momentum: on verge of BULLISH (ie lower yields) cross
Too early to draw any conclusions and so … here is a snapshot OF USTs as of 722a:
… HEREis what this shop says be behind the price action overnight…
… WHILE YOU SLEPT Treasuries are richer led by 7-10y space as EU and UK Manfg PMIs contract/disappoint (services also falling from higher levels), while broad weakness is evident in equities. The MSCI Asia Pacific index fell as -1.4% overnight (NKY -1.5%, HSP -2.7%) as the region returned from holiday. Japan national CPI modestly beat estimates, yet 5y JGB yields fell to the lowest level since last November in the Tokyo afternoon session, as the BoJ’s Rinban operation sizes were left unchanged and saw flat to negative spreads and lower cover ratios. EGBs and Gilts are firmly outperforming, erasing yesterday’s CB-inspired weakness (5y Germany -14bp, UKs 10s -8bps), peripherals and semi-core keeping pace (France 10y -12bps). USTs are underperforming and flattening through 10s with that curve to -102bps, the DXY well-supported at +0.6% as USDCNH rose >7.22 and EURUSD drops -0.8%. There was a 1.75k UXY buyer in London hours, flows tilting towards AM buying long-ends somewhat offset by real$ fading the richening in 7-10y space. Volumes are running ~140% (30d ave) and S&P futures are indicating -24pts here at 7am.
… Dipping right into the charts, we’ll start domestically and work our way out. First up, should 10y UST yields close the week within 5bps of current levels, we’ll have seen the tightest weekly range since January 2022 at ~12bps, with 30d realised dropping to the lowest since 2019. As we noted yesterday, this coiling range-trade should be view as an unstable equilibrium, our expectation being that bullish daily momentum (diverging from deeply oversold conditions in late-May) makes the path of least resistance a rally towards the ~3.55% level (June lows).
… and for some MORE of the news you can use » IGMs Press Picks for today (23 JUNE) to help weed thru the noise (some of which can be found over here at Finviz).
From some of the news to some of THE VIEWS you might be able to use… here’s what Global Wall St is sayin’ … Ripping through a couple days of inboxed narratives, tossing out most but a few things which did catch my eyes.
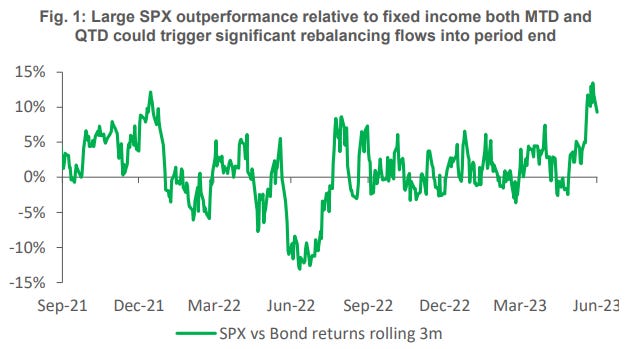
I’d pay some special attention TO the somewhat early read on POTENTIAL US equity flows into QUARTERS END as bigger picture thinkers and position’ers get P&Ls ready
Treasury Secretary Janet Yellen sees diminishing risk for the US to fall into recession, and suggested that a slowdown in consumer spending may be the price to pay for finishing the campaign to contain inflation. On the chance of a recession, Yellen said “my odds of it, if anything, have gone down — because look at the resilience of the labor market, and inflation is coming down.” She spoke in an interview with Bloomberg News Thursday. “I’m not going to say it’s not a risk, because the Fed is tightening policy,” she said, alluding to the Federal Reserve’s 10 interest-rate hikes since March 2022, with potentially more to come. Yellen’s assessment follows May jobs data that beat forecasts, while home construction and retail sales last month were also surprisingly resilient.
BNP: With 500bp in the rearview, Powell steers Fed along slow offramp
KEY MESSAGES
Fed Chair Powell offered a balanced message in his semiannual congressional testimony, which in our view indicates that the end of the tightening cycle is near.
We take signal from Chair Powell retaining much the same message as his June FOMC press conference, rather than modulating it to be more hawkish.
We maintain our forecast of a last 25bp rise at the July FOMC meeting and an extended pause thereafter, with the first cut coming in March 2024.
… We estimate there could be $70-95bn of US equities to be sold in pension rebalancing flows into month and quarter end, assuming $1.5-2trn of assets following a mix of monthly or quarterly rebalances. At the time of writing, US equities have outperformed bond markets by 5.1% and 7.7% (SPX versus US Aggregate Bond index, MTD and QTD respectively). As a yardstick for how large the reversion effect could be, we run a regression of large equity/bond theoretical rebalances versus mean reversion experienced into prior period ends. This regression implies current MTD and QTD moves being consistent with reversals in the magnitude of 2.3% and 1.3% respectively, or ~3.5% in total
DB on BoE: taking back control – terminal rate now pushing to 5.75% DB chart and question: How fast will it fall?
In our recent blog we delved into the possible trajectory US core inflation might take over the remainder of the year depending on the near-term economic outlook. Using our set of top-down inflation tools and different assumptions, the estimates obtained for core PCE in Q4 (% y/y) produce a range between 3.3% and 3.9%, with the most plausible scenario being 3.5%. The FOMC's June SEP median projection currently sits at the high end of that range.
According to our models, a scenario in which core PCE average 3.9% in Q4 would imply the following: no further progress on the labor market tightness front, long-term inflation expectations reaching new local highs, GDP growing above potential, longer than historically observed transmission from new rents to PCE housing inflation and PMI input prices back to 2022 levels. Conversely, a scenario in which core PCE average 3.3% y/y in Q4 would imply the following: faster progress on the labor market easing, long-term inflation expectations edging down further, GDP contracting, stronger downward pressures on new rents inflation and PMI input prices below 50.
Goldilocks on BoE: BoE Hikes By 50bp; We Now Expect Another 50bp Hike in August
BOTTOM LINE: The MPC voted by a majority of 7-2 for a 50bp hike at today's meeting, against consensus expectations for a 25bp hike, highlighting significant upside surprises to its May MPR projections on both the inflation and labour market front. The language on the path ahead was kept unchanged, with the MPC reiterating its data-dependent approach as well as its willingness to increase rates further if there were to be evidence of more persistent price pressures. On the outlook ahead, the MPC noted that it continued to expect headline inflation to fall significantly further over the remainder of the year, largely due to developments in energy prices, but services inflation was projected to remain broadly unchanged in the near term. Following today's meeting, we now expect a second 50bp in August (vs 25bp previously) and look for the MPC to finish with a final 25bp hike in September, raising our forecast for the terminal rate to 5.75% (vs 5.5% previously).
Goldilocks on US housing: Existing Home Sales Edge Higher; Imbalance Between Supply and Demand Worsens Slightly
BOTTOM LINE: Existing home sales rose by 0.2% to a seasonally adjusted annualized rate of 4.30 million units in the May report, against consensus expectations for a 0.7% decline. The imbalance between housing supply and demand worsened, with the months’ supply of existing homes available for sale falling further below pre-pandemic levels, and the median sales price increased 0.9% month-over-month (SA by GS). Following this morning’s data, we left our Q2 GDP tracking estimate unchanged at +1.8% (qoq ar).
The Leading Economic Index, a trusted composite of multiple leading indicators, fell for the 14th straight month in May. The LEI may have been early in its warning of a coming recession, but it is consistent with our own forecast, which anticipates an eventual recession early next year.
Yardeni: Leading & Coincident Economic Indicators Are Contradictory
And finally, for those of us who are visual learners, a couple final items. First UP from Bloomberg, a reminder,
Sure enough, the Bank of England boosted the pace of its rate hikes to underscore the likelihood that the world faces a fresh round of tightening, just when many had been expecting policymakers to call a halt. That sharpened the impact of Jerome Powell’s Senate Banking Committee testimony, even though much of what he said simply matched last week’s statement and his press conference after the latest FOMC meeting.
Investors, economists and even US policymakers themselves have persistently underestimated just how high the Fed needs to take borrowing costs in order to bring inflation back down to its 2% target. The Fed sprang a hawkish surprise at this month’s gathering by holding rates but projecting two more hikes by year-end to take the mid-point of its target range to 5.625%, almost 2 percentage points higher than the FOMC and markets expected a year ago.
The relentless march higher is putting plenty of pressure on banks, a sector that wobbled back in March to create concerns that the Fed was about to tip the US into recession. They remain a key point of vulnerability, especially with Powell saying capital requirements will go up.
a look at 2yy — and while some may say this is Seinfeld like chart ‘about nothing’,
US 2y yields: US 2y yields closed above the 4.72% (76.4% Fibonacci resistance) after testing and failing to do so over late last week. We see the next resistance at 4.80% (November 2022 high).
However, we prefer to be neutral on yields, at least till we see more. We have seen double momentum divergence already on slow stochastics (triple momentum divergence is one of our favorite trend exhaustion indicators), while we have struggled to push past resistances over the last week.
Hence, we would like to see a decisive weekly close above the 4.80% level to suggest a continued move higher, with the next significant resistance all the way at 5.08% (2023 high).