(USTs bear STEEPENING o/n on long-end supply - Japan, Australia, Neth, Spain and UK)while WE slept; "If Inflation Is 3.7% And Oil Is Rising, Treasuries Can't Rally"
Good morning … As bank earnings continue crossing the wires …
CNBC: Goldman Sachs tops estimates on stronger-than-expected bond trading CNBC: Bank of America tops profit estimates on better-than-expected interest income
BONDS and rates clearly at epicenter of it all and SO, here’s a look at the belly of the yield curve which has resumed / REMAINED within UPTREND …
… momentum (stochastics / bottom panel RED ARROW) rebounding and suggesting path of least resistance is towards HIGHER RATES and so … over to you, Fed?
Harker (NOT to be confused / conflated with HARKSTER) who IS an FOMC voting member, said overnight
Bloomberg: Fed Should Stop Rate Increases With US Small Businesses Struggling, Harker Says
Philadelphia Fed chief repeats his call to stop raising rates
Bankers concerned firms ‘aren’t going to make it,’ Harker says
… “Small firms are really struggling with access to capital,” Harker said Monday while answering questions after a speech at a virtual event.
“Some of the bankers I’ve talked to are concerned that their business plans just aren’t going to be able to make it at the higher rates. I heard that warning a lot over the summer,” he said.
“This is why we should hold rates steady, we should not at this point be thinking about any increases, because if that’s true — and it is true — then we should let that ride out.”
Sounds to ME (and others) like the Fed is facing some tough choices indeed … MORE BELOW … here is a snapshot OF USTs as of 744a:
… HEREis what this shop says be behind the price action overnight…
… WHILE YOU SLEPT Treasuries have bear steepened (2s30s Tsy curve +3.8bp, see attachments) overnight as global long-end supply weighed overnight (from Japan, Australia, Netherlands, Spain and UK according to ITC). DXY is modestly higher (+0.1%) while front WTI futures are UNCHD. Asian stocks followed NY higher, EU and UK share markets are mixed/lower while ES futures are showing -0.25% here at 6:45am. Our overnight US rates flows were subdued as Tsy prices drifted lower. The desk saw brief selling in the front-end before real$ stepped in to scoop 3yr to 5yr paper. We also saw further interest to steepen 5s30s and 10s30s curves with 10's underperforming (5s10s30s 'fly +1.6bp) on curve this morning. Overnight Treasury volume was ~85% of average…
… Our last attachment looks at an NFIB sub-index: "Actual interest paid on short-term loans by borrowers." Nearing 10%, that borrowing rate must be quite a shock for small businesses who have accounted for the lion's share of US job growth over the years...
… and for some MORE of the news you can use » The Morning Hark - 17 Oct 2023 and IGMs Press Picks (who CONTINUES to be sportin’ that new, fresh look) in effort to to help weed thru the noise (some of which can be found over here at Finviz).
Moving from some of the news to some of THE VIEWS you might be able to use… here’s SOME of what Global Wall St is sayin’ (in a similar sorta way you’ll find content if you pay for ZH PREMIUM? except … they are SELLIN other folks data where as I’m just point it out and links provided — should work IF you have permission and should NOT work if you don’t … HOW can THEY do that?? askin’ for a friend as I never understood how they do it…)
Apollo - Unemployment About to Rise Further (top of a recession’ista wish list?)
The Worker Adjustment and Retraining Notification (WARN) Act gives 60 to 90 days advance notice in cases of plant closings and mass layoffs, and the latest data shows a significant move higher in WARN notices recently, see chart below.
In other words, the WARN data is telling us that more companies are giving advance warnings about plant closings and mass layoffs.
Running a regression using WARN notices to predict unemployment shows that initial jobless claims in October will rise over the coming weeks to a level between 250K and 300K, see chart below.
DB - Dovish arguments are dicier when the data are not cooperating (they call ME Capt Obvious…)
Over recent weeks, several developments have injected uncertainty into the Fed's policy path from both hawkish (strong employment and CPI reports) and dovish (tighter financial conditions, geopolitical events, and fiscal prospects) directions. We make three points related to the Fed policy path in response to these developments. First, the probability of a rate hike in December has risen. Second, if the Fed raises rates again, it is unlikely officials will be confident they have reached the peak. Third, a re-start of the rate hiking cycle in December or Q1 makes a harder landing more likely for the economy.
Wells Fargo - The Fed's Balance Sheet: How Much Further Can QT Run? (further than we think?)
Summary
The FOMC looks to be near, if not already at, the end of its rate hiking cycle. However, policy tightening is likely to continue in the coming months as the Fed shrinks its balance sheet, a process known as "quantitative tightening" (QT).
Since the Fed stopped reinvesting securities on its balance sheet in June of last year, the central bank's assets have shrunk by roughly $1 trillion to $7.9 trillion at present. The lion's share of the reduction has been through lower holdings of Treasury securities (down $841 billion), while mortgage-backed securities (MBS) have fallen by $228 billion. Partially offsetting these declines has been a rise in lending related to the emergency programs created in response to regional bank failures in March.
A reduction in assets must be matched by an equivalent decline in liabilities. The primary channels for shrinking liabilities via QT occur through bank reserves and reverse repurchase agreements. Since QT began, bank reserves have fallen by a scant $17 billion. By far the biggest reduction on the liability side of the Fed's balance sheet has been reverse repurchase agreements (RRPs), which have plunged by $728 billion.
How much longer is QT likely to continue, and how large could the Fed's balance sheet be when it ends? The answer largely boils down to the outlook for the U.S. economy, the stickiness of RRP balances and what the Fed considers an "ample" level of reserves. Below is our base case, predicated on our forecast for the U.S. economy falling into a modest recession in Q2-2024, as well as three non-recession, alternative scenarios.
Macro Forecast Base Case: A recession next year leads the Fed to cease QT at the start of Q3-2024. The Fed's balance sheet levels off around $7.2 trillion.
Non-Recession Alternative Scenarios
Sticky RRP Balances: Overnight reverse repurchase agreements (ON RRP) remain near their current level of about $1 trillion, and as a result bank reserves drain relatively quickly in the coming months. The FOMC slows QT in Q3-2024 and stops it completely at the end of 2024; the Fed's balance sheet recedes to $7 trillion or so.
RRP Back to Pre-Pandemic Level: ON RRP balances shrink back to essentially zero and bank reserves drain more slowly. The FOMC slows QT in Q3-2025 and stops it completely at the end of 2025; the balance sheet declines to about $6 trillion.
RRP Middle-of-the-Road: ON RRP balances decline to about $500 billion, roughly the halfway point between their current level and zero. The FOMC slows QT to start 2025 and stops it completely at the end of Q2-2025; the balance sheet falls to approximately $6.5 trillion.
We see the level of bank reserves as the key driving force in determining the "equilibrium" size of the balance sheet. In light of the 2017-19 QT episode, we assume that reserves of around 8% of GDP is when the balance sheet reaches "equilibrium."
The research literature suggests that the runoff associated with our "middle-of-the-road" scenario is roughly equivalent to a sustained 50 bps increase in the fed funds rate. All else equal, this implies a 50 bps-higher 10-year Treasury yield and adds to a variety of other factors also putting upward pressure on longer-term yields.
… In the long-run, the equilibrium size of the Fed's balance sheet is determined by demand for the Federal Reserve's liabilities, e.g. public demand for paper currency and demand for bank reserves held at the central bank. In its May 2022 statement on plans for reducing the size of its balance sheet, the FOMC stated that "over time, the Committee intends to maintain securities holdings in amounts needed to implement monetary policy efficiently and effectively in its ample reserves regime." This statement suggests that, like the 2017-2019 QT period, the level of reserves is the key driving force of balance sheet projections. Put another way, the FOMC wants bank reserves to be plentiful, but not too plentiful.
…What Are the Implications for Treasury Yields? As we discussed earlier, the FOMC has undertaken QE to stimulate the economy at numerous points over the past 15 years. When the FOMC buys securities during QE, this additional source of demand puts upward pressure on the price of the bonds and downward pressure on their yields, all else equal. QT runoff is passive and does not involve active sales, but the idea is similar: as the central bank reduces its holdings of Treasury securities and MBS, the additional supply of these securities puts upward pressure on intermediate and longer-term yields, all else equal.
Estimating the magnitude of QT's impact on yields is tricky. QT is a relatively new phenomenon, with the only other historical example the 2017-2019 period. This stands in contrast with the FOMC's primary monetary policy tool, the federal funds rate, which has been used as a policy lever for decades. In addition, there are many others tricky factors that must be controlled for in the analysis, such as the role QE/QT play in forward guidance for the federal funds rate.
That said, the research literature suggests that $2.5 trillion of runoff is roughly equivalent to a 50 bps increase in the federal funds rate on a sustained basis.4 In 10-year equivalent terms, the magnitude is similar. In other words, if QT runs until mid-2025 and the Fed's balance sheet declines by about $2.5 trillion from peak to trough, then we would expect the 10-year Treasury yield to be roughly 50 bps higher than it otherwise would be, all else equal.
Estimates vary somewhat depending on the study and assumptions, and the actual impact could be a bit larger or smaller than 50 bps. That said, we think 50 bps is a reasonable base case. Although this effect is not huge, it is important to keep in mind that this period's QT is taking place as a variety of other factors are also putting upward pressure on longer-term yields. As we wrote in a recent report, the federal budget deficit has widened over the past year and is about two percentage points larger today than it was in 2019 (Figure 12). A deluge of Treasury supply from widening deficits and QT is occurring as markets consider the prospects of a "higher for longer" outlook for the federal funds rate and a possible shift higher in "r-star." Against this backdrop, it is perhaps not surprising that medium- to longer-term Treasury yields are as high as they are today (Figure 13).
WisdomTree- Prof. Siegel: Complicated Outlook (complicated BUT stay long stonks)
… With all those risks, the Fed can afford to wait another six weeks before the December 13 meeting before determining whether to increase rates further. I believe there is a good chance there are no more hikes.
Still, though, there is no evidence of a slowdown in the real economy, and this pushes back on when we would get our first cut in rates. Jobless claims again came in at an extremely low level. This week we will get retail sales, which will be important to look at for the month of September. But estimates for third quarter GDP are as high as 4% or more.
Earnings are beginning to trickle in, and reports have been solid. There are no material signs of downgrades for earnings for the year or the quarter—with Pfizer’s after-hours Friday release the outlier thus far is unique to its COVID vaccines.
I like stocks at the present time—with earnings of just under $250 for the S&P 500. This giving us just under an 18x earnings per share valued market. I think that is a favorable multiple for the market. I believe stocks are great long-term inflation hedges if you are still worried about inflationary risks. I think stocks can handle another quarter point rise by the Fed if they deem it necessary.
Small cap stocks have definitely been hit on a relative basis, and a lot of that is based on recessionary fears and the higher borrowing costs that small caps must pay over large caps and the higher proportion of indexes in small cap banks. The Friday reports for the large banks showed healthy profit levels and we’ll see if the small cap banks can show similar results.
I think we're poised for a year-end rally in equities and a good year for 2024.
… And from Global Wall Street inbox TO the WWW,
All Star Charts - Happy Anniversary Bull Market (much happier than Flash Crash-A-Verssary)
How come so many investors get mad that an index, which was designed to buy more of the best stocks and less or none of the worst stocks, owns more of the best stocks and less or none of the worst stocks?
The S&P500 is up over 21% since the October low last year. In fact, last week marked the 1 year anniversary of this bull market.
Meanwhile, the Nasdaq100 is up 40% over the past 12 months (because it’s a bear market?)
During this time, Technology is up 46%, Communications is up 42% and Industrials are up 22% – representing the 3 best performing groups of stocks.
Meanwhile, the worst performers are Utilities, Consumer Staples and Real Estate.
… The S&P500 is designed to own more of the best stocks and very little or none of the worst stocks.
And it’s doing its job really well isn’t?
Not according to some….
In my opinion, the sad investors are the ones stuck in the wrong stocks. If you’ve been long the strongest names, like the S&P500 has, for example, then you have little to complain about.
But here is an index that represents the median stock, closing last week at the lowest levels in a year.
If you want to be a subpar investor, then own the median stock.
It’s simple.
The median stock, according to the Value Line Geometric Index, has made zero progress in 25 years.
So if you’re focused on the median stock, then of course you think it’s a bear market.
But when you understand how the best strategies own more of the best stocks and little or none of the worst stocks, you’ll quickly see how this is just a perfectly normal bull market.
Is it one of the strongest Year 1s of a bull market? No, it’s actually one of the worst Year 1s on record. But a weaker bull market doesn’t necessarily make it a bear market.
Also, I encourage you to go back and look. There’s no evidence that a weaker Year 1 of a bull has any impact on the performance of Year 2.
So at this point, it doesn’t even matter…
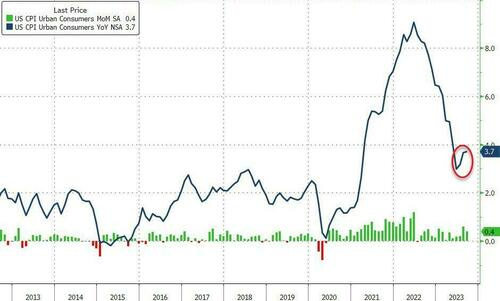
Bloomberg (via ZH) - If Inflation Is 3.7% And Oil Is Rising, Treasuries Can't Rally (and they say common sense ain’t so common)
By Ven Ram, Bloomberg Markets Live reporter and strategist
Treasuries at the back end of the curve may find it hard to keep extending their rally from last week as the Federal Reserve pushes into the last lap toward its inflation target.
For four months now, the US economy has seen successive readings in which headline inflation has been 3%-something, with the last two creeping up toward 4%.
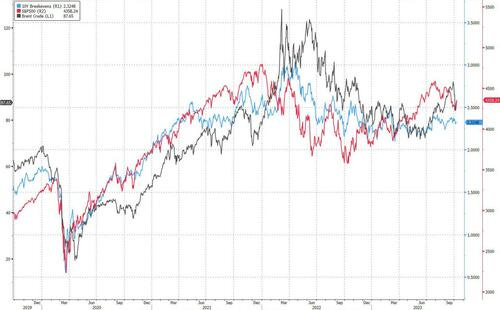
And with Brent crude nudging past $90 a barrel again and threatening to spiral away on the back of tensions in the Middle East, the risk to inflation is clearly on the upside.
Federal Reserve Chair Jerome Powell takes the floor of the Economic Club of New York this week, and he would probably say rates in the US are restrictive enough and that the central bank will wait for its cumulative rate increases so far in this cycle to funnel through to the economy even as policymakers are willing to do more if needed to quell inflation.
By all measures, the Fed’s most ambitious policy tightening in decades, you would think, ought to have been felt by now in the real economy. After all, the Fed can boast of a ex-ante real policy rate of 290 basis points, which by almost any yardstick represents a sharply restrictive regime. Yet, the labor market is still tight and the jobless rate is around levels where the news is as good as it gets.
One key reason: if the economy is going to be resilient and if artificial intelligence is going to spur growth in productivity, the neutral rate — the rate that doesn’t stoke inflation while keeping the labor market steady — may be tipped higher. Quite tellingly, expectations about price pressures as represented by forward inflation swaps haven’t moved an iota lower since the Fed started raising rates.
Which is why the dash toward duration hasn’t paid off yet. In a world where inflation is 3.7% and biased upward perhaps, it’s not too hard to envisage a 10-year yield around 4.7%. That is indeed far grimmer than it appeared just a few months ago.
Authored by Simon White, Bloomberg macro strategist,
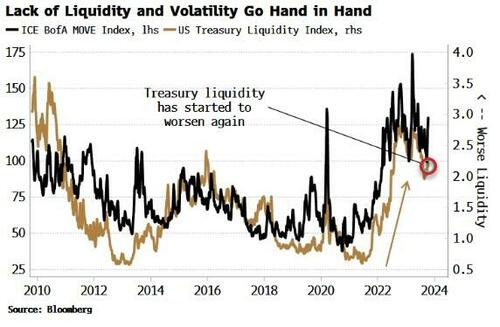
Poor liquidity in the Treasury market is contributing to a rise in implied and realized fixed-income volatility. A re-increase in inflation volatility means this dynamic is likely to persist.
Despite being one of the deepest markets in the world, the market for Treasuries has seen liquidity deteriorate in the years since the pandemic. On several measures – bid/offer spread, order-book depth, price impact of a trade – the Treasury market has shown marked signs of a decline in liquidity in recent years.
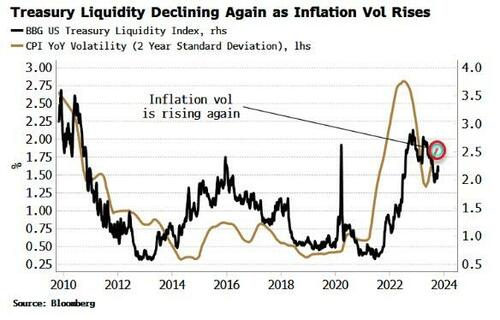
Bloomberg’s US Treasury Liquidity Index measures liquidity by comparing where yields are to where they “should” be based off a fitted curve. The greater the average of the yield errors across the curve, the worse liquidity is likely to be.
As the chart below shows, the Liquidity Index infers liquidity has markedly weakened over the last two years, and after showing an improvement over the last six months, it has started to worsen again.
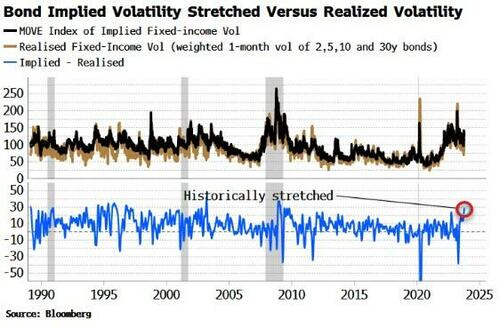
Fixed-income volatility, using the MOVE index, intuitively rises and falls as liquidity worsens and improves respectively.
Bond volatility has been notably higher in this cycle than other assets’ volatility, such as equities and FX. Indeed, the recent rise in the MOVE index, i.e. implied volatility, has taken it to a level above realized volatility it has rarely exceeded in the last 30-plus years.
The immediate catalyst for the rise in bond volatility has been the Federal Reserve’s rate-hiking cycle. But this was itself triggered by the rise in inflation. It is the inherent increase in uncertainty that goes with elevated inflation that is the ultimate source of rising volatility.
Higher inflation volatility goes hand in hand with higher market volatility, especially in rates and fixed-income markets. Inflation is very likely to be persistent, and soon to begin re-accelerating. Inflation volatility has moderated somewhat from its recent highs, but is picking up again.
As long as inflation volatility remains elevated, bond vol will remain likewise. This is even more so the case as the yield curve continues to rise, with steeper curves an inherent source of yield volatility.
Rumor has it that AI is not nearly as great or accurate as it's cracked up to be. Rumor also has it that we humans really haven't invented much since the Gilded Age. But those times were so BACKWARD, I mean OMG, they used Gold, Silver, and Copper coins. So uncivilized!


Rumor has it that AI is not nearly as great or accurate as it's cracked up to be. Rumor also has it that we humans really haven't invented much since the Gilded Age. But those times were so BACKWARD, I mean OMG, they used Gold, Silver, and Copper coins. So uncivilized!
Great, great article!!!
I agree with Harker and I agree
with your thoughts on 2024.
I hope Prof Siegel is right.
I did see a video of him explaining
that Bonds hedge many things well, but don't hedge inflation well.
Old School PMs are learning this the hard way.
Stocks or companies do have the
ability to change prices of their products, reshuffle their workforces, etc and that makes
them more adaptable to the peril
of Inflation, in the long run.
I found it interesting that Best Case
the Fed Balance Sheet will be 6T.
That is still quite a bit higher than
Per-Pandemic??? Of maybe 4T.
And that QT is worth about 50bps.
Reading your articles is like reading
Wall Street PHD paper..
It's really amazing information !!!