(USTs are 'quietly bull steepening' on light volumes)while WE slept; Gundlach WARNS, a Volcker like tightening, global trade SLOWS, rate CUTS 'round the corner...
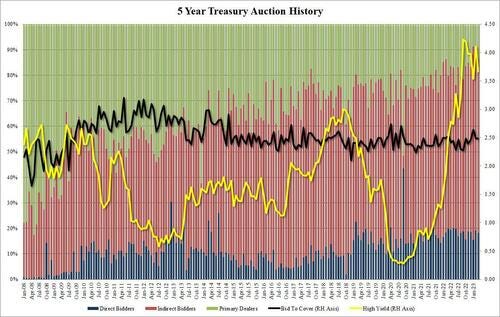
… The bid to cover of 2.48 was unchanged from last month and was just above the six-auction average of 2.45.
The internals were also solid, with Indirects awarded 68.5%, below last month's 70.0% but above the recent average of 67.3%; and with Directs taking down 18.2%, also above the 17.7% average, means Dealers were left holding 13.3%, the most since December if below the recent average of 15.0%.
The market reaction to the strong auction was modest, with the 10Y dipping from session highs of 3.57% to 3.55%.
7s up next … show of hands who’s IN? See what you want to see here,
… here is a snapshot OF USTs as of 705a:
… HEREis what another shop says be behind the price action overnight…
… WHILE YOU SLEPT Treasuries are quietly bull-steepening on 60% (30d) volumes, fading an early flattening push in Tokyo (2x ~120k/01 TU-UXY flattener) into fiscal year-end and a downside miss in AUS CPI (6.8%YoY vs. 7.2% exp). EGBs are underperforming, nearly flat across the curve, the ECB’s Kazimir (‘hikes should persist, but maybe at slower pace’) and Lane (‘more hikes needed’) having offsetting impacts in early trade. Little US news was on offer as we head into month-end, though equity futures are ebullient (SPX futures +35pts at 7am) and Commodities are higher as well (CL +1.3%). US real rates are leading the nominal decline, and 2s10s curve is +2.25bps steeper. Flows overnight were generally muted, RM buyers seen dip buying in intermediates around the Tokyo morning lows.
… and for some MORE of the news you can use » IGMs Press Picks for today (29 MAR) to help weed thru the noise (some of which can be found over here at Finviz).
From some of the news to some VIEWS you might be able to use. Global Wall St SAYS:
“The economic headwinds are building, we’ve been talking about this for a while, and I think the recession is here in a few months,” Gundlach said Monday during an interview with CNBC.
“All we really need is the unemployment rate to go higher.”
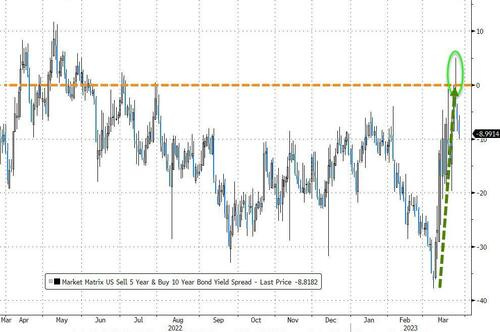
In fact, the 5s10s spread actually uninverted last week...
… More directly, he warned that if the Fed raises rates again in May, the difference “between what you can get on T-bills and what you can get in the banking system will grow.”
He warned that such a scenario would “counter-productively cause great shrinkage of liquidity in the banking system, maybe some more problems with unrealized losses,” he said.
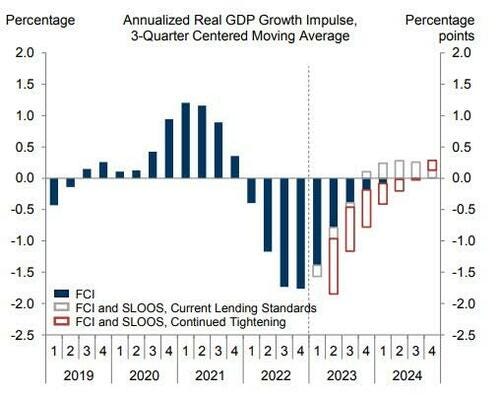
As Goldman notes, further monetary policy tightening combined with the contraction of the credit impulse from banks themselves will have a more serious drag on real GDP growth...
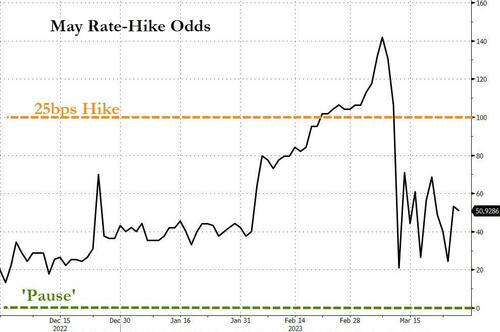
And there’s more … Moving along and setting the bond king commentary aside, here’s an update from a large German operation asking / answering how much Fed policy restraint is being priced? Think a MILD tightening cycle,
Has the repricing in Fed policy gone too fast or perhaps too far? We offer perspective from historical hiking cycles. Using the level of the real fed funds rate minus r* as a measure of restraint, the market is currently pricing a mild tightening cycle. But when judged based on the change in this measure of the policy stance, the current cycle is comparable to Volcker.
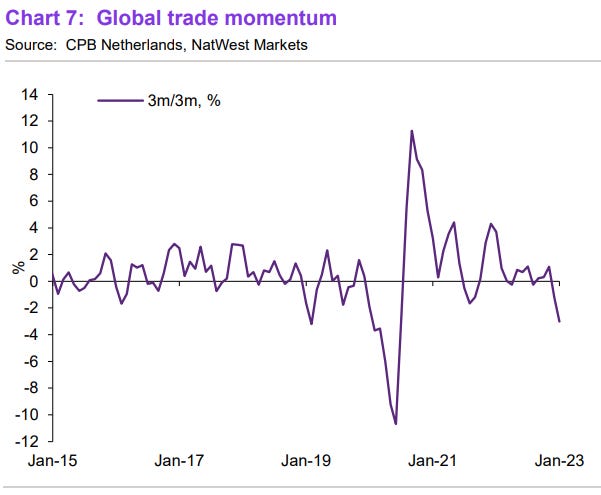
So this ‘mild’ Volcker - like tightening cycle (?) will have an impact on GLOBAL supply and demand … evidence THIS NEXT REPORT from a somewhat well known UK brand,
Global trade eased further at the start of 2023 with forward-looking indicators signalling anaemic growth in Q1. World trade volumes contracted by 0.1% m/m in January, following a decline of 2.8% in December – the fourth consecutive monthly decline. With evidence of an ongoing easing of supply-side frictions (e.g., shortening delivery times, falling shipment costs), the slowdown in trade would appear to be primarily a reflection of waning global demand. The latest data suggest the expected boost to global trade from Chinese reopening has not materialised, at least yet. Forward-looking surveys, official data, and real-time shipping data signal global trade growth remained subdued in Q1. We project global trade volumes to decline to -2% q/q in Q1 2023 from -1.2% in Q4, based on the latest data.
Slower demand COULD then be offered out to us all as a RECESSION … Bloomberg,
ZH: Fed's First Rate Cut May Be Right Around The Corner
The labor market, the yield curve, inflation and a stock-market selloff are poised to force the Federal Reserve into a rate cut sooner than the market is currently pricing.
In markets, it pays to remember that things take longer to happen than you think they will, and then they happen much faster than you thought they ever could. It was only two weeks ago that the market was expecting up to another four rate hikes. Now it’s effectively pricing the end of the rate-hike cycle, and the first cut by the end of the third quarter.
But there are several reasons why there could be another abrupt alteration in the state-of-play, with the first cut coming as early as June, and potentially significant cuts priced in before the end of the year:
Signs of deterioration in the job market that gain momentum very quickly;
A recession that now looks unavoidable and could begin as early as June;
Inflation that is long past its cycle peak; and
A rapid fall in velocity leading to a stock-market selloff
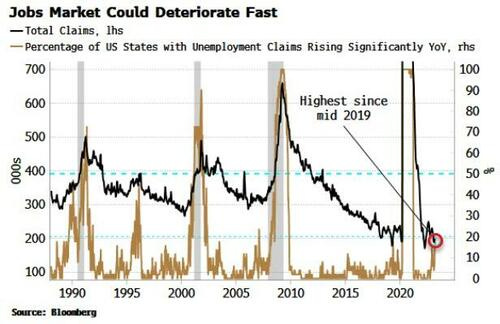
One of the surprising aspects of this cycle has been the resilience in the labor market. But that looks about to change. Unemployment claims are one of the most leading measures of the job market. The headline number has remained low, but the real information content comes from looking under the surface.
The chart below shows that almost a fifth of US states are seeing claims rise more than 25% on an annual basis. This is at a level that is often preceded by a further rapid deterioration and a jump higher in the nationwide number, which has in most cases culminated in a recession.
Moreover WARN notices are rising sharply. These must be filled in by employers 60 to 90 days ahead of plant closings and mass lay-offs, and lead unemployment claims.
Not only does a recession look unavoidable, it could happen as soon as the summer. Yield-curve inversions tell you a recession is on the way at some point, but a more imminent sign is when the curve steepens.
The part of the curve that typically starts steepening first is the 3-month/30-year segment This began to steepen in early February, and has kept steepening apart from a brief spasm in the wake of SVB. This is historically consistent with a recession beginning as soon as June, and would match the raft of leading indicators that are anticipating a slump.
The Fed typically starts cutting rates 2-3 months before the recession starts, and 6-8 weeks after the 3m-30y curve begins steepening. If the curve bottomed two weeks ago, that’s consistent with the first cut as early as May.
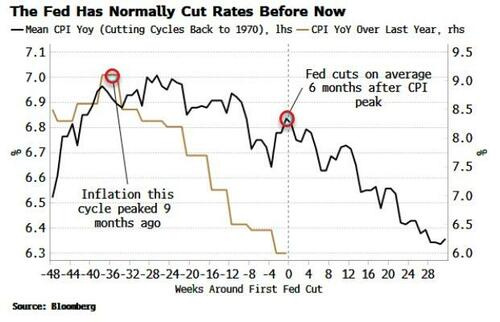
Would inflation stop the Fed cutting, even if the jobs market were markedly worsening and a recession looked imminent? Historically speaking, no. On average, the Fed starts cutting rates six months after CPI peaks. Inflation, in this cycle, peaked nine months ago, and has since fallen by a third.
To be sure, there are still plenty of worrying aspects to inflation, from elevated profit margins, to sticky core measures. But the Fed is adept at moving the goal posts when it needs to, and – barring a rapid re-acceleration – inflation is unlikely to be enough on its own to hold the central bank back from easing if it needs to.
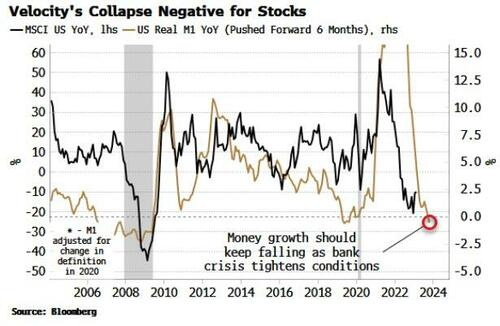
Nevertheless, the elephant in the room is the stock market. With the S&P still hovering around 4,000 the Fed is unlikely to cut. But the banking crisis is leading to a sharp tightening in financial conditions. Don’t be fooled by the recent expansion of the Fed’s balance sheet, velocity is being sucked out of the system rapidly.
Stocks are highly exposed to this fall. As data last week confirmed, deposits are leaving the banking system, and from there heading to higher-yielding money market funds and thus the RRP, where their velocity is effectively zeroed. The fall in deposits is likely to lead to an even bigger contraction in real money growth, precipitating another drop in equities.
This would solve the Fed’s financial conditions dilemma, in that it will not ease until these tighten. The dirty little secret about FCIs (financial conditions indexes) is that they are highly correlated to equities. If stocks are soon a lot lower after a velocity-induced selloff, there will be little to stop the Fed cutting rates, perhaps by a lot, when the economy is showing marked signs of distress.
Cutting rates would also, at a stroke, improve the solvency of the regional-bank sector, the focal point of the current crisis. Estimates are that the US banking sector overall is harboring losses of $2 trillion in hold-to-maturity portfolios, which would rapidly diminish as rates fell, as well as reducing the need (for now) of more Fed lending programs.
The market does not currently see the first full cut priced until September, but it could come much more abruptly than you think. Another rate hike looks like a distant possibility - the Fed would gain little when the front of the curve is now so inverted - leaving July and August Fed Funds futures with excellent risk-reward.
AND … rate CUTS (or hikes … whatever your model suggests) in mind, lets take a look at some more PICTURES.
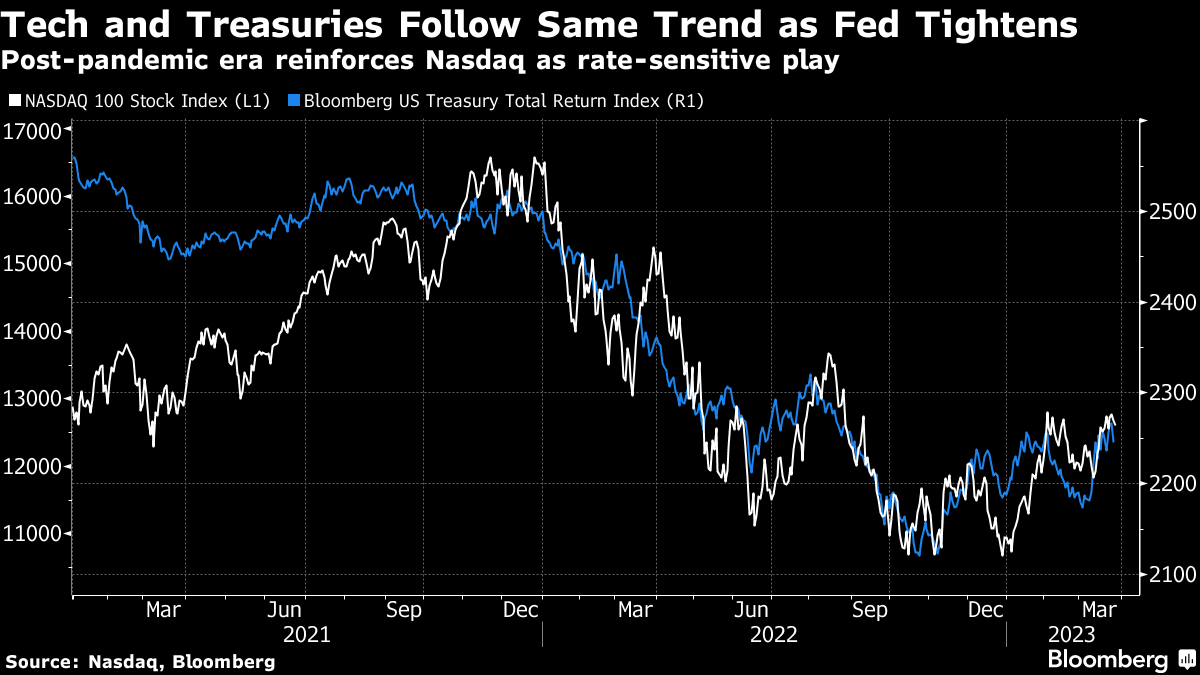
For the faction out there who are visual learners, a couple / few charts which may be of interest. First up is one from Bloomberg — as goes TECH so goes UST returns
…The Federal Reserve’s tightening cycle has made a couple of rather strange bedfellows out of technology shares and Treasuries. While you might think the two would have wildly different fundamental drivers — a strong economy, for example, should hurt bonds but help tech — investors are apparently convinced that there is one key dynamic that binds them. That’s yields: When they go up both Treasuries and the Nasdaq 100 go down.
That could be at least partly because yields are arguably still extremely low — both on a historical basis and when compared against current inflation. There’s also the fact that the US economy is still showing plenty of health, which means plenty of incentive for investors to bet on share gains as long as yields don’t jump higher. It does make it all much harder for anyone seeking diversification, when the Fed’s large footprint is making otherwise disparate asset classes align.
AND from a shop which has mercifully been OUT of the news (at least for a cycle or two), since it was handed to it’s only peer just cross the street,
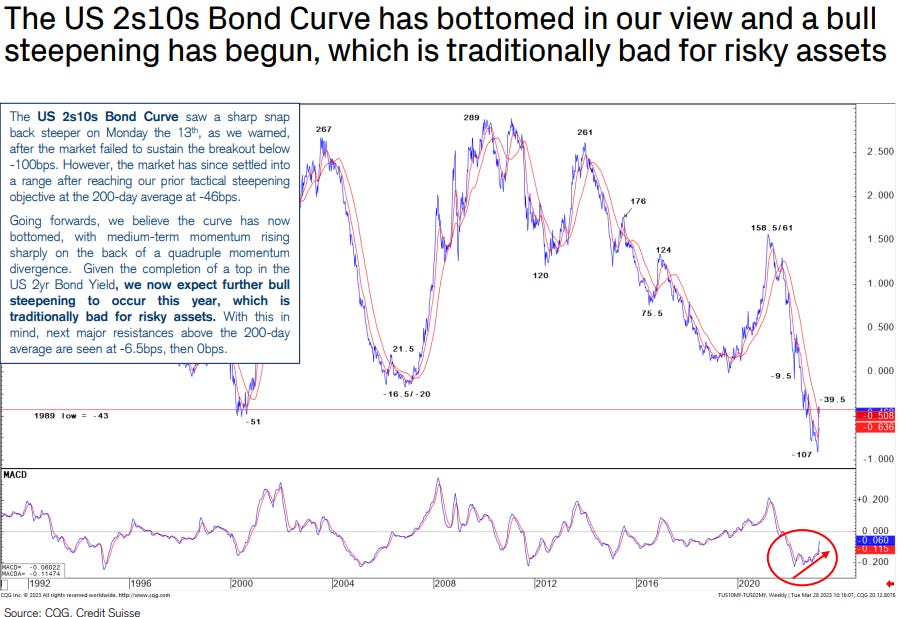
Following the recent turmoil in the banking sector, Credit Suisse’s Global Risk Appetite measure has turned lower and completed a weekly MACD crossover signal, which points to a further deterioration in risk appetite from here. We believe this is most likely to be driven by further equity underperformance vs bonds.…
Elsewhere, US Bond Yields are still trapped in a range at the longer-end of the curve, however we maintain our 3.00% core objective for the US 10yr Bond Yield, whilst the US 2yr Bond Yield has already confirmed a major top, suggesting further bull steepening of the curve is likely, which is a further negative for the equity market in our view.
Finally, a couple notes for our inner stock jockey … 1st from a large FRENCH bank,
Comparative calm: This week has started with more of a risk-on feel – vol lower, cyclicals higher. Index level moves though have been tempered by the negative correlation between Tech and the rest of the equity market. NDX and large cap Tech are trading like safe haven counter-cyclical assets and depressing the close-to-close moves on the SPX. Despite the turmoil in US Banks, we have still not seen a >2% down day for the SPX YTD. We are skeptical as to whether that dynamic will persist as we enter a more recessionary stage of the cycle. We highlighted our preferred index hedges and Quality RV trades in Buy now, pay later. In the short term, investors who believe we could instead enter a period of comparative calm may consider short vol trades that have an asymmetric profile and are not short tail risk. Whilst Tech and Cyclicals remain bifurcated, we could see the market remain in a range, albeit a choppy one.
Asymmetric short volatility trades: As a trading range, 4200/3800 are the YTD SPX high/low, respectively. At 4200, the market would be trading on a >20x P/E (vs. BNPP’s 2023 EPS estimate). We do see more potential for a break below 3800. However, it could continue to act as a support level in the short term, as it did when the market made lows at or just below 3800 in December of last year, and again this past month…
OR, if you prefer (and I do),
AND the latest process of thought from Marko K of JPM,
Our view remains that Q1 will likely mark the high point for equities this year; we prefer low beta and are increasingly cautious on Cyclicals/ Banks/Value. We view the most vulnerable areas as unprofitable companies that depend on steady flow of equity capital to fund operations and tight carry trades implemented over the last 10-20 years (CRE, shadow banking, levered buyouts, subprime ABS & consumer loans, short-term rentals, etc.). In particular, CRE stresses appear to be compounding, amplified by banking shocks that could complicate their debt roll. Several geopolitical crises are building, with the war in E.Europe ongoing and political unrest in Europe and the Middle East. Bond yields whipsawed amid macro data and ongoing banking sector concerns, amplified by very poor liquidity conditions. We stay neutral duration in the US and Europe, preferring 10s/30s steepeners. In the UK, we see two further 25bp hikes with a risk of an earlier pause, so we keep 5s/30s SONIA curve steepeners as a late cycle bullish proxy. The damage due to AT1s on the broader asset class could be relatively contained and potentially just be focused on Swiss AT1 issuers. Even so, in Europe we remain cautious on credit markets, recommending that investors avoid ‘buying the dip’, as we think the shakeout in markets has further to run. Banking stress shouldn’t be viewed as uniformly USD bearish; weakness should be concentrated vs. other reserves like gold, JPY, CHF
… With the banking crisis lingering, higher uncertainty justifies a defensive stance: 1) higher uncertainty should put upward pressure on risk premia embedded in asset prices and increase the need for precautionary savings among investors, and 2) economic forecasts have a long way to downshift to catch up with markets …
… Market participants are facing a similarly high level of uncertainty as suggested by the high level of the volatility implied from interest rate option prices. The MOVE index has subsided to some extent over the past week but it remains disturbingly elevated (Figure 8) MOVE index bas on the implied volatily f1MTreasuy options).
And the banking crisis is far from over. While the latest H4.1 release by the Fed showed a sharp reduction in the pace of borrowing by US banks from the Fed’s loan facilities, banks appear to be still losing deposits to Money Market Funds. Indeed Money Market Fund assets expended by another $120bn on the week ending March 22nd (Figure 9) US Moneyarkt FundAset and the Fed’s latest rate hike would likely make it even more difficult for US banks to compete with the close to 5% yield offered by Money Market Funds.
Throwing caution to the wind, you say, because, you know .. rate CUTS are still priced and so, may just be ‘round the corner?
ZH: Fed's First Rate Cut May Be Right Around The Corner
The labor market, the yield curve, inflation and a stock-market selloff are poised to force the
Federal Reserve
into a rate cut sooner than the market is currently pricing.
In markets, it pays to remember that things take longer to happen than you think they will, and then they happen much faster than you thought they ever could. It was only two weeks ago that the market was expecting up to another four rate hikes. Now it’s effectively pricing the end of the rate-hike cycle, and the first cut by the end of the third quarter.
But there are several reasons why there could be another abrupt alteration in the state-of-play, with the first cut coming as early as June, and potentially significant cuts priced in before the end of the year:
Signs of deterioration in the job market that gain momentum very quickly;
A recession that now looks unavoidable and could begin as early as June;
Inflation that is long past its cycle peak; and
A rapid fall in velocity leading to a stock-market selloff
One of the surprising aspects of this cycle has been the resilience in the labor market. But that looks about to change. Unemployment claims are one of the most leading measures of the job market. The headline number has remained low, but the real information content comes from looking under the surface.
The chart below shows that almost a fifth of US states are seeing claims rise more than 25% on an annual basis. This is at a level that is often preceded by a further rapid deterioration and a jump higher in the nationwide number, which has in most cases culminated in a recession.
Moreover WARN notices are rising sharply. These must be filled in by employers 60 to 90 days ahead of plant closings and mass lay-offs, and lead unemployment claims.
Not only does a recession look unavoidable, it could happen as soon as the summer. Yield-curve inversions tell you a recession is on the way at some point, but a more imminent sign is when the curve steepens.
The part of the curve that typically starts steepening first is the 3-month/30-year segment This began to steepen in early February, and has kept steepening apart from a brief spasm in the wake of SVB. This is historically consistent with a recession beginning as soon as June, and would match the raft of leading indicators that are anticipating a slump.
The Fed typically starts cutting rates 2-3 months before the recession starts, and 6-8 weeks after the 3m-30y curve begins steepening. If the curve bottomed two weeks ago, that’s consistent with the first cut as early as May.
Would inflation stop the Fed cutting, even if the jobs market were markedly worsening and a recession looked imminent? Historically speaking, no. On average, the Fed starts cutting rates six months after CPI peaks. Inflation, in this cycle, peaked nine months ago, and has since fallen by a third.
To be sure, there are still plenty of worrying aspects to inflation, from elevated profit margins, to sticky core measures. But the Fed is adept at moving the goal posts when it needs to, and – barring a rapid re-acceleration – inflation is unlikely to be enough on its own to hold the central bank back from easing if it needs to.
Nevertheless, the elephant in the room is the stock market. With the S&P still hovering around 4,000 the Fed is unlikely to cut. But the banking crisis is leading to a sharp tightening in financial conditions. Don’t be fooled by the recent expansion of the Fed’s balance sheet, velocity is being sucked out of the system rapidly.
Stocks are highly exposed to this fall. As data last week confirmed, deposits are leaving the banking system, and from there heading to higher-yielding money market funds and thus the RRP, where their velocity is effectively zeroed. The fall in deposits is likely to lead to an even bigger contraction in real money growth, precipitating another drop in equities.
This would solve the Fed’s financial conditions dilemma, in that it will not ease until these tighten. The dirty little secret about FCIs (financial conditions indexes) is that they are highly correlated to equities. If stocks are soon a lot lower after a velocity-induced selloff, there will be little to stop the Fed cutting rates, perhaps by a lot, when the economy is showing marked signs of distress.
Cutting rates would also, at a stroke, improve the solvency of the regional-bank sector, the focal point of the current crisis. Estimates are that the US banking sector overall is harboring losses of $2 trillion in hold-to-maturity portfolios, which would rapidly diminish as rates fell, as well as reducing the need (for now) of more Fed lending programs.
The market does not currently see the first full cut priced until September, but it could come much more abruptly than you think. Another rate hike looks like a distant possibility - the Fed would gain little when the front of the curve is now so inverted - leaving July and August Fed Funds futures with excellent risk-reward.