(USTs are 'MODESTLY higher' and 'modestly' flatter on above avg volumes)while WE slept; CPI recaps / victory laps; Fed model; sched update
Good morning … please note ‘housekeeping’ at the end of today’s note …
Overnight, a couple things to note,
China CPI rose at the slowest pace in more than two years and factory gate prices fell further into deflation territory, CPI rose 0.1% yoy vs f/c 0.4%, PPI fell 3.6% yoy vs f/c -3.2%.
China’s central bank asked commercial lenders to cap some deposit rates in a push to support a bumpy economic recovery.
As far as yesterday afternoons auction, well … oops? The bid in bonds robbing market participants of any concession ahead of time and, well,
ZH: 10Y Auction Sees Solid Buyside Demand Despite Modest Tail
There is always today’s 30yr reFUNding auction to get score back up to 2 outta 3 which ain’t bad? And speaking of BAD — I call this next work of art, Long Bond TRIANGULATION … (ain’t no banana taped to a wall BUT also doesn’t run risk of being ruined easily … )
Observations — a FLAT, nondescript 50dMA (3.728) as yields kiss topside of triangular pattern as well as a recent bullish cross in momentum … In other words, RANGEZILLA lives … here is a snapshot OF USTs as of 705a:
… HERE is what this shop says be behind the price action overnight…
… WHILE YOU SLEPT
Treasuries are modestly higher while the curve is modestly flatter as investors weigh China's weak CPI/PPI data against the just announced BOE hike and upward GDP revision (UK Gilts have held their early gains so far). DXY is higher (+0.4%) while front WTI futures are little changed. Asian stocks were mixed and little changed on balance, EU and UK share markets are modestly higher while ES futures are showing +0.15% here at 7am. Our overnight US rates flows saw long-end receiving that helped to flatten the curve along with interest to buy P's that was countered by some fast$ selling in 10's during London's AM hours. The desk also reported healthy demand for T-Bills, as has been the case for some weeks now. Overnight Treasury volume was decent at ~145% of average overall with 7yrs (220%) seeing some relatively elevated turnover among benchmarks this morning.… Our first attachment looks at the dis-aggregated, monthly MOF data on Japan's foreign bond purchases with this particular time series showing US Treasury outbound flow. The data has just been updated through March and their fiscal year-end and it shows a notable surge in Treasury purchases as rates rose early that month before banking news dominated the middle and second half of it. There is a link above that suggests that Japan's lifers are planning more JGB purchases at the expense on UST's during the coming year, but there is little evidence of such flow at this early stage of their FY.
… and for some MORE of the news you can use » IGMs Press Picks for today (11 MAY) to help weed thru the noise (some of which can be found over here at Finviz).
From some of the news to some of THE VIEWS you might be able to use… here’s what Global Wall St is sayin’ …
I’ll begin with victory laps and I TOLD YOU SO as Global Wall St celebrates a declining SUPER CORE which effectively putting paid (in their minds and notes) TO a Fed PIVOT …
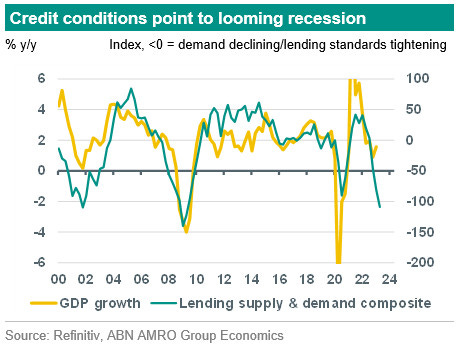
ABNAmro: US inflation stays firm, even as recessionary forces build
Barcap: April CPI: Goods versus services … While the slowing in the “supercore” measures of CPI is welcome news, much of this materialized in typically volatile categories, and smoothing through the monthly data shows more room for progress. In addition, the broader data on wages have yet to show signs of sustained deceleration. We maintain our call for a pause in the June meeting, with a tightening bias.
BMO: CPI +4.9% YoY, Super Core Decelerates, UST Bull Steepen
DB: April CPI recap: Progress measured in inches
First Trust: The Consumer Price Index (CPI) Rose 0.4% in April … However – as is often the case – that surge in inflation last year was followed by a lull, with inflation barely budging in July and August 2022. That means we are very likely to see the twelve-month inflation readings re-accelerate toward the end of the summer. Hopefully Powell and Co. look beyond short-term volatility in the data and realize the fight is not finished…
GS: Core CPI Rises 0.41% on Pop in Used Car Prices
ING: US inflation continues to run too hot, but there are glimmers of hope
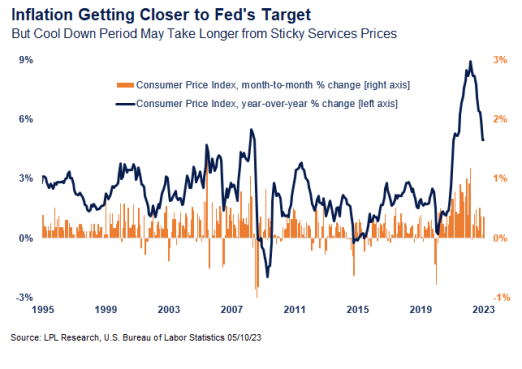
Jefferies: Apr CPI +0.4%, Core +0.4%... Finally the First Signs of ReliefLPL: Inflation with a 4 Handle
MS: The consumer price index (CPI) for April came in line with our expectations, with softening in the services subcomponents. Core CPI came in at 0.41% on the month (MSe 0.38%, consensus 0.4%), while headline came in at 0.37% on the month (MSe at 0.46%, consensus 0.4%). On a YoY basis, headline inflation came down to 4.9%, while core inflation came in at 5.5%YoY, down from 5.6% in March….A slight increase in core inflation with significant deceleration on coreservices should encourage the Fed to keep the door open for a June hike. Shelter inflation still has to show more signs of turning decisively.We continue to see the data and financial conditions firmly supporting a pause in June.
WFC: April CPI: No Major Surprises
Not Global Wall St, per se BUT an OFFICIAL gauge / recap via the NY Fed
FRBNY: Underlying Inflation Gauge (UIG)
For MORE (and snark)
ZH: Wall Street Reacts To Today's "Cooler Than Expected" CPI Report: "Supports A June Pause"
... the fact that we got the first sub-5% headline Y/Y print, the lowest in two years...
MY reaction is ‘getting closer' to target (LPL) … well, we’ve got different definitions of ‘CLOSER’ … in any case, Global Wall Streets CPI VIEWS and victory laps aside, there’s also a few other items from the intertubes to share and consider.
Calculated Risk blog,
BLS: CPI increased 0.4% in April; Core CPI increased 0.4%
YoY Measures of Inflation: Services, Goods and Shelter
ZeroHEDGE with some details and mkt reflex
ZH: Headline CPI Dips To 2-Year Low; Shelter Costs Roll Over
ZH: CPI Slip Sparks Panic Bid In Stocks, Bonds, Gold, & Crypto; Dollar Dumps
AND via BBG,
ZH: Early Fed Cut Stays On Table As China's Stall Keeps Lid On CPI
Authored by Simon White, Bloomberg macro strategist,China’s faltering recovery implies US CPI’s downwards trend is unlikely to reverse soon enough to prevent the Fed from cutting rates early.
We’re coming to the crunch point.
We’ll find out how immovable the Fed’s “higher-for-longer” aim for rates is when up against what is often the unstoppable force of the market, which has been consistently reluctant to price in the “longer” part of the Fed’s policy wish.
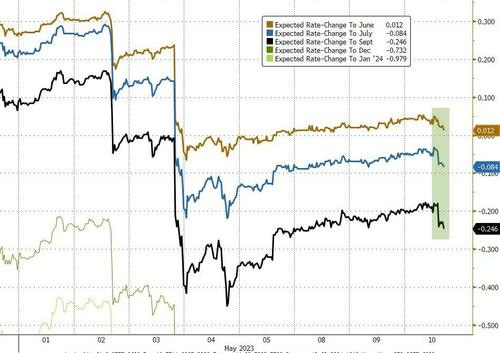
September is now pricing a full 25bps rate-cut (and June rate-hike odds have plunged from 20% to less than 5% this morning)...
Yet now that the Fed is quite possibly done hiking, and the economic lesions from tight monetary policy are beginning to appear, the duel between the central bank and the market will soon be forced to a conclusion.
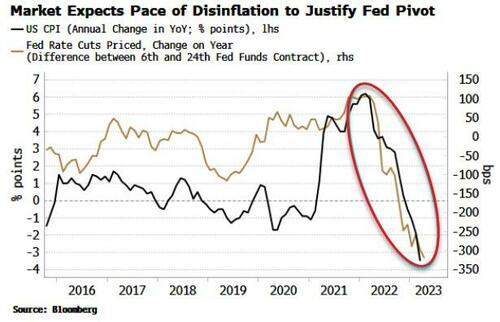
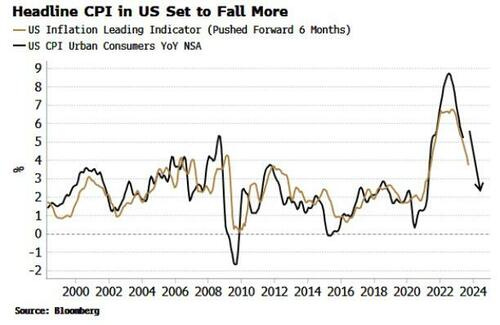
What would give the Fed cover to keep rates steady is a re-acceleration in inflation. It is the deceleration in inflation (it’s ok to dabble in third derivatives sometimes) that has guided the market’s pricing of a Fed pivot.
The pace of inflation’s fall has not let up and continues to give backing to the market’s belief this will be enough to allow the Fed to reverse course.
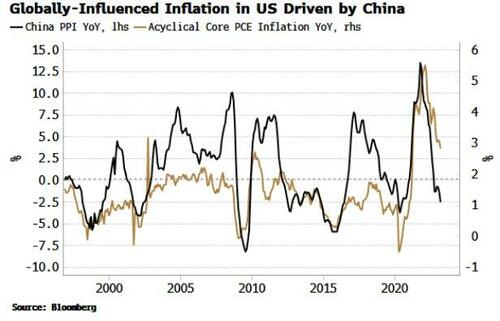
Headline inflation has fallen as energy and food prices have eased. But core inflation has been more stubborn. We can split core PCE up into cyclical and acyclical components. Cyclical inflation is more influenced directly by Fed policy, while acyclical is primarily guided by non-domestic factors. Cyclical inflation has barely budged from its highs, while almost all of core PCE’s fall has been driven by acyclical factors.
Indeed what we find is, given its size and influence on global prices, acyclical inflation is heavily driven by China.
And it’s because of China that the market might finally be the victor on where rates go next. While the country turned a corner at the beginning of this year, its recovery continues to stutter.
This means it is less likely to give any notable support to global prices – and therefore US acyclical inflation – in the coming months.
On the other hand, the reasons why the Fed may be forced to cut as soon as September, when the market expects – recession, credit tightening, debt ceiling – are mounting.
With no China to significantly upset the inflation apple cart, the weakening US inflation outlook inferred from the leading indicator in the chart above is likely to be realized, allowing the Fed the cover it needs to give the market what it’s been hankering after all along.
… this all remains to be seen BUT such is life and so I move along…
In other news (ZH count?) where free markets are becoming incrementally less so,
ZH: Feds Probe Bank 'Short-Sellers' As UAE Sovereign Fund Builds Massive US Stock Short Position
Back TO Global Wall St inbox where, on heels of last nights Trump Town Hall (putting CNN back on the map), a discussion of DEFAULT leads to the question asked / answered by a large German operation,
How could the US debt ceiling impact credit?
Midway through Q2, we are comfortable with our current view for USD IG to drift slightly wider and close near 150bps by quarter-end, with HY widening more moderately to 540bps. Spread movements in Q2 should largely be the reverse of changes in Treasury yields, with a more modest impact on bond prices. "Good enough" Q1 earnings along with a strong US labor market, a less hawkish Fed, and expensive negative carry to short all support our baseline that credit is not going to aggressively widen until Q3 when the effects of tight monetary policy are more broadly transmitted throughout the economy.
That said, the upcoming US debt ceiling negotiations present the largest near-term risk to our spread view. The 2011 US debt downgrade was followed by a major widening in USD credit spreads, and similar volatility today could also pose material risks, given that today’s US credit cycle is more fragile than in 2011. Albeit unlikely, a downgrade/default that leads to a fiscal contraction and a sustained shock to business/consumer confidence would certainly lead to more aggressive spread widening in Q2 than our baseline forecast, and bring our Q3 targets into play. Although the magnitude of spread widening would ultimately depend on the Fed’s reaction function; namely the speed at which the Fed would resort to rate cuts in such a negative scenario….
… 2013 saw the largest move in 1M Treasury bills, and on average there was not a big move in these securities until just 15 days before the x-date. 1M yields did fall following the resolutions in the past, but only before typically rising again in the following 1-2 months.
… 10yr Treasury yields fell sharply into the 2011 and 2013 showdowns, with yields rebounding in 2013 and continuing to decline in 2011. Both moves reflect the economic backdrops of their times, while the median debt ceiling reaction was muted for 10yr treasuries in the month after the resolution was reached.
Lets turn our attention AWAY from US default and back TO … China as news overnight detailed / SPUN as to why WE here in the USofA may care,
Barcap China: Flirting with deflation
We forecast the CPI will slip into a mild deflation before rising gradually in H2. Weak demand increases the probability of policy rate cut, but a holistic approach is needed to break the disinflation/deflation spiral. A deeper housing contraction would worsen excess capacity issues and weigh on tradable goods prices.
In closing, a few thoughts and a visual from BBGs John Authers as it all shakes out leaving as many questions as answers and SO … to the question of VALUATIONS and a Fed model and such other things suggesting maybe STOCK VALS TOO RICH and, well, bonds (here and Japan) ‘look appealing’
BBG: Reading the entrails for a Fed pause versus cuts
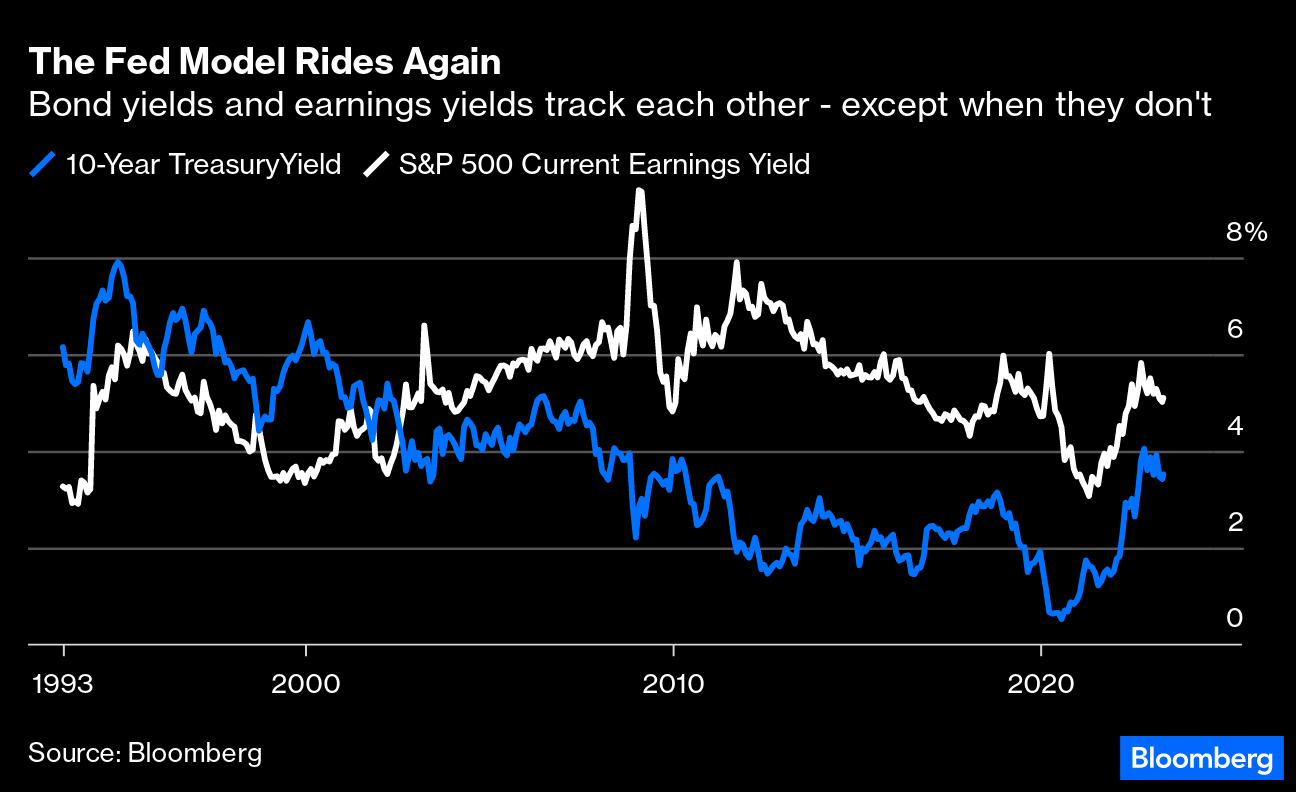
… Where does all this leave asset allocation? A Fed pause now seems a good bet for next month, but there’s little reason to expect monetary easing any time soon. It used to be assumed that earnings yields (the inverse of the price/earnings multiple) would follow bond yields. In other words, lower bond yields meant more expensive stocks. Known as the Fed Model after Alan Greenspan appeared to apply it in testimony, it seemed to work well in the 1990s, before not working at all in the Global Financial Crisis. Now, faith in the return of low rates, combined with the high valuations that are buttressing the stock market, suggest that investors are applying it again.
To look at it more scientifically, Andrew Lapthorne, chief quantitative strategist at Societe Generale SA, divided MSCI World stocks according to whether they were positively or negatively correlated to to bond yields, or had a minimal relationship. The way the lines move makes clear that correlations aren’t fixed over time, and that stocks differ from each other. It also shows that the number of stocks that “like” lower yields (implying that Greenspan’s Fed Model is working for them) is as high as it’s been since 2020:
Thus the stock market made a bottom and started to rise last October, when Fed officials began to discuss slowing down the pace of hiking. But the Fed wouldn’t (or shouldn’t) be cutting rates to help out stock investors. It would do so because something had gone wrong. If an economic slowdown is serious enough to force the Fed to cut further, then, to quote Saira Malik of Nuveen, “what ultimately causes the Fed to cut — a slowing economy that devolves into a recession — is bound to be a negative for markets.” She suggests that “stubbornly sticky” areas of inflation will help volatility pick up again in the coming weeks. Or, as Lapthorne puts it: “The bond/equity correlation is then once again a major issue for equity investors, leaving equity markets once again vulnerable to a pick-up in bond yields. Or to put it another way, to better economic news.” The major country where fewest stocks prefer falling yields is Japan, making it an interesting option if you think better economic news could be ahead.
This line of thinking suggests that valuations are too rosy, incorporating both Fed easing and a robust economy even though this is an unlikely combination. The current forward earnings multiple on the S&P 500 is about 18 times, according to Bloomberg, which doesn’t seem wildly out of line. But Mark Haefele of UBS cautions that when the index has traded at such valuations in the past, “consensus earnings growth expectations are robust (14% on average) or the 10-year Treasury yield is less than 2%.” Earnings declined slightly in the first quarter, while the 10-year yield is floating around 3.5%. So those conditions don’t look easily attainable. Haefele concludes that US equities “are pricing a high probability of a near-perfect outcome for the US economy.”
Another issue is that a Fed pause should mean stabilizing bond prices. So doesn’t it also make sense to buy bonds? Over history, long periods of unchanged fed funds rates have indeed been good for bonds, but tough for stocks.
The following chart is from Erin Browne and Emmanuel Sharef of Pimco, and can be found here. They examine the behavior of stocks and bonds after every Fed pause of six months or more following a hiking campaign, going back to 1950. The upshot is that bonds look the better bet. If Pimco’s base case of a lengthy pause and a US recession comes to pass, “then history suggests 12-month returns following the final rate hike could be flat for 10-year U.S. Treasuries, while the S&P 500 could sell off sharply”:
Counterintuitively, US bonds and Japanese stocks look appealing for navigating the uncertainty in a world where inflation is no longer rising, but is still too high.
Now before I let you noodle all THAT over, I’d like to note this will be IT until Monday at the earliest … there will be NO weekend update!
Family is traveling for Thing 1s graduation and I will be outta pocket from tonight thru Sunday (aka Mothers Day here in the USofA!) and I’ll say thanks in advance for your patience AND if you should require a refund, well, please reach out :)
Sorry. Not sorry! Cannot wait to see where Thing 1 goes next as he blazes a path forward and becomes a role model for both his brothers outta the nest, OFF the payroll and on in TO the world!!
Good luck (to him and all of you) as you plan your 30yr auction trades and TRADE those 30yr auction plans. Dont forget to have those bids in for today’s 30yr auction early and often and … THAT is all for now. Off to the day job…










'Thing' is much better than being called "No Son of Mine" LOL! Safe travels man!
Enjoy your time with the fam.