(USTs are marginally bid on light volumes) while WE slept; "Treasuries’ allure as safe haven noted in short maturities, not in long bonds" (Dallas FED) vs. "Memo: Go Long!" (Rosie)
ZH: Medicore 5Y Auction Sees First Tail Since January
And the table is set, then, for this afternoons 7yr to be the deciding of 3 auctions,
Unfortunately, there seems to be very little to mention here on the chart … an unremarkable setup as yields look to have NO pulse, flatline if you will, as momentum is in smack dab in middle of oversold and overbought … there are times you’d be better off flipping a coin or turning your attention away FROM the bond market and while this MAY be one of those times, I’m reminded of month/quarter and 1/2 years end coming end of the week and that old saying … one is never supposed to sell quiet markets.
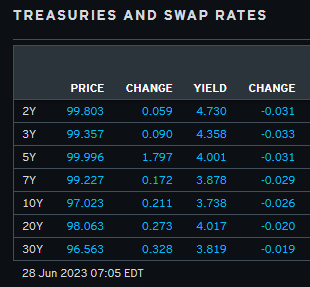
AND so … here is a snapshot OF USTs as of 705a:
… HERE is what this shop says be behind the price action overnight…
… WHILE YOU SLEPT Treasuries are modestly higher with the curve mixed after Aussie and Italian inflation readings and Eurozone M3 growth came in softer than expected. DXY is little changed while front WTI futures are modestly higher (+0.4%). Asian stocks were mostly higher (NKY +2%), EU and UK share markets are all in the green (SX5E +0.8%) while ES futures are showing -0.2% here at 6:45am. Our overnight US rates flows saw Treasuries dragged higher by Aussie bonds during Asian hours after Australia's CPI miss. Our desk flows were limited to front-end selling into the uptick then. In London hours, the recent theme of real$ extensions from the front-end to 10's continued today. Overnight Treasury volume was about 85% of average overall.
… Our next attachment looks at the monthly chart of Tsy 2yrs and how the bullish momentum signal confirmed in March is now more 'mixed' with the oscillator lines atop one another. Still deeply oversold, long-term momentum doesn't seem to know what to do amid the recent ranges. This mosaic suggests that short and long-term positioning remains defensive/short while medium-term shorts are still getting covered. That's about all one can say at this stage, given these set-ups
… and for some MORE of the news you can use » IGMs Press Picks for today (28 JUNE) to help weed thru the noise (some of which can be found over here at Finviz).
From some of the news to some of THE VIEWS you might be able to use… here’s what Global Wall St is sayin’ …
First up is one from an ‘official’ source of sorts and speaks TO banks as well as the yield curve
Dallas Fed Research: Treasuries’ allure as safe haven noted in short maturities, not in long bonds
The United States has a large negative net-foreign-asset position, especially in safe assets. In times of crisis, U.S. government debt, especially short-term Treasuries, are viewed as a safe haven. As a result, the U.S. is a net debtor. It is more leveraged and tends to hold more risky assets (mostly equities) and finances those positions by selling safe-asset debt to the rest of the world.
In normal times, this leads to the nation’s “exorbitant privilege”—it earns a higher return on its external assets than it pays on external liabilities. But in a crisis, this situation leads to the nation’s “exorbitant duty”—by holding risky assets financed with safe debt, a wealth transfer from the U.S. to the rest of the world occurs when risky asset prices fall.
… All Treasuries are not created equal
Both long-term Treasury bonds and short-term Treasury bills are widely considered safe assets and have no default risk; it is common in the international finance literature to discuss how these U.S. safe assets provide their holders with an extra safety benefit. That benefit leads to a higher demand, and thus, a higher price and a lower yield. The negative spread between the yield on U.S. safe assets and comparable assets from other developed economies is referred to as a “convenience yield.”
But not all Treasury securities are equally safe. Long-term Treasury bonds may have no default risk, but they have liquidity risk and interest rate risk—when selling the bond prior to maturity, the sales price is sometimes uncertain, especially in times financial market stress. (Generally, Treasury prices move inversely to interest rate changes.)
Short-term Treasury bills are also default-risk free and relative to Treasury bonds carry little liquidity or interest rate risk. In a crisis, when investors prize safety and liquidity, they flock to safe short-term T-bills. This is what we see in Chart 2, which plots short- and long-term portfolio debt inflows over roughly the past two decades.
Recall that these inflows are the purchases of U.S. assets by foreign investors. In the two large crises in this sample period, the 2007–09 global financial crisis and the onset of COVID-19 in early 2020, long-term U.S. portfolio debt inflows fell but short-term portfolio debt inflows increased…
Economically speaking, a couple notes.
First up on the idea of SAVINGS (or the lack thereof)
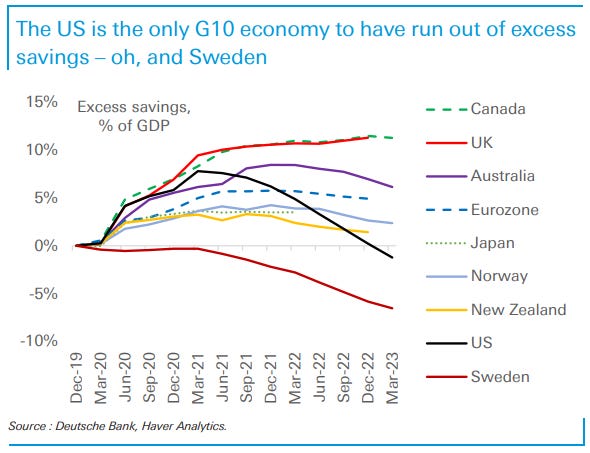
Last Friday, Fed Board staffers published a note proposing a new methodology to compare excess savings across global economies. Their important conclusion was that, as of Q1, the US was the only advanced economy in their sample to have fully depleted households' excess savings built up during the pandemic. But their sample is small, and so in this note we replicate their methodology whilst expanding the sample to all G10 economies and aggregating the results for the Eurozone as a whole.
The results are of course broadly similar: the US depleted its excess savings as of Q1. And while Q1 data is not yet available for all other countries, recent trends suggest it is very unlikely that any of them had run out. The UK and Canada probably had at least 10% of GDP worth of excess savings left; Australia and the Eurozone probably had at least 5% of GDP left. In general, these numbers are consistent with the robust demand picture so far this year, and especially with the surprising growth dynamic in Canada and the UK.
However, we find an even bigger negative outlier than the US that was not included in the Fed's sample: Sweden. As Sweden never locked down as hard as other countries in 2020, households never accumulated excess savings before their saving rates quickly fell below pre-Covid trends amid the inflation and interest rate shocks from 2021 onwards.
So, two conclusions. First, the divergence in excess savings in the last year or so is consistent with our medium-term view of the US economy slowing more rapidly than peers and the Fed being closer to easing policy than most other central banks in G10. Second, while the UK and the Eurozone could hold out a little longer thanks also to excess savings, the lack of excess savings supports our view that Sweden faces even stronger headwinds.
Some GOOD news, then, as the other side of the coin … might be in order.
Barclays: Housing data surprises to the upside with stronger prices and sales Both the FHFA and S&P CoreLogic CS 20-City measures of house prices showed strong gains in April, with the FHFA measure rising 0.7% m/m and the S&P measure rising 0.91% m/m. New home sales also surprised to the upside, rising 12.2% to 763k in May.
Whether or not higher and rising prices is, in fact, ‘good’ news is up for debate. Higher prices along with higher mortgage rates may very well combine to provide the Fed with a desired slowing — eventually.
Wells: New Home Sales Soar in May New home sales soared 12.2% to a 763,000 annual rate in May. Not only did this jump defy consensus expectations, but it lifted the annual pace of new home sales to its highest level since February 2022. Steady buyer demand and scarce existing home supply continue to bolster the new home market across all regions…Looking ahead, climbing financing costs pose a potential near-term challenge for the housing market recovery. According to Freddie Mac, the average 30-year fixed mortgage rate rose from 6.4% in the first week of May to 6.7% the week of June 22.
And moving along TO some eco-double-speak from one of the best in the business,
Recent US data has been reported as better than expected. Wide forecast ranges make “expected” a rather imprecise concept. But on both sides of the Atlantic, middle income consumer spending power is better than the official data implies. This is not enough to stop a slowdown, perhaps. It is enough to give resilience to consumers.
For example, middle income US homeowners face a lower cost of living than consumer price inflation implies. They do not pay the fictional price of owners’ equivalent rent. If they are one of the hundreds of millions of US citizens not buying a used car, their real spending power is further enhanced. Economists are often criticized for removing all the parts of inflation data they do not like—but to understand consumer spending firepower, judicious pruning is necessary…
I do believe he’s written a book, ‘if you think you know what I said, please re read’?
(nearly)EVERYONE buys gas, a gallon of milk and eggs and while prices of things have come off the boil, spinning the US consumer as being in simply FINE shape, is, well, said best when far away off in the distant.
Or perhaps another way to consider saying it … LEARN TO CODE? Recall this ‘official’ chorus? Well,
… (5) US Economics: We estimate that the first negative payroll print could come in August / September.
A question that came up in nearly all of our US Economic team’s client meetings last week was when they expect to see the first negative payroll print. Our team forecasts a significant slowdown in monthly nonfarm payroll (NFP) growth this year, and, if job growth is indeed that slow, they view it as highly likely that at least one of those monthly prints will be negative. The solid line below shows their NFP forecasts; the dashed lines are two-standard-deviation confidence intervals constructed using historical consensus forecast errors from 2010 to 2019. The August –2SD band is close to the zero line, and September is the month for which the lower band moves into negative territory. Our team believes that a negative payroll print could sharply raise risk-off sentiment in financial markets, but they caution that the Fed is not likely to be so quick to react — a negative payroll print could be a one-off, and more supporting evidence could be needed.
Error Bands Suggest the First Negative Payroll Print Could Come in August / September
For somewhat more, same shop, different note,
MS: New Work on the Labor Market Supports a Soft Landing We see job growth slowing into 2024, but identify five key factors that should keep the unemployment rate low, underpinning our call for a soft landing.
We think a soft landing for the US economy is likely, and a resilient labor market is central to our narrative. In this note, we examine five sources of labor market resilience.
The historical relationship between payroll gains and GDP growth (Okun's Law) suggests that for current GDP levels (2Q23), payrolls should be 300k above the current level. In other words, the economy is understaffed, mostly in the services industry and public sector.
We think firms are likely to hold on to their workers to a greater extent than in prior soft patches, staving off a significant rise in layoffs. The recent decrease in hours per worker and flat layoffs align with our view.
Sticky low unemployment primarily results from a downward shift in the Beveridge Curve post-COVID. This change reflects an increase in labor markets' efficiency possibly due to: (i) declining dislocations after COVID, and (ii) more search intensity as firms focus on "need-to-have" open positions while canceling the "nice-to-haves".
Higher labor force participation will likely cause additional slack, helping to ease inflationary pressures in core services ex-shelter CPI components.
Positive real wage growth ahead will support demand, without accelerating inflation significantly. Our previous research shows that wage-price pass-through to core inflation is low and has been decreasing over time, especially for the goods and shelter components of the CPI.
And for our inner stock jockeys
Barcap Equity Strategy - Who Owns What: FOMO trumps recession fear FOMO has seen frustrated bears turning into reluctant bulls. So positioning has normalised and risk is more symmetric. But an ever-delayed US recession, OK earnings, AI frenzy and low vol may lead to more cash deployment by MFs. As regional flows shift back to US, EU/UK is for sale. Banks-to-Tech rotation is noticeable.
We have been consistently highlighting from April not only key resistance in the Euro STOXX 50 at the major high of 2021 at 4415, which has repeatedly capped the market over the past two months, but also the glaring and growing weekly RSI momentum divergence.
Our base case has been to look for 4415 to cap and for a top to form, and we maintain our view, but with a break below key support from the 4211 May low needed in our view to see a top confirmed.
Finally, a few words from Rosie and his latest memo,
Rosie Memo: Go Long!
Today’s investor class is truly a bizarre bunch. All I get are questions every day that sound like this: “How do equities perform after the Fed pauses??” Day in and day out. I get reams of Wall Street research sent to me about how terrific the S&P 500 does three, six and twelve months after the Fed presses the pause button.
Yes, true, but in cycles when the Fed tightens enough to generate an inverted yield curve we have ended up with a recession and bear market with a lag 100% of the time in the past. The stock market lows happen 2-3 years after the Fed moves to the sidelines… think of what happened in 1990, 2001, and 2008. Play the market to the highs but make sure you have hedges and insurance in place. The fundamental lows in the S&P 500 are simply not in despite this year’s rally, and we had three terrific rallies like this in the 2007-09 bear market that were fun to rent but not to own.
Thing is — nobody ever asks me how the Treasury market performs the year after the Fed moves to the sidelines after a tightening cycle. Do Treasuries have leprosy? Or are they just not sexy enough? You do want to own equities to build long-term wealth; that I agree with 100%. But today’s investor only sees equities as some ‘get rich’ quick scheme — FOMO, TINA and all these other acronyms are recent inventions as far as Wall Street lexicon is concerned. When I was born and raised in this business in the 1980s, I was taught by my masters that speculative behavior was dangerous. Not today. I was taught that the equity market should be viewed as a long-term vehicle to build net worth (and for companies to raise capital for capex purposes), not as a short-term trading tool. Tell that to anyone today and they will laugh in your face. This is why there has been, over the years, a proliferation of sophisticated family offices that have cropped up — because there is still a market for well-heeled investors who don’t need hucksters on social media to make them a quick buck, but do need a path to preserve their capital and add to their wealth gradually and responsibly…
… I’ll finish off this piece with this little ditty: as everyone focuses on the S&P 500, the sexy centerfold in the magazine, boring bonds have never ever failed to deliver a positive total return in the year after the Fed presses the pause button. And the returns rival what the stock market does with a modicum of the risk. But you won’t know this by reading Wall Street research or listening to the folks on CNBC or Bloomberg TV. We looked at the 8 Fed cycles over the past 40 years and guess what? The total net return in the 10-year Treasury note came to +18% in the twelve months after the Fed moved to the sidelines — the median gain was +12.5%, and the worst showing was +6%! For the long bond, the average net return was +28% and the median was +15%. Back to the football scenario: As Roger Staubach would have said to Drew Pearson on that famous Hail Mary pass in the NFC final against the Vikings in 1975: “Go long!”
On THAT note, I’ll quit while I’m behind … THAT is all for now. Off to the day job…