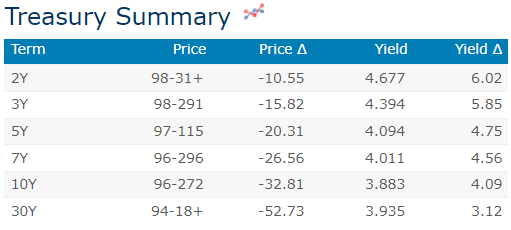
Yields are CONTINUING to head higher and momentum (bottom panel) remains overSOLD … eyes continuing to watch previous (October 2022) ‘cheaps’ of just inside 4.90% … Why?
Well, a couple NON VOTERS rockin the world yest as Fed Bullard would not rule out supporting a 50bp hike at the next meeting, “it will be a long battle against inflation”. AND Fed Mester said “we will need to bring Fed Funds rate above 5% and hold it there for some time”.
These remarks all help ‘splain front end of the curve, logging new YTD (and nearly cycle) cheaps (above) and with that, stocks should be taking note …
… here is a snapshot OF USTs as of 714a:
… HEREis what another shop says be behind the price action overnight…
… WHILE YOU SLEPT Treasuries are lower and curves mixed (see discussion below) with UK and German bond markets a mild drag with both underperforming this morning (Aussie market 5-6bp cheaper today too). DXY is higher (+0.65%) while front WTI futures are notably lower (-2.8%). Asian stocks were lower after yesterday's late-day swoon in NY, EU and Uk share markets are all in the red (SX5E -1.05%) while ES futures are showing -0.7% here at 6:45am. Our overnight US rates flows saw a 1-way trade lower during Asian hours with good volumes seen from the front-end out to 10's. Our Tokyo desk saw better buying in the front end amid another notable pick-up in block futures flows. Treasuries went into the London crossover at the lows. Overnight Treasury volume was solid at ~125% of average across the curve.
… daily chart of Treasury 10's to highlight how yields are pressing above support this morning- support derived by the turn-of-the-year closing highs near 3.885%.
Close above this level and the door opens wide for a return to 4%-handles, in our view. And our next attachment of the weekly chart of 10's shows how the prevailing winds (weekly momentum, lower panel) blow briskly against 10s right now where October's 4.33% move high appears at risk of a re-visit in the coming weeks...
… and for some MORE of the news you can use » IGMs Press Picks for today (17 FEB— and STILL SPORTING THAT NEW LOOK!!) to help weed thru the noise (some of which can be found over here at Finviz).
From some of the news to some VIEWS you might be able to use. Global Wall St SAYS:
On STOCKS and CBs …
Barclays: Equities' inclination to rally is being kept in check by sticky inflation. While improving growth expectations have flipped the bond-equity correlation, higher for longer rates mean there is no free lunch. Technical/sentiment indicators have normalised and are less supportive now, but don't give clear sell signals either…persistent inflation means there is no free lunch, and higher for longer rates is the cost for resilient growth. CB's data dependence will likely keep equities' willingness to rally in check, in our view.
The interminably tedious EU-UK divorce is back, with UK Prime Minister Sunak heading to Munich on Sunday. The intention is to lurk around on the fringes of a conference in the hope that someone will stop by for a chat on Northern Ireland. Do markets care? Directly, not much. Indirectly, there might be speculation about the implications of any deal for UK political stability….
… US import and export prices are due. These are not likely to be of focus to investors. The inflation story in the US and elsewhere is more a domestic profit margin story than it is about currency moves and import prices…
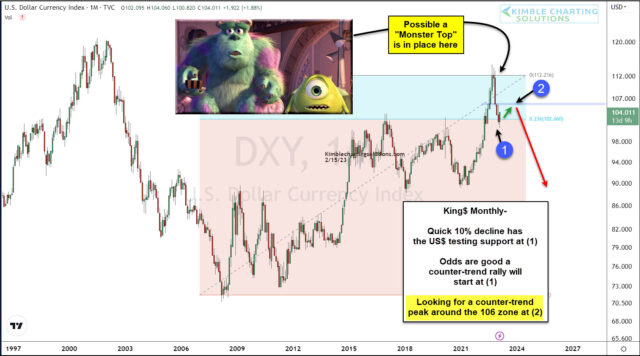
Finally, a couple charts for those of us who are visual learners. Leading off is one for your inner FX persona (as goes rate expectations so goes the USD?)
… If this monster top holds true, we could see a counter-trend rally back to 106 at point (2) before heading much lower. This could get interesting… stay tuned!
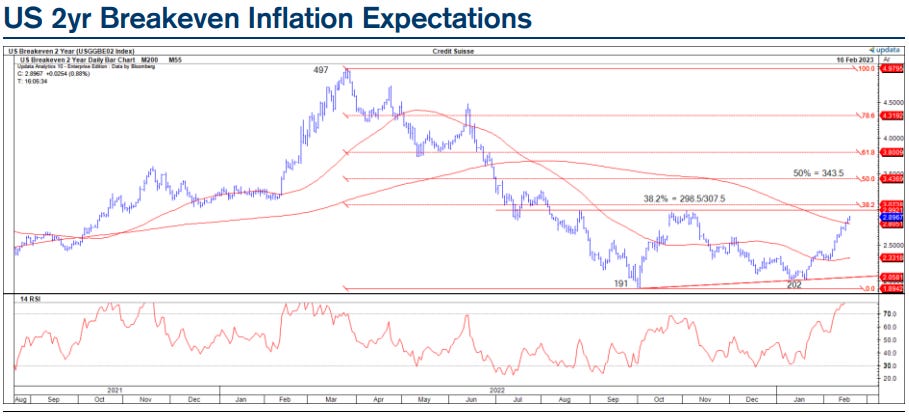
Rate CUTS and disinflation’ista’s paying somewhat MORE attention … meanwhile, 1stBOS has an interesting CoTD relating TO front-end of the yield curve…
Chart of the Day: US Bond Yields have risen strongly so far in February as growth and inflation data surprised on the upside, resulting in higher terminal rate pricing and a pricing out of 2023 cuts. In our view, front-end inflation expectations in particular are key to determining whether this bond selloff can extend, as the FOMC is likely to be highly sensitive to a renewed push higher in inflation. With this in mind, the US 2yr Breakeven will be key to watch around the key cluster of levels between 298.5bps/300bps and 307.5bps, which is the range high since August 2022 and 38.2% retracement of the 20-2022/23 fall. Our bias is that this level will cap the market to keep it in a range, however a weekly closing break would complete a base to open up a move to 327bps initially.
The firm remains tactically NEUTRAL 5yy, bullish 10s (close north of 3.91% would turn them NEUTRAL) and bullish BONDS (close above 4% and they’d hop back up on the fence of neutrality)…Nothing happening in a vaccuum — USD moves, front-end rates and BREAKS, etc … All worth watching / noting as we head in TO long weekend.
… THAT is all for now — hopefully more over the holiday long weekend ahead but for now ... Off to the day job…