Good morning … While Trump sure to provide fodder for global markets and mainstream media throughout the day, CNBC and Jamie Dimon attempting to steal the spotlight IF for only a moment or two,
Jamie Dimon, longtime JPMorgan Chase CEO, said of the latest financial shock in his annual letter: “The current crisis is not yet over, and even when it is behind us, there will be repercussions from it for years to come.”
“But importantly, recent events are nothing like what occurred during the 2008 global financial crisis,” he added in the letter released Tuesday.
The recent banking issues in the U.S. began with the collapse of Silicon Valley Bank, which was closed by regulators on March 10 as depositors pulled tens of billions of dollars from the bank.
HEREis the entire letter IF you have any trouble sleeping at night and … here is a snapshot OF USTs as of 705a:
… HEREis what this shop says be behind the price action overnight…
… WHILE YOU SLEPT Treasuries are lower with the curve mixed amid risk-on conditions and Gilt and Bund underperformance since their open. DXY is lower (-0.18%) while front WTI futures have extended yesterday's gains (+1.00%). Asian stocks were mixed on balance, EU and UK share markets are all higher (SX5E +0.8%) while ES futures are showing +0.37% here at 7:07am. Our overnight US rates flows saw another sleepy Asian session with a -3.2k block sale in TY futures a standout in their hours. A big tail (biggest since September 2020) pressured JGB's with JGB 10's closing 3.4bp cheaper on the day, setting a tone. In London's AM hours the desk saw better real$ buying in the 3-5y sector on overall light volume. Overnight Treasury volume was ~60% of average overall with 3yrs (131%) seeing some relatively high turnover, matching our flows.
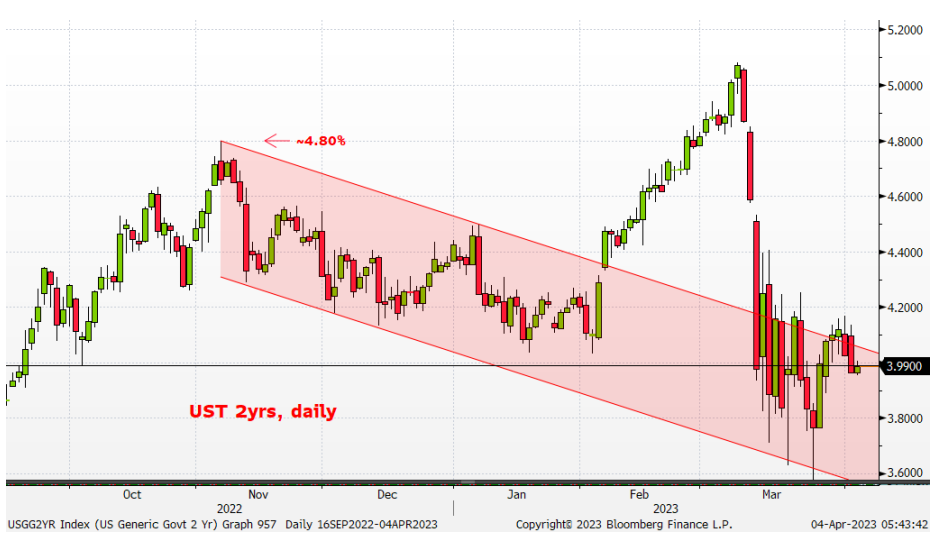
… Walked in and saw 2yr Tsy yields at 3.99% and thought, "Hello, new friend." Indeed, today was the 13th session since March 13th that we've traded the level intraday as we show in today's first attachment. We still see 2y yields headed to at least 2.97% (2018's move high) in the month's ahead based on the monthly chart developments we discussed yesterday morning. That said, this 4% area seems to be the proverbial 'feathered nest' for 2's as markets weigh inflation versus potentially tighter financial conditions and, of course, the Fed's response to how the tension between these forces, and others, play out. This month's release of the Fed's Senior Loan Officers Survey (SLOOS) could be the most anticipated in years??
MOVE/VIX, monthly: Much ink has been spilled on the spike in rates vol versus the relatively stable VIX index. So we looked at the long history of the relationship between the two and the last time we were at/near current levels was... May 2008. Back then the Fed was buying up 'toxic' bank debt with $150bn added to the Term Auction Facility (TAF) that month amid rate cuts...
… and for some MORE of the news you can use » IGMs Press Picks for today (4 APR) to help weed thru the noise (some of which can be found over here at Finviz). Be sure to check out CNBC on,
From some of the news to some VIEWS you might be able to use. Global Wall St SAYS:
Wells out with an,
ISM Alert: All Components in Contraction for First Time Since 2009
Summary While some parts of the service sector demonstrate resilience to the fastest rate hikes in a generation, the message from today's ISM manufacturing index is that the factory sector is reeling. The headline measure fell to its lowest since 2020, and every sub-component is below 50.
I see that alert and think,
Moving along from one alert to another variety whereby we’ve got data Friday when nobody will be here to see it??
The Labor Department's Nonfarm Payrolls report for March will be released at 8:30 a.m. EDT on April 7, 2023, even though the New York Stock Exchange will be closed for Good Friday. This report is always eagerly awaited by investors, as it typically provides the first and most-important view of the previous month's economic activity. This report will help settle two of Wall Street's most-important debates: whether economic activity has softened enough for the Fed to stop raising interest rates and whether there will be a soft or hard landing. Futures contracts on the fed funds rate reflect traders' belief that the central bank is nearing the end of its campaign (even with February's 3.6% unemployment rate just two ticks above January's 54-year-low and payrolls swelling by more than 800,000 in January and February). The failures of Silicon Valley Bank and Signature Bank illustrate the dangers of aggressive interest-rate increases, but we don't see signs of contagion in the Fed's March 30 data on Factors Affecting Reserve Balances. What we do see is that there are still 10.8 million jobs available against just 5.9 million people unemployed. Our Nonfarm Payrolls forecast anticipates that 195,000 new positions were created in March, down from 311,000 in February. Our expectation for solid-but-slower hiring is bolstered by low levels of initial unemployment claims, tempered by layoffs in Technology and other sectors. Challenger, Gray & Christmas report that U.S.-based employers announced 77,770 job cuts in February versus 15,245 in February 2022. We look for the March unemployment rate to tick up to 3.7% and for average hourly wage gains of approximately 4.3%. The market could be at risk if there is a big surprise that shows more tightening is needed or that the unemployment rate has risen by more than the 50 basis points that typically make a recession inevitable.
Before we get TO Friday and data (when it’s likely only a few bond jockeys are watching), we’ve still gotta deal with this past weekend news of nOPEC CUT in supply, and on that, a rather large French bank chimed in
On 2 April, OPEC+ surprised with production cut announcements of 1.15 mbd for May-June and 1.65 in July-December, reinforcing our bullish market view.
Our key concern is that OPEC is jumping the gun by cutting production before being sure today’s demand weakness is structural. We therefore think the cut is unnecessary, risky and could rekindle inflation concerns in Q3/Q4 this year.
Despite OPEC and Russian compliance issues, supplies will contract (we think by about 675kbd), raising prices and reigniting inflation concerns.
We choose to wait for the market to settle down this week before deciding if/by how much we increase our Q3/Q4 Brent forecasts by next week
For somewhat MORE on ‘Earl, MS
OPEC Cut Offsets Underlying Weakening Fundamentals have been softer-than-expected recently and prospects for 2H tightening had started to slip. With additional OPEC cuts, however, we still see the market in (an unchanged) deficit in 2H but the drivers of that undersupply are different. We lower our price forecast to reflect this.
From JOBS to ‘Earl and another crisis a bit further off in the distance … MS offers,
FAQ: Banking and the Debt Ceiling in Focus Lawmakers are focusing on crafting a response to recent banking challenges, as well as the debt ceiling. Herein, we answer your most frequently asked questions on these topics.
How plausible are the regulatory efforts being discussed?Modifying the FDIC insurance cap higher or passing broader bank regulation both appear unlikely in the short term, but that could change if markets become disorderly again and/or a bipartisan consensus emerges.
Does the recent volatility and government response pull forward the X date? Not in our view, as the timing and magnitude of receipts and outlays will be more critical determinants of the deadline.
What would a higher FDIC cap mean for banks? All else equal, a higher cap = higher premium = more expenses for banks, but the impact of higher deposit insurance expenses will depend on how the FDIC will change the assessment base and/or the assessment rate.
… When examining the T-bill curve, we observe a noticeable "kink" for T-bills maturing from June to September (Exhibit 7). This suggests a wide window (4 months) for the market's pricing of the "red zone" and continues to reflect the degree of uncertainty around current estimates of the X date.
This lack of relative demand has led those T-bills to trade cheaper vs. OIS relative to other tenors (Exhibit 8). Moving forward, we expect the "red zone" for T-bills to become narrower and for the sell-off to be more pronounced for those "affected" bills.
AND as we’ll all be watchin’ the RED ZONE THEN, more here and now, some math of yesterday via Goldilocks — ISM down + construction UP = MOAR GDP
ISM Manufacturing Index Declines to Lowest Level Since May 2020; Construction Spending Revised Up but Edges Down in February; Boosting Q1 GDP Tracking to +2.6%
BOTTOM LINE: The ISM manufacturing index declined in March to the lowest level since May 2020. The underlying composition was mixed-to-weaker, as the production component increased slightly but the new orders and employment components fell further into contractionary territory. Construction spending edged down in February, slightly below consensus expectations, while growth in January and December was revised sharply higher. Following this morning’s data, we boosted our Q1 GDP tracking estimate by 0.2pp to +2.6% (qoq ar).
From a somewhat positive SPIN on GDP to a somewhat less so, FirstTrust:
Monday Morning Outlook - Still Bearish
If you were bullish for 2023…congratulations! The S&P 500 rose 7.0% in the first quarter and, although we still have more data to analyze before we finalize our prediction, it looks like real GDP grew at about a 2.0% annual rate in Q1. No drop in stocks, no recession. At least not yet.
While we wish we hadn’t been bearish when this year began, our forecast for a drop in stocks and a recession hasn’t changed. Using corporate profits for the fourth quarter and the current 3.5% yield on the 10-year Treasury Note, our Capitalized Profits Model suggests a fair value for the S&P 500 of 3,891, which is lower than where stocks are today…
…COVID-related shutdowns were a catastrophe for the US economy, more man-made than anything else. The policy measures taken to ease the pain of the shutdowns were unprecedented, too. Now those policies are wearing off and we expect a period of economic and financial pain. Given the unprecedented nature of the problems, it’s the timing of the pain that’s tough to forecast, not predicting that the pain will eventually come. Clearly the market is having a hard time digesting or believing that in 2023.
Moving from a more gloomy outlook TO Prof STOCKS FOR THE LONG RUN Siegel,
… As I wrote last week, the math from a very positive first quarter GDP (around 3% estimated) and now 1% for the second quarter, implies a sharp slowdown over the second half of the year. Things certainly may take a turn for the worse—as we do not yet have any data reflecting ramifications from the Silicon Valley Bank (SVB) failure. It will take anywhere from 4 to 8 weeks before we start to see economic data showing SVB’s impact. We do get jobless claims on a weekly basis and those are an early read for economic trends. And these jobless claims remain subdued, reflecting strength in the labor markets.
Keep in mind on these jobless claims: our economy has been shifting more to services over the years. And a number of economists believe those jobless claims don't measure joblessness as well in the service sector as they do in the manufacturing sector. It is thus hard to compare subdued jobless claims today to prior spikes in these weekly jobless claims during recessions.
Nonetheless the lagged data remains resilient and surprisingly strong. This week we will get the employment report from March. Again, it will not yet show any SVB impact and early estimates expect a 200,000 job gain.
If the Federal Reserve estimates GDP growth at 0.4% for the year and negative GDP over the second, third and fourth quarters, it would imply negative payroll growth over the next nine months ahead. I wonder if you asked the Fed today whether they agree with their own forecast, would they agree with this contractionary implication?
… Summing up: I enter the second quarter with a cautious outlook. I would like to see the Fed recognize the cumulative impact of its tightening and that inflationary pressures are no longer a primary concern. I would go with a pause at the next Fed meeting, but we still have six weeks to go. We will be getting CPI data, employment data, and a lot more anecdotal data on lending and borrowing impacts to gauge the Fed’s likely course.
With these cautious words in mind, how about a few (MONTHLY) charts from a large German operation,
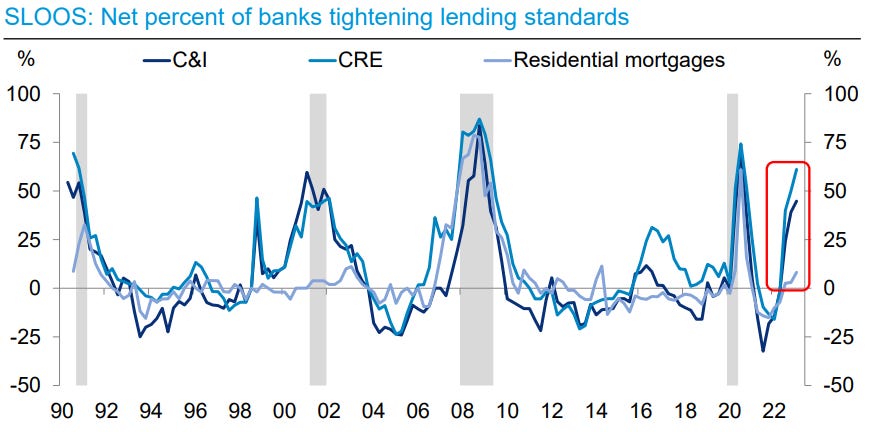
US outlook: (Credit) Crunch time for the US economy?
Even before banking sector turmoil, lending standards had tightened to levels typically preceding recessions
Banking Crisis, Oil Shock and Declining ISM are not good for risk
Cross-Asset Strategy: Over the past month, a significant global banking crisis developed that is expected to negatively impact the economy. Over the past week, Oil rallied almost 20%, mostly as a result of supply shock putting upward pressure on inflation. Today, ISM data looked weak. The Fed indicated no intention to cut interest rates this year, yet risk assets are exhibiting an unprecedented rally, with European stocks trading near all-time highs and US stocks recovering recent losses. For a rational investor, we think this makes little sense and that most of the inflows over the past 2 weeks were driven by systematic investors, short squeeze and a decline in VIX. Any decline in yields is not a sign that the FED is about to bring a punch bowl for tech stocks, in our view, but rather a sign that recession probability has increased. We expect a reversal in risk sentiment and the market re-testing last year’s low over the coming months. US credit spreads are arguably in ‘no man’s land’ , too wide to bring out sellers and too tight to incline buyers to commit capital. We see opportunities in US nonfinancial hybrids and higher quality Insurance bonds/CDS. In Europe, we go OW GBP IG vs EUR IG, as hedged spread differentials spiked close to levels seen during the LDI crisis…
… Late cycle investing when risk premia are tight but markets are range-bound: Despite noise, a recession in the next 12m should be a baseline. Traditional late cycle dynamics have emerged and in our view are here to stay, so historical performance in late-cycle/recession should help form expectations. We believe investors should UW Equities (vs Cash/Fixed Income), favor Defensives vs Cyclicals, and HG vs. HY within credit. Steepeners should make money as flat curves normalize.
I always loved Lost in Space, in fact I think the B&W episodes were the shows best efforts. But your Airplane "wrong wk to stop sniffing glue" was PREFECT. I forgot he fell backwards upon inhalation LOL. No way that movie would ever get made today! Thanks!


I always loved Lost in Space, in fact I think the B&W episodes were the shows best efforts. But your Airplane "wrong wk to stop sniffing glue" was PREFECT. I forgot he fell backwards upon inhalation LOL. No way that movie would ever get made today! Thanks!