And this all combined with an overnight Chinese DATA DUMP characterized as,
ZH: China Data Dump Total Disaster; Youth Unemployment Hits Record High
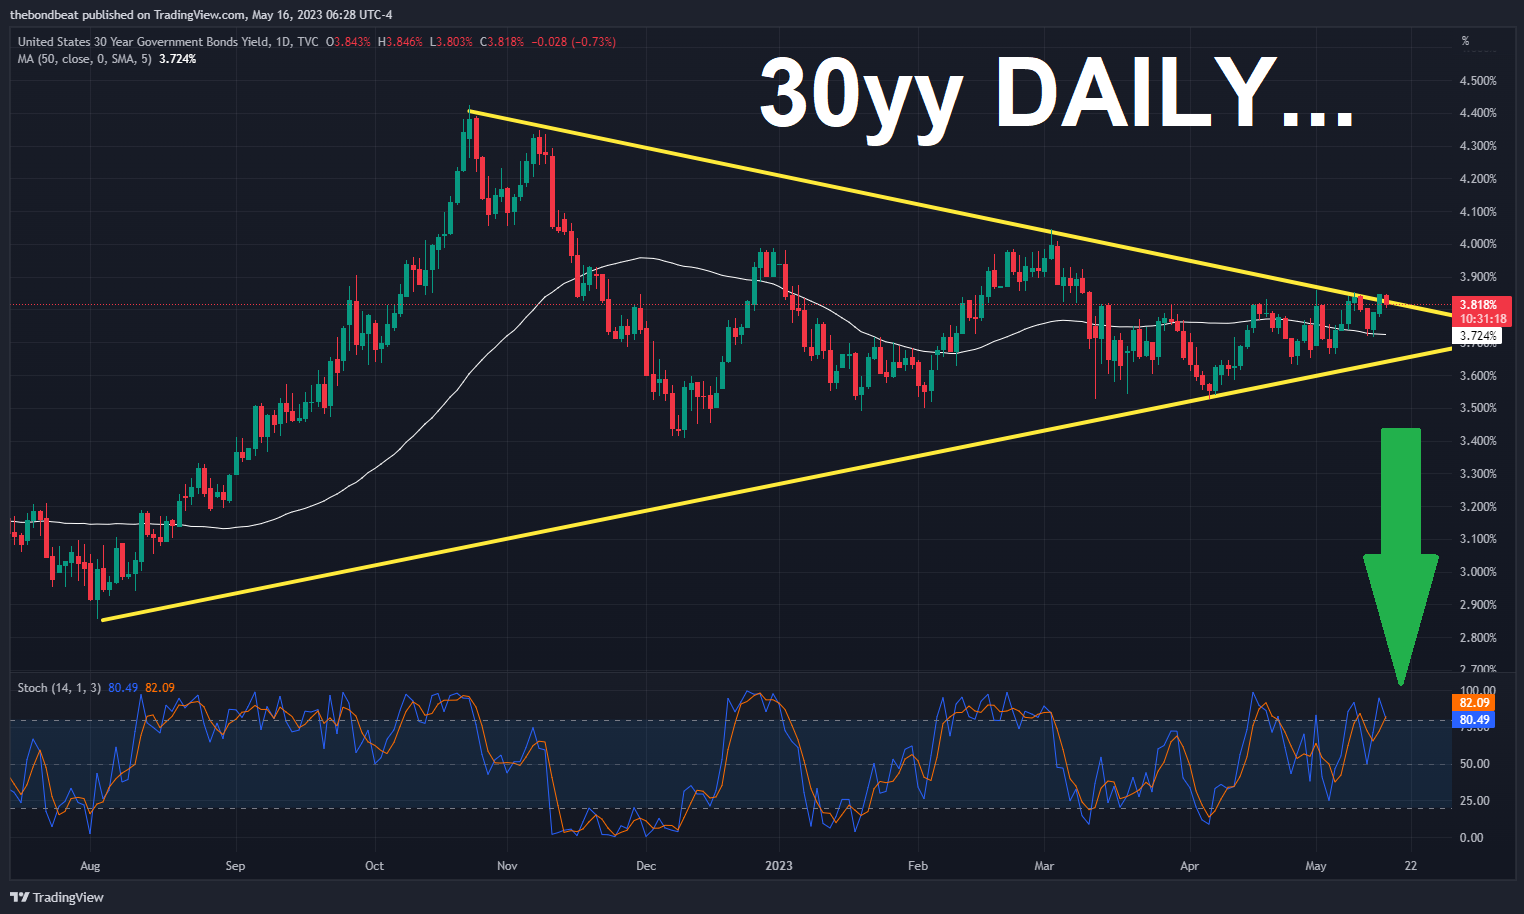
AND Global Wall St comments just below but first … here is a snapshot OF USTs as of 705a:
… HEREis what this shop says be behind the price action overnight…
… WHILE YOU SLEPT Treasuries are higher this morning as China's data dump overnight came well shy of expectations while the UK's (still historically low) unemployment rate was a bit above expectations as well. DXY is lower (-0.14%) while front WTI futures are little changed. Asian stocks were mixed, EU and UK share markets are mixed and ES futures are little changed here at 6:55am. Our overnight US rate flows saw real$ buying in the front-end and the belly this morning while most back-end flows came from fast$. There was also a block UXY/WN steepened that supported the curve earlier. Overnight Treasury volume was ~120% of average overall with 5yrs (153%) seeing some relatively elevated turnover among benchmarks, matching our flows.
… the next interesting chart of the performance of 2s5s10s over the Asian, European and US sessions. As you can see, US investors have tended to fade the belly richening since the March banking turmoil while European, and especially Asian investors, have been an important driver behind 2s5s10s' move south in recent weeks...
… and for some MORE of the news you can use » IGMs Press Picks for today (16 MAY) to help weed thru the noise (some of which can be found over here at Finviz).
From some of the news to some of THE VIEWS you might be able to use… here’s what Global Wall St is sayin’ …
First up, about that China inspired ‘flation comeback,
ABNAmro: China - April data disappoint Chinese data for March did generally point to improving momentum, but the April data published so far suggest the reopening rebound is fading.
ABNs not alone … a rather large German bank offers,
DB: April activity: a slower recovery China's recovery may have lost some momentum lately, according to the latest April activity data. Most indicators recorded higher YoY growth only because of their low base in 2022. On a 2-year average growth basis comparing to 2021 levels, growth appears to be slowing across the board, and particularly in industrial production and fixed asset investment…
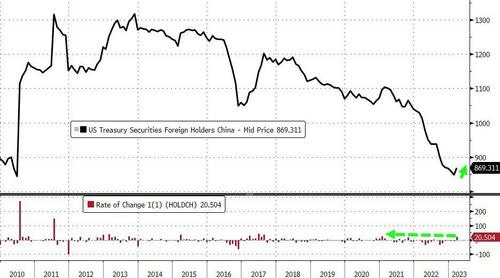
ZH: China Suddenly Buys TSYs Amid March US Banking Crisis, Gold Reserves Hit Record High
China bought more US Treasuries in March (US banking crisis) than it had since January 2021, adding $20 billion (the first buying month since July 2022)...
… Meanwhile, foreign private buying of Treasuries is relentless, and extends to 17 consecutive months, with $19.3BN bought in March, after $9.6BN bought in Feb.
So of the $35.8BN buying in total TSYs, $16.5BN was foreign official, and $19.3BN was foreign private…
Foreign PRIVATE investors are NOT ones who NEED to own USDs for one purpose or another but rather are out seeking returns and so, can / will go ANYWHERE. They’ve been COMING TO AMERICA for quite awhile…
Back TO Goldilocks who’s ALSO offering a note on an aspect of housing that is NOT usually top of mind,
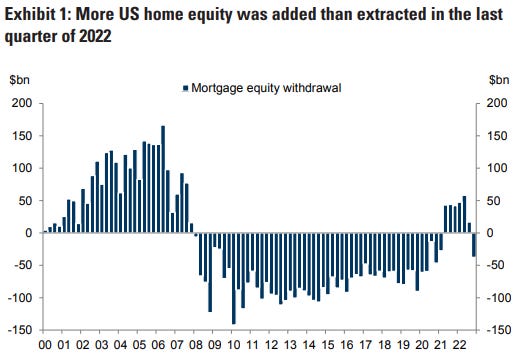
GS: A Pause in Home Equity Borrowing After 6 consecutive quarters of net equity withdrawals, US households added equity to their home mortgages at the end of last year. In our view, this shift has likely been driven by persistent high interest rates, diminished credit availability, and home value uncertainty. Going forward, we expect home equity borrowing to be a subdued channel for household credit access in the medium term, exacerbated by the increased market share of small banks in recent years. This should pressure demand for repairs, renovations, and large ticket household expenditures.
… As the housing sector continues to recover through the start of 2024, we expect households will regain focus on tapping their substantial home equity to extract cash. Until then, we view untapped home equity as a continued tailwind for mortgage credit performance.
Pausing a moment and turning away from China and US housing to hear a few updated thoughts from a large German analyst with update on US earnings,
DB: What Companies Are Saying: One Foot On The Gas, One On The Brake
I’m sure this is a fine way to ‘drive’ in some places but …. same shop out with a MONTHLY CHARTBOOK and,
DB CoTD: Burying a time capsule … entitled “A Time Capsule For The future”. It’s based on the theme of imagining that in the distant future, in many centuries time, you dug up a time capsule with this presentation in it. If you didn't know what happened next in the macro world back in 2023, would it be as obvious in the future as it seems to us now when we look at the charts? You can see it here.
… A key pointer was the 2s10s inversion back in March 2022. For us that was the final signal that the long countdown clock to the recession had begun. However, around that time the Fed’s favourite “near-term forward spread” seen in today’s CoTD was around the steepest it had ever been. The Fed were using this to explain how a recession was unlikely. For us the disparity was always likely a timing issue as 2s10s has a long lead (c.18 months) and the near-term spread a much shorter lead time into a recession. 2s10s data goes back far further so it’s still our preferred measure. Just over a year and 500bps of hikes later and the “near-term” spread is telling us that a recession is imminent…
AND there’s more … have at it and from the esoteric TO the blocking and tackling of the day just ahead where UBS speaks on ReSale TALES and dunno ‘bout you BUT I detect a note of jealousy,
UBS Paul Donovan: Consumer or producer? US retail sales give a glimpse into the hedonism of the US household. This is April data—too soon for consumers to feel any consequences from banking system volatility. Any credit tightening hurts consumers when they try to increase their credit card limits, not when they are spending the limits they already have. Industrial production is also due, but globally the US matters more as a consumer than a producer…
In as far as YESTERDAYS actual trading is concerned, a few thoughts from a desk,
MSs Global Macro Commentary: 1m T-bills cheapen 11bp before debt-limit meeting; Canadian rates bear-flatten amid confidence in Canadian financial system; EUR weakness drives EUR/SEK reversal lower; WTI crude extends gains on plans to refill SPR; Fed's Goolsbee says Fed should be "extra mindful"; US 10y at 3.502% (+3.9bp).
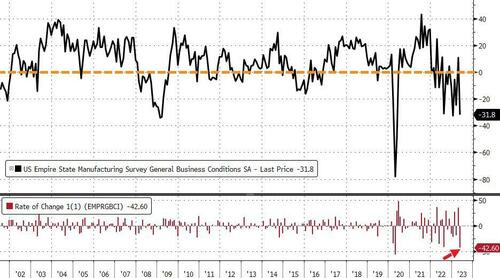
AND speaking of YESTERDAY, courtesy of ZH, some data CONTEXT,
After the stunningly surprising upside surge in April, The Empire Fed Manufacturing Survey has collapsed back to reality in May, crashing 42.6 points to -31.8 from +10.8 (dramatically worse than the -19.0 expected). Outside of the COVID lockdowns, this is the biggest MoM drop ever...
Back TO the Global Wall St inbox where we all learned some,
I have been lucky enough to have participated in the financial markets for nearly 40 years. During that time, I have witnessed interest rates range from double digits to negative. I have been through many recessions as well as a couple of wars. I have seen the financial system crash at least two times. In all those instances I learned firsthand that the bond market gets it right long before the equity markets do. In all those instances the U.S. Treasury yield curve served as an early warning signal. A type of “canary in the coalmine,” if you will. However, I have never seen a yield curve so BOLD in its warning of a coming economic downturn. The severity of the current inversion is so pronounced and massive that I cannot see any other outcome than a very difficult economic recession that is likely now upon us…
…What does the best evidence tell us about the future of the economy? Is the shape of the yield curve still the best indicator of the health of the economy? Could it be different this time? Courtesy of Bank of America, here are some “fun facts” about the current ultra inversion of the U.S. Treasury yield curve:
The yield curve has been inverted for over six months. The last time that happened was in 1981.
In the past 100 years the current 170bps (basis points) of inversion in the 3-month vs 10-year (3m10yr) yield curve has been exceeded on just 125 days. See chart below:
Ten recessions in the U.S. since 1957; each was preceded by tight monetary policy and inversion of the 3m10yr and/or 2yr10yr curve.
On average, a U.S. recession has started six months after inversion of the 3m10yr curve and 11 months after the 2yr10yr curve.
In this cycle, the 3m10yr inverted in November 2022, so using the timeline above, the recession should have begun in April 2023 (last month). The 2yr10yr inverted in July 2022, which projects a recession will begin in May 2023 (this month).
Inverted yield curves signal recession, but once the recession begins the yield curve immediately steepens as markets discount the Fed’s policy response to a recession. The 2yr10yr peaked inversion at -108bps in April.
The 2yr10yr curve has STEEPENED 60bps since March 8 (Silicon Valley Bank collapse) but remains around 54bp inverted. In contrast the 3mo10yr curve has barely steepened. If the 3m10yr curve steepens in the next few weeks that would corroborate a recession now.
The speed of the yield curve steepening was quick in disinflationary cycles (1990s–2020). It was much slower in inflationary cycles (1970s–1980s). If a recession is imminent, the ongoing inversion of the 2yr10yr (rather than positively sloped) strongly suggests this is an inflationary cycle and fits with “sell the last rate hike.” …
… The moral to this story is that the significant weight of the evidence — which has been a reliable indication of what is to come — points squarely at recession. Credit and equities get punished in recessions. We don’t suggest market timing, but we believe you should consider tilting your asset allocation defensive with high quality companies that have defensible profit margins.
I’ve not had the distinct pleasure of 40yrs of financial service but … 30. And I too have a hard time seeing the economic glass as half full BUT … we all know how the Fed policy operates and with those long and variable lags of time, we’ll have to wait for further evidence before buying into rate CUTS.
But wait, perhaps there are some messages in the tea leaves known as the CHARTS.
The world is full of economic concerns. Inflation, economic slowdown, global trade, and international war.
So what’s next?
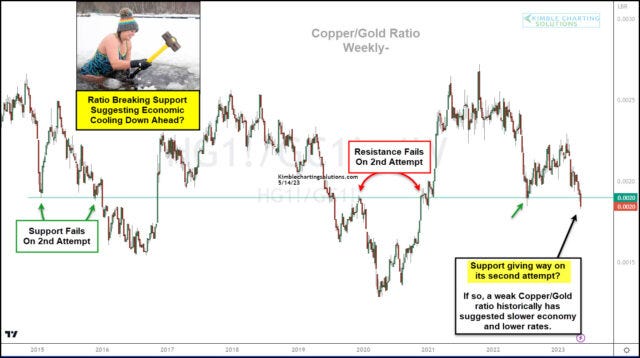
Today’s chart might just might share a glimpse into the future. Below is a “weekly” chart of the Copper to Gold price ratio.
Typically, when this ratio is rising, the economy is strong and interest rates are firm to rising. But when its falling, there is a great degree of economic uncertainty and rates tend to follow lower.
Recently, the Copper to Gold ratio closed below the lows of last year.
If history is a guide, a break of support here would suggest a lower risk of inflation and higher odds of interest rates falling. And perhaps an uncertain economy as well.
Not new news but … interesting food for thought as IS the latest from Mr. Stocks for the Long Run,
Prof. Siegel: Summarizing, I Remain Cautious on the Markets
… What raised my eyebrows last week was jobless claims, which broke out higher and 20,000 job losses over expectation and the highest in well over a year. Jobless claims are the earliest real indicator for the economy. This is also a notoriously volatile indicator, so we need to see a string of elevated jobless claim reports to confirm a trend.
But my sense is the labor market will weaken and this is the key data the Fed needs to see to pivot and end the rate hiking cycle. Specifically, negative payrolls reports and a tick up in unemployment rate should halt the Fed. But in general, jobs reports are becoming more important than the inflation reports for anticipating rate policy. The Fed has a formal dual mandate, and we are getting into political season and pressure on the Fed will mount—it is already facing criticisms from Democrats.
I was a little surprised by Friday’s University of Michigan consumer sentiment data. It is a well-regarded sentiment and inflation indicator and there was a drop way below expectations for consumer sentiment. It did not drop as low as last year, but it is still moving down. What was not good for the Fed was that long-term inflation expectations ticked higher-and I think that sent bond yields higher in Friday’s trading…
… Bottom line: Treasury bill yields are elevated. It is not a good sign credit default swaps were showing a higher risk on U.S. government debt than that of Brazil. But we are 99 to 1 odds the U.S. government will not default on its debt.
… Summarizing my views: I remain cautious on the markets. Value stocks are also taking hits from fears of further fallout from the regional banking failures. I think tightening lending restrictions will further crimp the economy. The market is positioning for a mild recession and certainly there is risk it could deteriorate further until the Fed really pivots towards cutting rates.
Finally, another from ZH which I couldn’t resist passing along this one as it checks today’s box of learning something new …
Higher bond yields are an increasingly likely prospect as rising inflation expectations push bond holders to demand an extra premium to lend money.
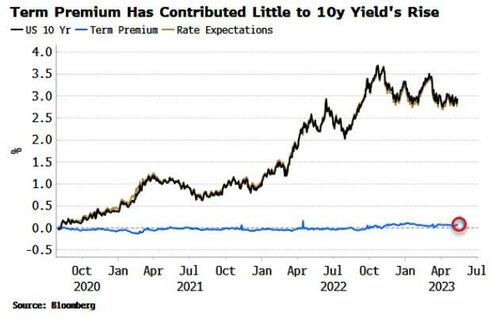
It’s been a testament to the Fed’s inflation-fighting credibility that - despite almost double-digit CPI - bond yields have not risen even more. The central bank’s own two-year forecast for PCE inflation never got above 3%, and based on the behavior of term premium – the extra yield bond holders demand above what is implied by long-run rate expectations – the market has taken the Fed at its word.
Since bond yields bottomed in August 2020, virtually the entire rise has been accounted for by expectations of Fed rate increases.
But bondholders’ benefit of the doubt may not last much longer. Friday saw the release of the latest University of Michigan data on consumers’ inflation expectations. The median 5-10 year inflation expectation rose to 3.2% from 3% last month, a 30-year high apart from a brief blip during the GFC in 2009.
The rise in long-run inflation expectations to cycle highs despite CPI peaking almost a year ago is a reminder that inflation indices capture the price move when it happens, but consumers don’t experience the inflation until they actually make a purchase. Many purchases are made irregularly so consumers are just beginning to “feel” inflation.
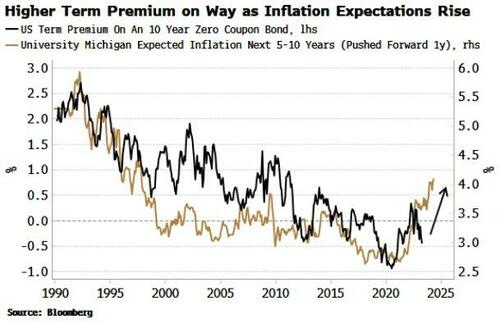
This is a problem as rising inflation expectations risk inflation becoming unanchored. That’s when bond holders begin to notice. The chart below shows that longer-term inflation expectations lead term premium by about a year, and anticipates the latter should soon start rising.
This is one of several reasons (discussed here) to expect higher bond yields in the coming months.
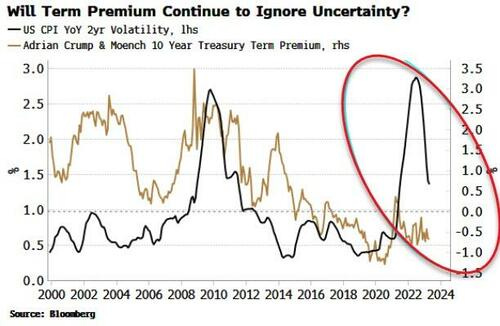
Higher inflation is big source of uncertainty, not just for markets, but for investment and for consumption. Fed surveys are pointing to a drop-off in capex, while the Katona Effect describes how consumers tend to save more and spend less when volatility of inflation high.
Term premium, too, tends to rise when inflation vol rises, but so far it has not responded.
But rising inflation expectations and a greater risk of unanchored inflation may soon have something to say about this.


Nothing quite like a 'McDowells' burger lol; did Louis Anderson ever get the night-shift Assistant Manager gig I wonders!