(USTs are higher, flatter on above avg volumes)while WE slept; shooting stars, new BUND targets and dismal scientists say ...
Good morning … a big week ahead with JPOW testimony (2x — good luck bidding on 3yr USTs tomorrow), NFP and then chased by next weeks CPI … Lets jump right in with a look at 10yy
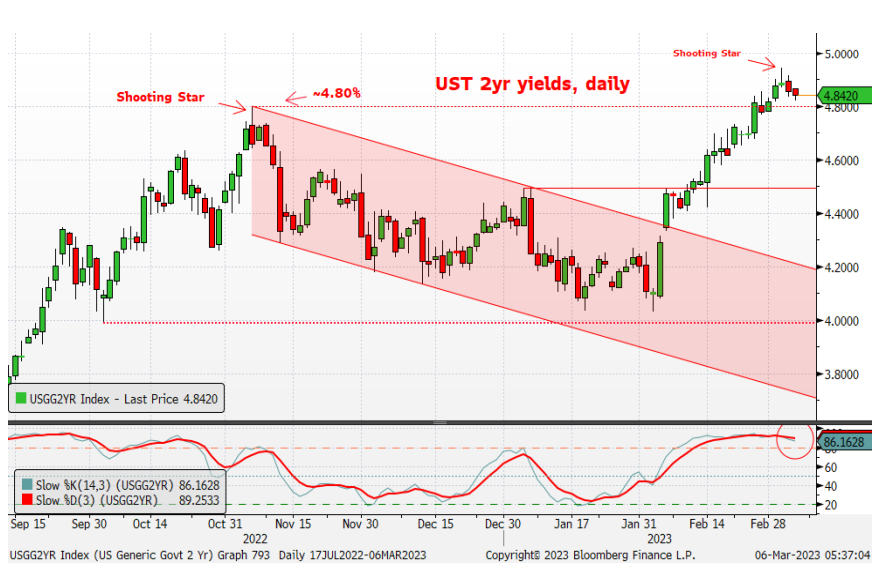
NOTE — MOMENTUM (slow stochastics, bottom panel) bullish cross and I’ve left in September peak for good measure and noted 40dMA (3.672) as an inflection point of sorts…here is a snapshot OF USTs as of 705a:
… HERE is what another shop says be behind the price action overnight…
… WHILE YOU SLEPT
Treasuries are higher and the curve flatter again this morning as a deep tactical short base weighs on US and especially outperforming EGB yields this morning. DXY is modestly higher (+0.13%) while front WTI futures are lower (-1.55%). Asian stocks were mixed (China names) to higher, EU and UK share markets are slightly higher on balance while ES futures are showing UNCHD here at 6:45am. Our overnight US rates flows saw a firm tone for Treasuries during Asian hours though volumes were light with some real$ buying in intermediates and the long-end noted. Our London morning session was busy with better buying overall (long-end especially). Overnight Treasury volume was decent at ~125% of average with 30yrs (192%) seeing well-above average turnover this morning, matching our flows.… The Shooting Star trend exhaustion signal that Tsy 2yrs traced out Thursday at the move high in yields (4.941% according to BBG) was a classic sign of ‘too far, too fast.’ Moreover, Friday’s daily momentum flip (lower panel, below) hints of a locally bullish skew of risks now." So it's our best guess that Treasuries will show an on-balance bullish bias from now to Friday's NFP print on the presumption that 1-way [ tactical short] positioning needs to find a better balance ahead of key events. Our first attachment this morning looks at this set-up in Tsy 2yrs. You can see that a so-called Shooting Star trend exhaustion candle stopped the bleeding in 2's in early November just as it appeared to do the same late last week. In the lower panel you can also see how our favored daily momentum oscillator (Slow Stochastics) has now flipped bullishly and the uptrend in the one-month, straight-shot move to higher 2y yields appears breaking trend now too...
… and for some MORE of the news you can use » IGMs Press Picks for today (06 MAR) to help weed thru the noise (some of which can be found over here at Finviz).
From some of the news to some VIEWS you might be able to use. First, HERE is what Global Wall St SAID over the weekend. And as far as what has arrived in the narrative inbox since, well,
DB offering some context of past month or so of trading in an early morning RIED
… So there's a sprint to my step as we start a busy 8 days for markets, culminating in the US CPI next Tuesday after payrolls this Friday. It's fairly uncontroversial to say that the last payrolls report published on February 3rd was a huge moment, and one that started a series of events that has meant that the last month has been a struggle for most financial assets, especially bonds (the worst February on record for the Global Agg). Remember that 36 hours before that payroll print, the relatively "dovish" FOMC had led to 10yr US yields hitting 3.33%. Last week at their peak they hit 4.08% before closing out at 3.95% on Friday.
As such if you thought the relatively random number generator that is payrolls is usually overhyped, you've seen nothing yet as we approach Friday's big number. For those who have been on a sabbatical to another planet, last month it came in at +517k against +223k expected with fairly substantial upward revisions from the previous year as part of the annual review…
NWM offering,
… A new bund yield target: 3.25% by summer. It has been a very bearish week for global rates and European rates especially – so much so we need a new target for long-end rates. We now think 10y bunds can reach a yield of 3.25% this summer.
… What does our bund model have to say about the overall balance? As a reminder, our model is simple: it looks purely at the level and slope of the money market curve, and bond stock and flow. The rather alarming picture is shown below. Our projections for bond supply are conservative, we think, and our projections for the ECB are below market pricing, in line with our view that the market is too pessimistic about the point where the ECB will pause it’s tightening of the policy rate. We don’t suggest that 4% is a reasonable target at this point, despite the model output. But the trajectory makes a clear statement about the skew of risks. We target 3.25% this summer.
Bund fair value (forecast in orange, realised in blue)
As goes BUNDS, so goes USTs … or is it the other way ‘round?
From bunds to Global MACRO where a large British operation out with a Monday morning note,
'Even higher, and for even longer', and it might still not be enough
The bond-equity correlation went askew last week, with stocks rallying despite bond yields near 2023 highs. The Powell testimony to Congress and China’s disappointing growth target should pressure risk assets lower this week, as we await Kuroda’s last BoJ meeting and Friday’s US payroll report.
… We recommend investors position for a drop in risk assets going into this week
Okie dokie … AND turning back TO a note from head dismal science at MS,
The Weekly Worldview: Simultaneous Tightening, Different Effects?
The outcome of the hiking cycle for the real economy is less in doubt than the amount of hiking that will be required to bring it about.… For the US, since the start of the Fed’s tightening cycle last year, the channels of the economy that are usually sensitive to a change in interest rates have responded, for the most part, as expected. Housing starts and sales fell sharply as mortgage rates rose, and consumer spending on durable goods has fallen with higher financing rates. Overall consumption has been buoyed, however, as spending on services is only now returning to historical norms with regard to income. For business investment, there has been material weakening in structures investment and a recent decline in equipment investment. But post-pandemic, businesses outside of tech were initially very cautious in re-hiring workers. As the recovery continued, despite slowing in parts of the economy, catching up in hiring has meant job gains that are stronger than would normally be the case …
Modeled effect on real output from FFR Path
Moving on with this weekly update on stocks from MS,
Technical Update and Analysis of Accruals that Supports Our Earnings Forecast
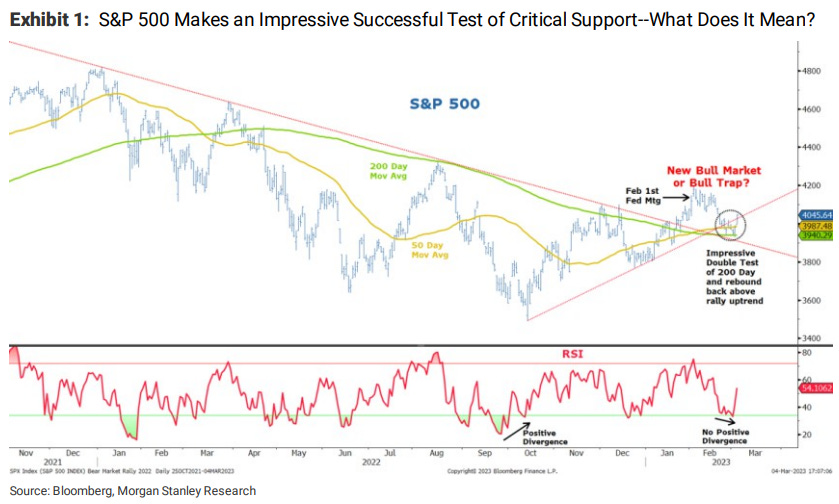
Equity markets survived a crucial test of support last week that suggests this bear market rally is not ready to end just yet. However, our GVAT team's analysis of accruals strongly supports our view that earnings estimates remain far too high; and therefore, the bear market is not over.… First, while our comments will focus on the S&P 500, these observations apply to most of the other major indices as well--i.e., the Nasdaq, Russell 2000 and the Dow Industrials, which remains the weakest of the bunch, in our view.First, in Exhibit 1 one can see that the key support was tested severely over the past few weeks but on Friday, the market reacted strongly around the second test. We have to respect that successful test and now need to try and decide what it means.
… The other thing we are watching closely from a technical standpoint is the longer term uptrend that began after the GFC in 2009. We showed this trendline in prior notes and continue to think it is critical that the S&P 500 get back above it to confirm a new bull market. As shown in Exhibit 2, this trendline has provided critical resistance and support over the past 14 years during this secular bull market. More recently, ithas been more of a resistance line and that level comes in today at around 4150. While we think the S&P 500 could make another attempt at this key resistance, it will require 2things in particular to surmount it--lower 10-year US Treasury yields and a weaker dollar. In fact, we think Friday's sharp fall in 10-year yields was an important driver of Friday's bounce in stocks.
Finally, in conclusion, an update from Dr Ed BOND VIGILANTE Yardeni on the economic week (month)ahead,
The Economic Week Ahead, March 5-10
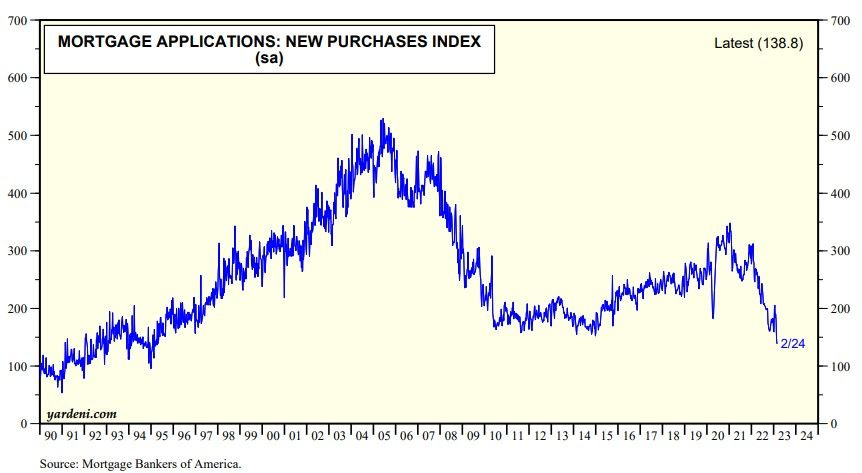
… The week's housing indicators should show that housing affordability (Fri) improved during January, but the rebound in mortgage rates since then probably further depressed mortgage applications to purchase a house during the March 3 week (chart).
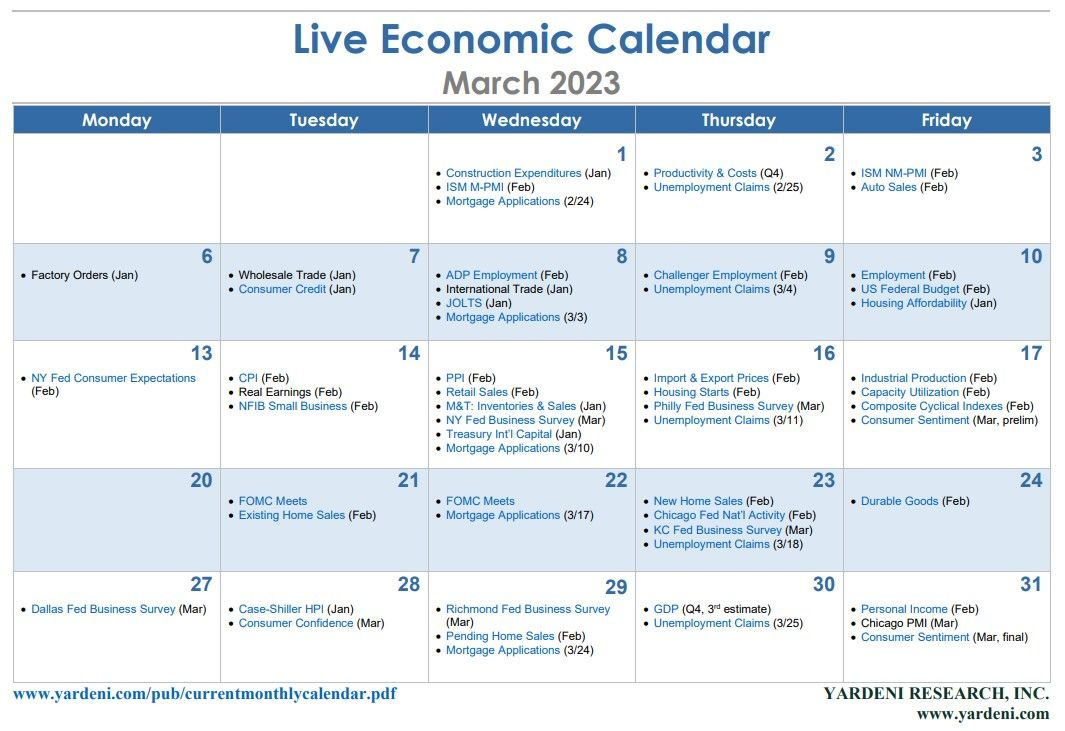
Stock and bond prices will fall if the week's employment reports are deemed to be too strong. Weak numbers would temper the Fed's monetary tightening, which would be bullish for stocks and bonds. The employment reports will signal whether the data coming out during the following week might be stronger or weaker than expected. Then the FOMC meets March 21 and 22 and will hike the federal funds rate by 25bps or 50bps depending on whether the batch of economic indicators over the next two weeks will be surprisingly strong or weak. We are in the 25bps camp for now.
Our hunch is that the data will be sufficiently mixed so that we all will be playing this same game again next month. Sideways volatility is more likely than a big move up or down, in our opinion.
… THAT is all for now. Off to the day job…


https://youtu.be/pbj3BlZGxcg