(USTs are HIGHER and the curve 'modestly flatter' on above average volumes)while WE slept; large short base meet '4pm is the new 3pm' (Oprah, Uma. Uma. Oprah...)
… The internals were also average, with Indirects (foreign buyers) awarded 64.11%, above the 63.2% in March but below the recent average of 66.5% …
Truth be told, markets seem to ME to be directionless (I suppose waiting for the next or another shoe to drop which would then spur some sort of BID or flight to safety). Here’s a chart of 10yy as we begin the end of the week and month,
40dMA (3.54) remains ‘support’ and downward slowing, momentum (stochastics, bottom panel) are muddling BUT appear to have crossed bullishly from uncompelling levels and this as we are literally on top of a TLINE trending higher and so, resistance.
… HEREis what this shop says be behind the price action overnight…
… WHILE YOU SLEPT Treasuries are higher and the curve is modestly flatter after the BOJ meeting (see above), mixed inflation data (Japan's strong, EU's generally below estimates) and a growth disappointment in Germany have left JGB's and EGB's leading Treasury prices higher this morning. DXY is higher (+0.5%) while front WTI futures are little changed. Asian stocks were generally paced higher by Japan (NKY +1.4%), EU and UK share markets are lower (SX5E -1%, SX7E -2.9%) and ES futures are showing -0.4% here at 6:50am. Our overnight US rates flows saw a choppy Asian session as BOJ headlines dribbled out and the algos went wild in both directions. We saw better selling on upticks in intermediates and the long-end with Asia's volumes showing a sharp improvement after 2 weeks in the doldrums turnover-wise. Indeed, including London's AM hours... our overnight Treasury volume tracker shows ~150% of average volume with relatively elevated turnover seen in 7yrs (260%) after their auction yesterday.
… and for some MORE of the news you can use » IGMs Press Picks for today (28 APR) to help weed thru the noise (some of which can be found over here at Finviz).
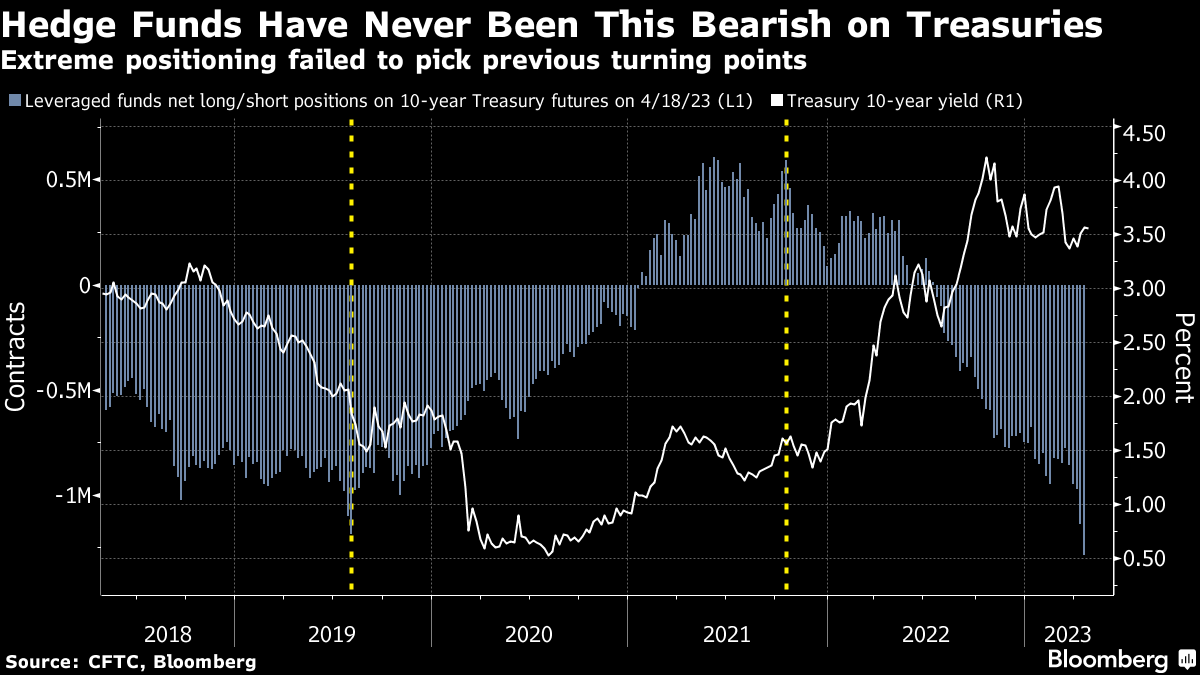
Before jumping in to Global Wall St inbox, cannot help but point out from BBG via ZH an important hit ahead of next weeks FOMC
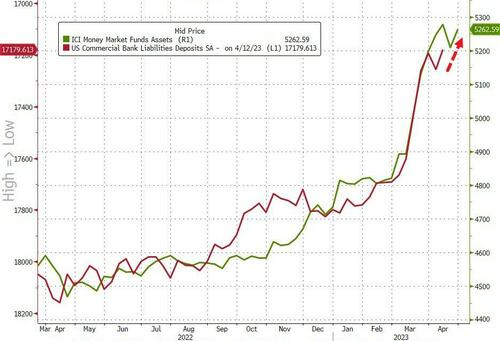
Following the unexpected OUTFLOW the previous week, this week saw money market funds resume their trend with a $53.8 billion INFLOW...
Source: Bloomberg
The breakdown was $48.9 billion from Institutional funds and $4.98 billion from retail funds.
That pushed assets back up near their $5.277 trillion record high and suggests last week's deposit OUTFLOWS may be about to re-accelerate - not good news for banks?
Source: Bloomberg
On top of the news from First Republic this week, one could argue that Round 2 of the banking crisis (bank superwalk as Jim Bianco has put it) is just beginning.
Bear in mind though that it's tax-time and their are some odd seasonal impacts to the data…
From some of the news to some of THE VIEWS you might be able to use… here’s what Global Wall St is sayin’ …
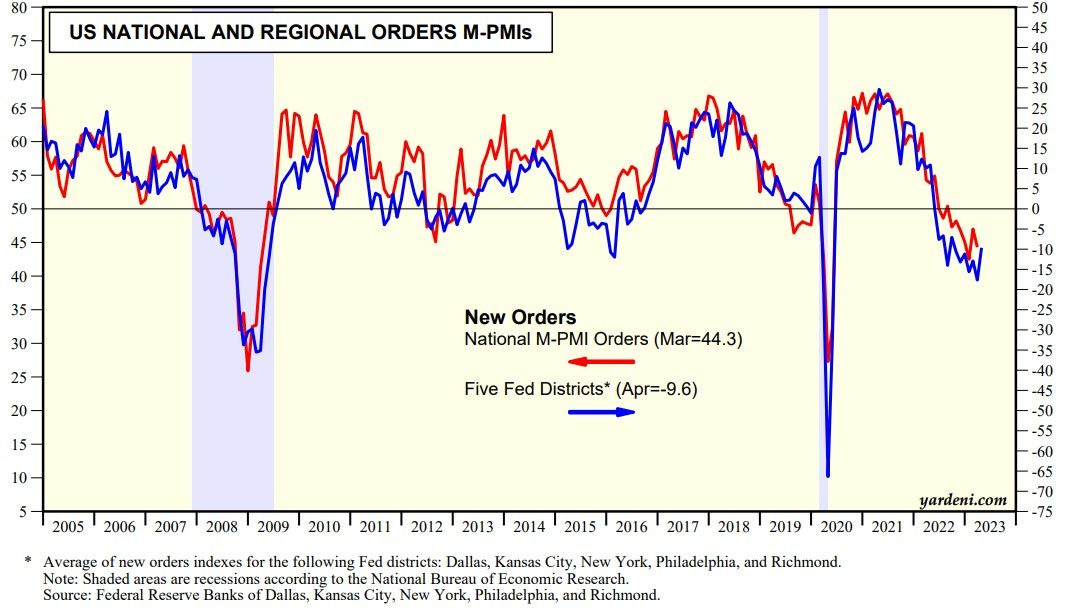
… April's average of the new orders indexes compiled in the regional surveys conducted by five Federal Reserve Banks rose in April suggesting that orders may be bottoming. If so, then inventories should be a positive contributor to real GDP during Q2.
Real GDP grew 1.1% at an annualized rate in Q1-2023 relative to the previous quarter, which was weaker than the consensus forecast.
Real consumer spending rose at a solid rate of 3.7%. But, a significant inventory swing sliced 2.3 percentage points off of the headline real GDP growth rate. The other spending components were mixed.
Monthly data suggest that consumer spending has lost momentum over the past few months. Moreover, consumers are relying increasingly on credit and stockpiled cash to finance their purchases. These factors are not sustainable, in our view.
We continue to forecast that the U.S. economy to slip into recession, which we expect will be of moderate severity, in the second half of the year.
Moving along to some more uplifting and positive news, Rich Bernstein
… Historically, investors have been better off remaining dispassionate and objective during such hyperbolic periods. A clear-eyed review of history and of fundamental data will likely be investors’ best guides to maintaining portfolio sanity during these…ahem…unprecedented times.
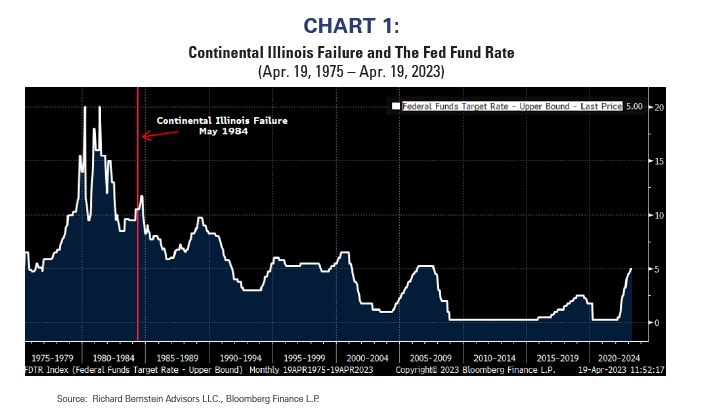
… The first major bank failure during my career was Continental Illinois in 1984. Continental Illinois was the 7th largest US bank at the time, and their bailout initiated the phrase “too big to fail." As financial theory might have suggested, the bank’s failure came after the Fed raised interest rates (See Chart 1).
… As one can see in Chart 2, the yield curve (defined as the spread between the 10-Year T-Note and the 2-Year T-Note) inverted in July 2022. Accordingly, we quickly reduced our regional bank exposure in July, and then broadly moved to a significant underweight in November 2022 as the yield curve reached historic levels of inversion.
…Henny Penny (a.k.a Chicken Little) is perhaps the most famous hyperbolic news person, but many have claimed in various forms that the end is near. Today’s Henny Pennies decry the end of banking, the end of capitalism, or the end of virtually anything. That’s not reality. This isn’t the first banking crisis in US history and it won’t be the last.
Investors who listen to Henny Penny seem likely to both over-assess the risks within the market and miss future opportunities. Rather than structuring portfolios against any risk that could ever occur, the key to rational investing is following an intellectually sound and well-tested investment process.
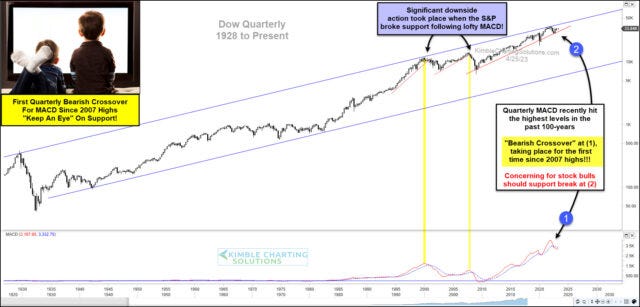
Henny Penny, eh? on THAT — chicken little’ish — note, a chart from Kimble,
The stock market bounce off last fall’s low has kept investors hopeful that the worst is over.
But a recent sell signal on the Dow Jones Industrial Average could upend those hopes… if support doesn’t hold.
Below is a long-term “quarterly” price chart of the Dow Jones Industrial Average. As you can see, this key stock market index has been in a long-term rising uptrend channel. And more recently been touching the upper boundary of that channel (resistance).
This resistance marked the last top for the Dow Industrials, and the subsequent sell-off has produced a sell signal on an important technical indicator — The quarterly MACD is crossing over, from the highest levels in history at (1). Yikes!
This bearish crossover will be extra concerning should another selloff begin here. If so, investors should turn their attention to the up-trend support line off the financial crisis lows at (2). This marks important technical support.
Support is support until broken!
In my humble opinion, this support level will be critically important for the Dow Industrials to hold. Stay tuned!
Trend is friend until it ends…!?
And in closing, an ‘official’ word on mortgage rate data from the St Louis Fed blog,
Point 1: Reported mortgage rates are high, but lower than their long-run average.
The red line in the FRED graph above shows reported 30-year fixed mortgage rates. We can see they’re quite a bit higher now than they were a year ago, but lower than they’ve been for more than half of their recorded history.
Point 2: These reported rates apply only to mortgage applications and don’t seem to have affected existing mortgages.
The blue line in the graph shows the proportion of income that households dedicate to mortgage servicing. The recent spike in rates doesn’t seem to have affected the interest load for current mortgages, given that the blue line has barely moved.
Again, these mortgage statistics describe new mortgages, not existing mortgages. Traditionally, mortgage data have come from surveying mortgage originators, asking them for the going rate of new first-lien, conforming, conventional mortgages issued to households with excellent credit and a 80% loan-to-value ratio. But since November 2022, administrative data from Freddie Mac’s underwriting system have been used instead of the survey data. These data include rates for mortgage applications, which may never be issued as actual mortgages. The results are very similar, but it is a broader sample being used. For more details, see this report.
Hopefully somewhat MORE over weekend. Have a GREAT start to the day and end of the week and month … THAT is all for now. Off to the day job…
was both germane and a tad confessional. The bank interest-rate risk 'problem' is more sticky than the Markets recent distraction with the ability of eight, mostly monopolies in the $SPX, to extract rents from the rest of the economy seams to imply. He 'links' to,
Pangs of Conscience for Mr. Levine? IDK, but, before I mounted my moral warhorse and sallied forth against the injustices built into The System I figured I'd better make sure my BXSL holding didn't have IntraFI on it's 'watch list' of loans performing below expectations or, heaven forbid, gone non-accrual rouge. By the time I was done CYA'ing with squire EDGAR, the old nag had wandered off, and we'd both lost our enthusiasm for another righteous campaign. In hindsight, I suppose it was foolish of me to worry about anyone finding IntraFI's fingerprints on Blackstone's publicly traded BXSL. That would of been an amateur move to leave that sort Wall Street prized linkage directly to The Regulators lying about in the open. What can I say? I've been told a loss hurts twice as much as gain feels good.
Anyway, it is probably Zero surprise to BondBeatists, but, it was only recently I became aware of how far back the "banking crisis" disputes "in US history" over whether to offer deposit protection or not goes. Like everything that powerful vested political and economic forces take enough interest in to lobby furiously over for the better part a of century, the current misunderstandings of those without skin in the game, are more or less oblivious to what came before.


Matt Levine covering FRC and Regulatory Arbitrage,
https://www.bloomberg.com/opinion/articles/2023-04-27/first-republic-is-in-limbo
was both germane and a tad confessional. The bank interest-rate risk 'problem' is more sticky than the Markets recent distraction with the ability of eight, mostly monopolies in the $SPX, to extract rents from the rest of the economy seams to imply. He 'links' to,
https://prospect.org/power/2023-04-25-intrafi-deposit-insurance-caps-lobbying/
Pangs of Conscience for Mr. Levine? IDK, but, before I mounted my moral warhorse and sallied forth against the injustices built into The System I figured I'd better make sure my BXSL holding didn't have IntraFI on it's 'watch list' of loans performing below expectations or, heaven forbid, gone non-accrual rouge. By the time I was done CYA'ing with squire EDGAR, the old nag had wandered off, and we'd both lost our enthusiasm for another righteous campaign. In hindsight, I suppose it was foolish of me to worry about anyone finding IntraFI's fingerprints on Blackstone's publicly traded BXSL. That would of been an amateur move to leave that sort Wall Street prized linkage directly to The Regulators lying about in the open. What can I say? I've been told a loss hurts twice as much as gain feels good.
https://prospect.org/power/2023-04-18-big-tech-lobbyists-took-over-washington/
Anyway, it is probably Zero surprise to BondBeatists, but, it was only recently I became aware of how far back the "banking crisis" disputes "in US history" over whether to offer deposit protection or not goes. Like everything that powerful vested political and economic forces take enough interest in to lobby furiously over for the better part a of century, the current misunderstandings of those without skin in the game, are more or less oblivious to what came before.
(link not paywalled, as in "free") https://www.crisesnotes.com/fdr-opposed-deposit-insurance-he-isnt-the-last-word-on-the-subject/
As it was Before, so it shall be After.