(USTs aggressively UNCH on above avg volumes) while WE slept; "Are Rates Too High? Too Low? Just Right? Depends on Who You Ask"; M2 where are you? Twist again?
First Republic shares closed down by half after it revealed deposits fell in the first quarter by more than $100bn to $104bn and that it is “pursuing strategic options” which a source told Reuters could be asset sales or the creation of a bad bank.
With 5yr Treasury auction on tap, I thought that might be a fine and dandy way to start us off,
ZH: Strong 2Y Auction Sends Yields To Session Lows One day after we predicted that a short squeeze was coming for bonds as a record number of shorts had emerged in 10Y TSY futures...
For somewhat MORE (and the other side of the ALL SELLERS / SHORT coin) see just below BUT … 5yy,
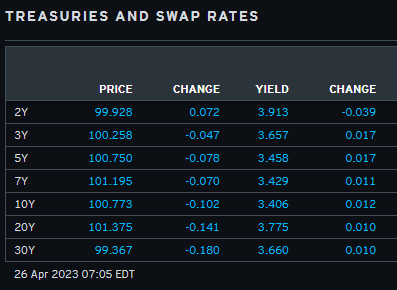
‘SUPPORT’ up nearer 40dMA (and TLINE) ~3.70 while it appears to ME we’re approaching RESISTANCE as momentum (stochastics, bottom panel) are edging into overBOUGHT territory which makes some sense as they are down approx 25bps SINCE previous auction (DB) … here is a snapshot OF USTs as of 705a:
… HERE is what this shop says be behind the price action overnight…
… WHILE YOU SLEPT Treasuries are little changed this morning on a light news/data day. DXY is lower (-0.55%) while front WTI futures are little changed. Asian stocks were mixed (SHCOMP unchanged), EU and UK share markets are all lower (SX5E -1%) while ES futures are showing +0.2% here at 7am. Our overnight US rates flows saw net real$ paying in the 2y-3y sector during Asian hours, a risk-off tone set the overall vibe during their hours. In London's morning, 2's opened cheaper but steadily recovered ground after with our flows seeing better fast$/systematic selling of the front end with the curve flattening in sympathy. Overnight TY futures volume was ~130% of their 10-day average.
… M2 money supply, MoM change: The YoY% drop in March was the largest on record but no doubt a reflection of base effects. That said, March's MoM drop in level was the biggest ever.
I’m sure it’s nothing … and for some MORE of the news you can use » IGMs Press Picks for today (26 APR) to help weed thru the noise (some of which can be found over here at Finviz).
From some of the news to some of THE VIEWS you might be able to use… here’s what Global Wall St is sayin’ …
First up a few words from a rather large German bank which is leaning on a late ‘80s analog,
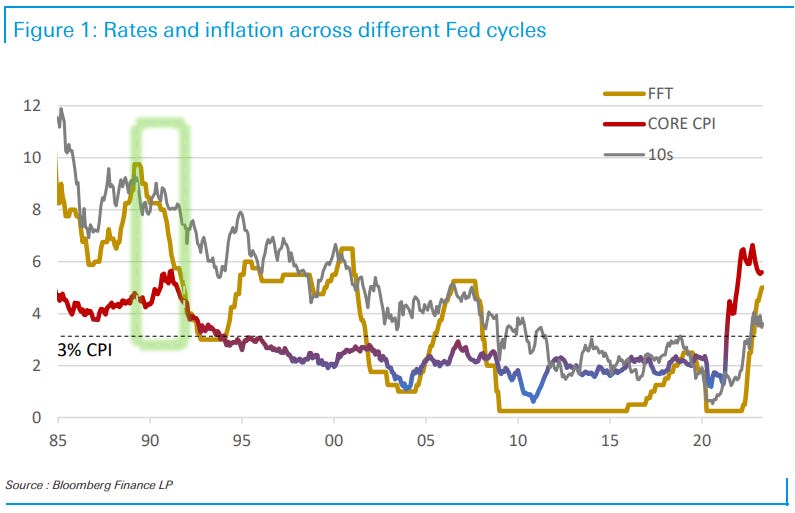
Median economists’ forecast for the end of the year sees 2Y UST substantially lower, in the low-3% handle, while 10s are expected to undergo little or no change as the market positions for rate cuts to commence in the early 2024. In the macro background, hardly anyone sees inflation below 3%, while unemployment should rise above 4%. This means that rate cuts, about 200bp for the entire 2024, are expected to take place while inflation is still relatively high above the target. In the recent past, whenever rate cuts took place, inflation had been below or around the 2% threshold (and well below 3%).
If the Fed starts with rate cuts with high inflation, there is a risk that it (inflation) might refuse to decline below its threshold and that, as a result, the long end of the curve begins to price in a higher inflation risk premium. This is precisely what happened in the late 1980s. The Figure shows last 38 years of history of Fed funds, inflation, unemployment, and 10Y UST yield (the horizontal dashed line corresponds to the 3% core inflation level).
The firm goes on to note the last time Fed CUT RATES with inflation ABOVE 3% (late 80s — highlighted) and between mid 89 and mid 90, 10yy rose ~100bps (7.8 to 8.8)…CPI went from 4.25 up to 5.2 and econ slowed. IF this happens again, we very well COULD see support for additional steepening which frankly, is NOT PRICED by forwards. Throw in rate CUTS and we’ve gotta twist again like we did a few summers ago…
With THAT in mind, a more TOPICAL question asked / answered,
LPL: Are Rates Too High? Too Low? Just Right? Depends on Who You Ask
… As discussed in a recent Bloomberg article, leveraged funds, aka hedge funds, have recently put on the largest short position ever in Treasury futures in a bet that rates will rise from current levels. Asset managers and other institutional investors, however, still hold near the most 10-year futures contracts ever. Moreover, recent data shows that international investors, particularly Japanese investors, have started to reengage in the U.S. Treasury market as well, with the expectation that yields are past peak levels. To be fair, these positions could be part of a broader trade or outright hedges and not necessarily a bet on the direction of interest rates. But nonetheless, positioning seems to be at odds.
AND for those of us who are visual learners, a weekly walk through macro guided by a large (and now merged) Swiss operation noting,
Equity markets globally are showing signs of stalling at key resistance levels, with daily and weekly momentum in many cases showing clear bearish divergences and we look for a cap here and for markets to turn lower, in line with further “risk off” signs we are seeing elsewhere…
… Our main concern as noted previously in looking for the market to weaken is the extreme net short seen in S&P 500 E-mini positioning, which is now at its most net short levels since 2011…
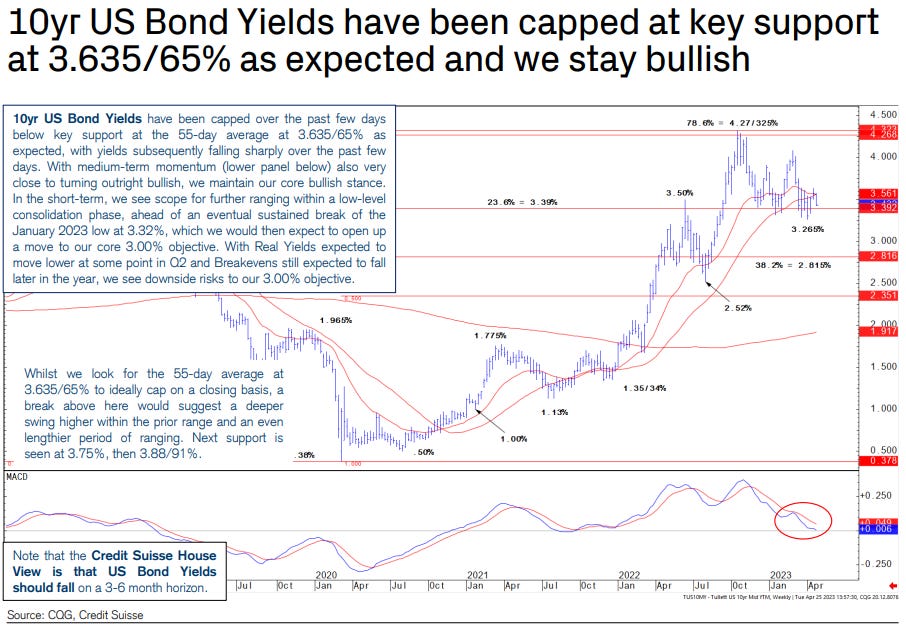
… 10yr US Bond Yields have held key support at 3.635/65% and are turning lower, with scope for further short-term ranging ahead, of an eventual move to our 3.00% objective. 10yr US Real Yields are also expected to break 1.00% in Q2.
A couple from the ivory tower / dismal scientists. First, from MSs econ dept,
INSIGHT: Economics, Technology & Public Policy: The Great Productivity Race
After an extended period of sluggish growth, we think productivity is poised to rebound. Tight labor markets and supply chain disruption in the multipolar world make higher productivity an imperative. Our economists and industrials teams show how technology diffusion can drive change.
… Public policy is adding to labor scarcity… … IT spending indicators remain robust… … We introduce a proprietary framework to identify the haves and have-nots in the quest for a productivity edge in manufacturing…
With economics being the dismal science that it is, Bloomberg recently attempted to highlight,
… The mechanism through which policy is translated into economic activity, and hence into controlling inflation can be modelled as the schematic below shows.
While this short note was specifically tailored TO UK mortgage rates and impact of the bank rate, I think it is worth considering … especially as we enter summer months with banking crisis return over past couple / few days AND as we enter period of time where clowns in DC start negotiating the debt limit…
AND with some XDATE update yesterday, likely a reminder as to WHY we (yes, i’m including my former inner bond guy self in that camp) care …
ZH: Debt Ceiling Brings Early Fed Cuts Back To The Table Authored by Simon White, Bloomberg macro strategist,
The prospect of
Federal Reserve
rate cuts in the near term will be back on the agenda as the debt-ceiling impasse causes a further tightening in financial and credit conditions.
Hot on the heels of the banking crisis is the market’s next preoccupation: the debt ceiling. Until the political gridlock is broken, the US is ineluctably moving toward “X-Day”: the day when the ceiling is reached, all “extraordinary measures” have been exhausted, and the Treasury is no longer able to pay its obligations.
There is never a good time for the US to be at risk of running out of money, but now is especially unwelcome. Credit conditions and velocity were already tightening in the wake of SVB’s bankruptcy. The prospect of a heated political drama that’s set to go to the wire will only accelerate these trends and raise the probability of an early Fed cut, i.e. before the market’s current expectation of December.
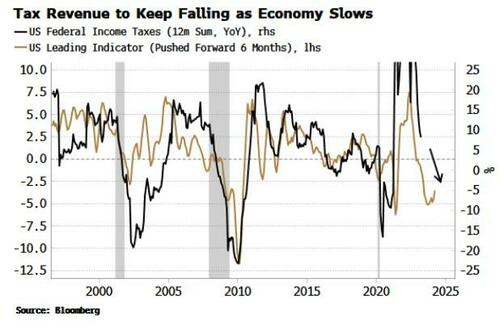
Tracking the evolution of reserves, taxes and bank deposits will be crucial to understanding the risks from the looming debt ceiling.
The two main scenarios are:
More taxes are received than anticipated, which will push back X-Day. However, this will put extra strain on reserves through a drop in bank deposits, where growth has fallen to a 40-year low
Less taxes are paid than expected and this brings forward X-Day, leaving less time to reach a political solution to raise the ceiling
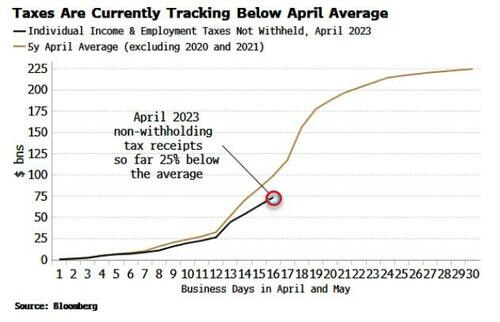
So far it looks like the latter of these is transpiring, with April non-withholding tax receipts a quarter lower than their five-year average.
The disappointing inflow to the Treasury’s coffers has prompted Goldman Sachs to estimate that X-Day could occur as soon as early June.
June may even prove conservative, given that very weak leading indicators point to tax-revenue growth continuing to fall and potentially soon contracting.
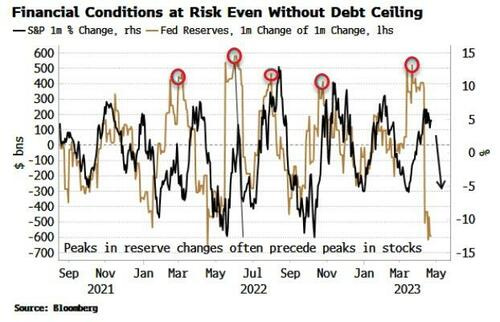
This should mean less pressure on bank deposits and thus reserves - but it may not be enough. Reserves are already very stressed, with their “impulse”, i.e. the change in their change, having just dropped precipitously. This points to weaker equities and tighter financial conditions even without higher-than-expected tax payments.
Worsening liquidity conditions and significant event risk coming ever closer is a decidedly negative set of circumstances.
Yet despite this, there seems to be a general consensus that
a) the debt ceiling will be avoided; and
b) the uncertainty in the run up to X-Day is unlikely to have a notable market impact.
Both views are complacent.
On the first, nobody knows for sure if the US will avoid the debt ceiling becoming binding, but the political parties are further apart than they were in prior debt-ceiling episodes, so it is perhaps wishful thinking there will be an early resolution. And there is a greater – even if it is still small – chance that no agreement at all is reached.
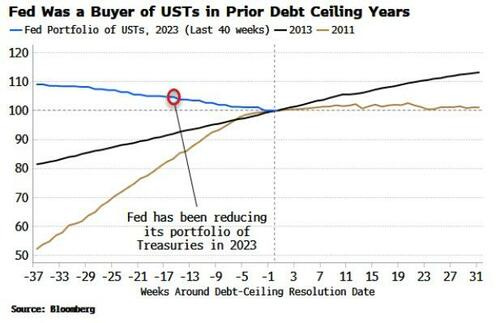
On the second outlook, the economic and financial backdrop is very different today than it was in 2011 and 2013, the last two times the debt ceiling was a live issue:
Reserves were rising as QE, not QT, was the prevailing Fed policy;
The RRP facility did not exist in its present form; and
The Treasury’s account at the Fed (TGA) was on average much lower than it is today.
In 2011 and 2013 we did not get a significant rise in longer-term yields. However, in both cases the Fed was not contracting its balance sheet. Fed reserves were rising in the run-up to the resolution date as the Fed bought Treasuries, unlike today where its portfolio of USTs is contracting.
There is no guarantee longer-term yields will not flare up this time. This would further tighten credit conditions, which are already suffering as primarily smaller banks pull back on lending in the aftermath of SVB’s failure.
Some shorter-term bill yields have already risen to reflect higher default risk. (Although the Treasury would not have to default on bonds, it would have to so on bills given they are issued below par, but paid back at par, leaving a capital mismatch. Bonds are issued and redeemed at par).
This will be a further incentive for money-market funds to use the RRP, which is a drain on reserves and thus velocity.
The RRP currently sits a smidgen below its all-time high at $2.67 trillion and shows no signs of falling. Reserves are also being drained by the TGA, which is rising as taxes are received.
The debt ceiling - coming in the wake of banking stress and a slowing economy - may just be the proverbial straw that breaks the camel’s back. Even if this does not lead to an actual earlier-than-expected rate cut from the Fed, market pricing is likely to soon reflect this likelihood as the political drama heats up. In other words, two-year yields look like they have little upside above 4.20%-4.30%, but plenty of downside.
AND have a great start as you plan your trades and trade your plans …