As far as parsing verbage and going from the potential PIVOT acknowledged in the statement TO anything BUT in the presser, well … somewhat more of that just below BUT … certainly will make today’s show brought to us by the letters, “BoE” somewhat MORE funtertaining, no? Over to you? Good luck to ya…
… here is a snapshot OF USTs as of 700a:
… HEREis what another shop says be behind the price action overnight…
… WHILE YOU SLEPT Treasuries extended their post-FOMC losses overnight with other central banks following the Fed with their own hikes and USD rising sharply. DXY is indeed +1.5% while front WTI futures are lower too (-1.6%). Asian stocks were generally lower (Nikkei little-changed), EU and UK share markets are all in the red (SX5E -1.15%) while ES futures are showing -0.65% here at 6:45am. Our overnight US rates flows were unavailable but some FV and TY block sales were posted overnight along with a 1.5k US block sale(?) just a few minutes ago. Overnight Treasury volume was surprisingly tame at ~80% of average all across the curve.
… With so much ground level noise, we're going to use today's first four attachments to illustrate the long-term messages in duration (10's), real rates (30yrs), curve (2s10s) and curvature (2s5s10s). We'll do this as we write and before looking we'd guess that the messages remain largely the same as they've been in recent months: mature or maturing bear market trends that show no threats of reversals yet despite long-term momentum set-ups today that have often preceded macro trend reversals in the past. So let's have a look, in order:
The monthly chart of Treasury 10's shows a still-evolving breakout above the 4.00% support area (twin rate peaks from 2009 and 2010). If you squint, long-term momentum aims bearishly again but from a deep 'oversold' condition- looking very late-2018-like in the overall set-up. The area near 4.30% (2008 high 4.275% and the October 21st high 4.335%) appears to be your next support area. It will be interesting to see if the breakout >4% is confirmed/sustained by this month's close- as seems increasingly likely.
… and for some MORE of the news you can use » IGMs Press Picks for today (3 NOV) to help weed thru the noise (some of which can be found over here at Finviz).
In the wake of markets reflex TO the Fed and its presser, a few links / things I found interesting.
Federal Reserve Chair Powell’s communication confused markets. A slower pace of rate hikes with a hint that tightening could slow before inflation fell dramatically seems dovish. But Powell channelled 1920s New York Governor Strong with promises of a higher terminal fed funds rate. Markets eventually focused on the hawkish tone.
The Federal Reserve comprehensively trashed forward guidance in the June policy errors. As such, the future policy promises should be treated with caution. A more dramatic slowdown, or a more rapid drop in inflation, could make the terminal rate talk meaningless…
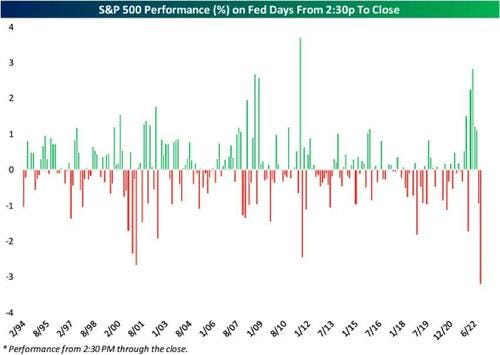
… The statement came out at 2 p.m. on the Eastern seaboard. As Chair Jerome Powell’s press conference began 30 minutes later, the S&P 500 was sitting on a gain of above 1% for the day. By the close of trading, it was down almost 2.5% after withstanding an intra-day selloff of 3.4%:
What did Powell say to cause such offense? The following comment came early on:
We still have some ways to go. And incoming data since our last meeting suggests that the ultimate level of interest rates will be higher than previously expected.
He ALSO shows how it was the UGLIEST FED DAY SINCE 2021
Fed aside there was one thing offered out to Global Wall Street’s inbox before hand which caught my attention and actually made me smile … the suggestion that,
Fixed income and equities have been clobbered by persistently high inflation this year. A US investor with a standard 60/40 portfolio is down about 20%. A non-US investor with a similar portfolio, however, will be down significantly less to the extent that she left the FX exposure unhedged. Indeed, as our colleague noted before, the losses on a standard 60/40 portfolio this year have been closely mirrored by the gains of the broad US dollar. The negative correlation has been over 90% (Figure 1).
This correlation with US asset performance has proved to be a more reliable guide for most dollar pairs than any relationship with relative interest rates. FX investors thus need to have a clear view on where this 60/40 portfolio is headed. Even for a major dollar pair like EUR/USD this is likely to be more important than predicting accurately the terminal rate spread between the Fed and the ECB. Today's FOMC meeting is the next major catalyst for bonds, equities, and thus the dollar.
In any case, whatever one's view on what is going to drive bonds and equities from here, it is interesting to work out which dollar pairs are the best expressions for trading that view. The answer is not as obvious as it may seem. If one simply looked at correlations with bonds and equities, pairs such as JPY or NOK would look most promising (Figure 2). Indeed, the performance of US bonds and equities 'explains' more than 90% of the move in USD/JPY this year. But to some extent the correlations in this year's trends could be spurious, and indeed they mask pretty long periods of deviation, as we show below. For a dollar pair to be a really good proxy, it should correct any deviations quickly. Technically speaking, we are looking for cointegration, and it turns out that very few dollar pairs show clear signs of being cointegrated with bonds and equities (right panel of Figure 2)…
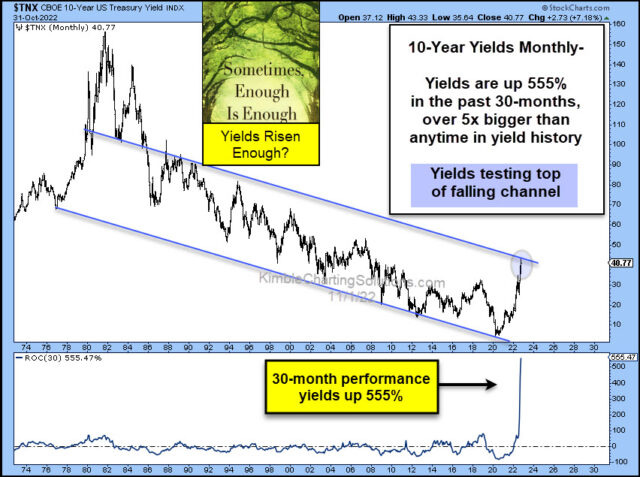
And as far as a couple / few CHARTS which caught MY eyes and may be of interest … First from Chris KIMBLE on YIELDS dramatic RISE
The rise in interest rates has been meteoric, with mortgage rates reaching levels not seen in nearly 2 decades.
The 10-year US treasury bond yield is highly watched as a leading indicator and that yield has risen from near 0 (Covid) to well over 4 percent recently.
Is this historic rise in interest rates enough? Given how sensitive the stock market has been to this rise, investors sure hope so!
Today’s chart takes a look at the 10-Year treasury bond yield on a long-term “monthly” timeline. As you can see, rates have spiked. In fact, using the 30-month ROC (rate of change), yields are up 555% (over 5x bigger than any time in yield history).
10-year yields are also testing a long-term down trend channel that may serve as resistance.
So yields are over-heated and testing strong resistance. Will this cool off interest rates? Have bond yields risen enough? Stay tuned!
Chart of the Day: Going into the FOMC, the key technical levels are well-defined, with 3.84% key for the US 10yr Bond Yield. A closing break below here would complete a clear intraday top to reinforce the previously highlighted slowdown in short and medium-term momentum indicators. In contrast, a clear break above 4.11% would lessen the threat of a top and suggest a retest of support at 4.25/275%. We believe a lack of a hint towards a pivot may even send longer-term yields lower as recession concerns grow, whilst also flattening the curve and tightening Inflation Breakevens (see below).
Short-term Strategy on 10yy? We stay tactically bullish, looking for a move to resistance at 3.505/50%. We would turn tactically neutral on a clear break above minor support at 4.13%. On THAT note with an exclamation point offered by the Chairman’s presser, it’s ALSO NOTEWORTHY the firm would now be ‘tactically neutral’ (from bullish) 5s with a clear break above support at 4.35% … Check out full report for MORE charts (5s, 30s as well as some GLOBAL inputs)


Enjoyable, informative - excellent! Thank you!