(touch steeper, strong volumes) while WE slept; soft landing narrative dead? foreign private buyers BOUGHT and China sold (again); debt ceiling drama GUIDE (WFC); HIMCO bullish; some 30yy levels ...
Good morning … Foreign PRIVATE buyers were buyin …
ZH: China Cut Treasury Holdings Again In November As World Piled Into US Stocks
ALL the details from the TICS report HERE and more of ZH details down below … here is a snapshot OF USTs as of 705a:
… HEREis what another shop says be behind the price action overnight…
… WHILE YOU SLEPT The Treasury curve has pivoted steeper off a little-changed (Treasuries well-off their earlier highs) 2yr note yield this morning with both the UK and German bond markets underperforming again today amid supply and ECB warnings (see Knot's and Lagarde's comments above). DXY is lower (-0.2%) while front WTI futures are too (-0.9%). Asian stocks were mixed but fell in Japan (NKY -1.44%), EU and UK share markets are all lower (SX5E -1.65%) while ES futures are showing -0.7% here at 7:15am. Our overnight US rates flows saw the rally extend into Asian hours (on the weak Aussie jobs data) with our Tokyo desk seeing better buying across the curve on good volumes. Overnight Treasury volume was ~150% of average overall with 5's, 7's and 10's all seeing more than double their recent average volumes overnight...
… Our final picture looks at the weekly MOF foreign bond flow out of Japan where Japan investors appear to be coming into 2023 guns blazing after a year of historic liquidations in foreign bond holdings. Indeed, the 4-week moving average of Japan's net foreign bond flows is not only positive again but also back to highs not seen for a year.
HIGHEST IN ‘BOUT A YEAR … queue the field of dreams — build it and they will come!
… and for some MORE of the news you can use » IGMs Press Picks for today (19 JAN — and STILL SPORTING THAT NEW LOOK!!) to help weed thru the noise (some of which can be found over here at Finviz).
Now before I really begin digging into Global Wall Street’s Inbox and for some more of the GOOD news,
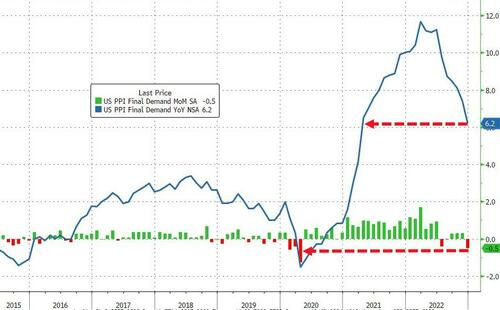
ZH: US Producer Prices Plunge Most Since COVID Lockdowns
… which, when combined with Industrial Production, well, adds up TO zingers like,
ZH: 'Soft Landing' Narrative Nuked As US Industrial Production Plunges In December
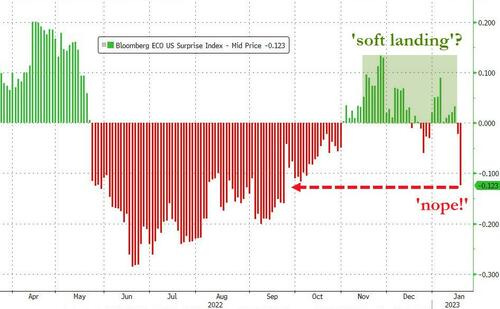
AND as far as this so called ‘soft landing’ narrative, well, they say a picture is worth a thousand words,
ZH: Stocks & Bond Yields Slump As 'Soft Landing' Story Crashes
This morning's smorgasbord of macro data was not pretty for the 'soft landing' crowd as retail sales plunged, industrial production puked, PPI fell (deflationary?), and capacity utilization collapsed...
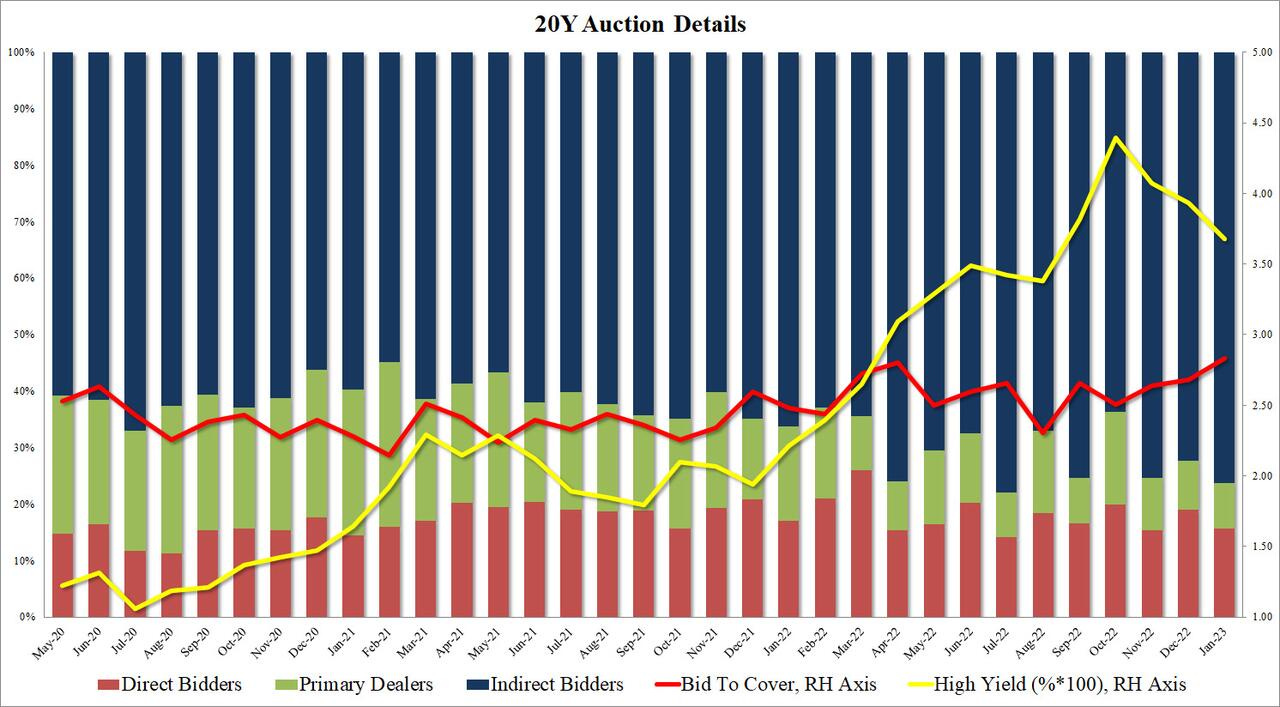
This all combined to help answer that rhetorical question of, ‘Got20s’?
Funny how that can happen hours before debt ceiling showdown taking place in our nations capital later on today … one sellside shop noted the, “…elevated indirects hint of foreign bid” and for specifics, this shop noted, “…Indirects were awarded 76.3% vs. an average of 72.1%.” The INDIRECT bid are dark blue in ZH chart above, fwiw
AND this ‘bad news’ as good (at least for 20yr auction) was then chased with a bit of BEIGE,
ZH: Beige Book Finds "Little Growth" Ahead", Increasing Difficulty For Retailers To Pass Cost Increases
Beige Book findings were then followed up by Treasury Department TICS report just before days end and once again,
ZH: China Cut Treasury Holdings Again In November As World Piled Into US Stocks
… Notably, Foreign purchases of US equities surged in November (the most since Dec 2020)...
And foreign private investors bought USTs once again...
Foreign PRIVATE buyin’ again and this was the metric I followed especially closely during the era of NEGATIVE rates where OFFICIALS had to buy for various FX concerns but PRIVATE investors, well, could do whatever made somewhat more common sense. ZH goes on to detail Japanese BUYING — they are the largest holder of USTs — while China sold again — a trend that has remained in place for quite awhile.
NOW … while YESTERDAYS hit had a bit of insight, visuals and links through to some of what was going on with regards TO the BoJ — likely the biggest story for ‘macro tourists’ in the late part of last year on into early this year — so jumping in TO Global Wall St inbox and leading with this one from Goldilocks
Japan Views: YCC Continues, but Sustainability Issue Remains
… At the press conference, Governor Kuroda stressed the need to maintain easing policy until the risks from economic downturn overseas have eased and wages start rising sufficiently, stating that the bulk of inflation in the current phase is cost-push inflation attributable to import prices, not a demand-pull inflation driven by significant wage growth, which Mr. Kuroda hopes to see. This basic stance is shared with the government, in our view. We expect some improvement in wages, as the 2023 shunto wage hike is likely to reflect recently high inflation, but we think wage growth will still be some way below the 3% rate that the BOJ believes is consistent with achieving its 2% inflation target.
Accordingly, we reaffirm that, from the point of view of macro fundamentals, the BOJ likely intends to maintain accommodative monetary conditions for a relatively long time…
Flipping through for somewhat MORE on BoJ — 1stBOS,
… We continue to think that the BoJ will announce as early as March (1) the start of a review of monetary policy that focuses on the side effects of the current YCC-QQE framework. Then, under the new governorship from April 2023, we expect that (2) the policy accord between the government and the BoJ will be amended to add flexibility to the 2% inflation goal.
Monetary policy changes after (1) and (2) could be more substantial, as the central bank may adopt a flexible inflation target and, in relation to that, scrap the “overshoot commitment” that would maintain expanding the monetary base until 2% inflation was securely achieved. This would put a clear end to the quantitative policy target and a “reflationist” monetary approach.
In our base case, we expect the BoJ to scrap the YCC and negative interest rate policies in 2Q (April or June), provided the financial markets remain sufficiently stable. However, we think the situation is highly uncertain and state dependent. Our projections for the timeline are summarized in Figure 2.
ZH: This Is The "Technical Tweak" Unveiled By The BOJ Which Is Equivalent To Strengthening Policy Easing
AND that was then and this is now … A couple things from Global Wall Street to help.
Wells: Your Guide to the Looming Debt Ceiling Showdown In this report, we discuss what the debt ceiling is, how it works, the outlook for a resolution and the potential economic and financial market implications of a protracted and harrowing debt ceiling showdown.
… eventually the Treasury will exhaust these emergency sources of funds. Thus, the “X date”, or the date on which the Treasury would be unable to meet all of its obligations on time, lies at some later date from when the debt ceiling is first hit.
The U.S. government should hit the debt ceiling on January 19, at which point the Treasury will begin to utilize extraordinary measures. Based on what we know now, our projections show that the X date most likely falls somewhere between the beginning of July and the beginning of September. Early- to mid-August is our preliminary modal forecast for where the X date ultimately will land if negotiations go down to the wire.
We are often asked what would happen if the debt ceiling was not raised and the nation went past the X date. The frank answer is we do not know for sure since that has never happened previously. To some extent, peering beyond the X date is an exercise in educated guesses and speculation. That said, the August 2011 debt ceiling showdown was perhaps the closest modern brush the United States has had with the X date, and understanding what occurred during that episode is instructive.
During that period, consumer confidence weakened significantly, and a closely watched measure of U.S. economic policy uncertainty touched what was then the highest level on record. The S&P 500 fell nearly 17% in just a few weeks, and credit spreads widened. Medium- to longer-term Treasury yields fell, but short-term Treasury security yields spiked amid worries about a default.
In the event the X date comes and goes without a resolution, there is speculation that the Treasury could attempt to prioritize principal and interest payments to prevent a technical default. Publicly available materials, such as transcripts from FOMC meetings during past debt ceiling episodes, suggest this option has been seriously studied.
Federal Reserve officials have had their own deliberations about what role the central bank might play in a default scenario. That said, many of these "break the glass" options are untested and come with a slew of technical, legal and political challenges.
Ultimately, the debt ceiling has always been increased or suspended in the past, although at times there has been some collateral economic damage. Given the dynamics that are at play, we believe the probability of a protracted and potentially serious debt ceiling showdown is elevated compared to similar episodes in the past.
… At the time, the U.S. Treasury projected that the X date would fall on August 2, 2011, and it was on that day exactly that Congress passed and President Obama signed a bill into law increasing the debt ceiling. Consumer confidence weakened significantly during that debt ceiling showdown (Figure 6), and a closely watched measure of U.S. economic policy uncertainty touched what was then the highest level on record (Figure 7). Although it is difficult to parse out how much, if at all, the debt ceiling impasse was to blame, it is worth noting that real GDP growth was an especially weak -0.1% on a quarter-over-quarter annualized basis in Q3-2011.
Financial markets were roiled by the developments. The S&P 500 fell nearly 17% between July 22 and August 8 (Figure 8), and credit spreads widened, particularly for lower rated corporate bonds. The reaction in the Treasury market was a bit more nuanced. One might think that concern about the fiscal outlook and the solvency of the U.S. government should put upward pressure on Treasury security yields. However, the yield on the 10-year Treasury note fell 65 basis points between July 22 and August 8, in-line with the significant “risk-off” move that occurred during this stretch. In contrast, yields on very short-dated Treasury securities rose as the near-term risk of owning a security that could be in default caused investors to shift their money elsewhere (Figure 9).
In the wake of the 2011 debt ceiling episode, Standard & Poor’s downgraded the U.S. sovereign credit rating from AAA (its highest rating) to AA+. On August 1, 2011 the FOMC held a meeting via conference call to discuss the Federal Reserve's role and policy response over the brewing crisis. Committee members deliberated about whether a downgrade from the ironclad AAA would force investors to dump Treasuries. The transcript from the aforementioned FOMC conference call noted that “It is difficult to calibrate just how much the market would react to an actual downgrade by S&P. Our judgment is that a move to AA or AA+ rating would not force many investors to have to sell Treasury securities because of their investment mandates.”3
On August 5, the day of the downgrade, the 10-year yield jumped 15 basis points to 2.56%. However, yields retraced this move fairly quickly, and there was not a subsequent mass exodus from U.S. government debt. Over the remainder of the decade the yield on the 10-year Treasury security averaged just 2.24%, suggesting that the downgrade did not ding investor demand for Treasuries very much. That said, another downgrade could signal that the 2011 episode was not a one-off event to be ignored and could awaken financial market participants to the serious fiscal challenges that lie ahead. Furthermore, a debt ceiling showdown in the coming months would occur at a time when financial market volatility is already elevated, the FOMC is hiking rates to levels not seen in 15 years and the Federal Reserve is letting up to $60 billion of maturing Treasury securities roll off its balance sheet every month. These factors could complicate Treasury market liquidity and broader financial conditions in a way that was not the case in 2011.
Um … MY takeaway? TRUST this will NOT go so far as to lead us back to the brink of 2011 BUT if it does, it’s … bond bearish THEN BULLISH? BTFD?
Changing lanes a bit … the latest from Dr. Ed VIGILANTE Yardeni on PPI,
PPI is NOT my (or the Feds) favorite inflation metric — I personally prefer price at the pump or, I dunno, the price of eggs … BUT Yardeni notes (and shows),
… The PPI includes indexes for personal consumption based on prices received by the providers of the goods and services purchased by consumers (chart).
As we KNOW there are 2 sides of every coin and the opposite side of the ‘inflation falling’ coin may be this note from a large German Bank
… With some nascent signs of stabilization in the inflation data together with “the cumulative tightening of monetary policy” and “the lags with which monetary policy affects economic activity”, the risks to the economic outlook have become more two-sided, allowing the Fed to further slow the pace of rate hikes at its upcoming meeting. Though we had already anticipated a soft December retail sales release, the downward revisions to retail control over the prior two months meaningfully lowered our tracking estimate of Q4 inflation-adjusted goods spending, resulting in a 50bps cut to our Q4 real PCE forecast to 2.5%. The upshot is that our forecast for Q4 real GDP growth fell by 30bps to 3.2%. Though the retail sales report implied significantly less consumer momentum going into this year, we have not made any changes to our current-quarter real GDP growth estimate of 1.8% given that we already expect real PCE growth to decelerate further in Q1 (to 1.9%). Indeed, our 2023 real GDP forecast remains unchanged (-0.6% Q4/Q4) as we continue to expect the economy to slip into recession in the back half of this year.
… ISM services consistent with core PCE inflation rolling over
He describes in only 4pgs (thats INCLUDING a couple visuals) of how Friedman himself might restructure the model and theory of rates
… the equation of exchange, i.e., money (M) times velocity (V) equals nominal GDP. From this he derives three components, liquidity, income and Fisher (price) effects. The Fisher effect is named for economist Irving Fisher (1867-1947) who conceptualized both the equation of exchange (1909) and the Fisher equation (the long U.S. Treasury bond yield equals the real rate plus inflationary expectations, 1932)…
Hunt talks about necessary offset TO growth of monetary aggregates being velocity and Hunt’s modification, if you will,
… Friedman assumes the more rapid rate of monetary growth will stimulate income and spending, which will serve to reverse the initial downward pressure on interest rates. However, if the velocity of money were to fall sharply, this process would not materialize. Here is how the theory could be modified, “Rising income will raise the liquidity preference schedule and the demand for loans; it may also raise prices, unless the velocity of money falls sharply.” With velocity stable, Friedman’s income and liquidity effects serve to reduce the downward pressure on interest rates. For us, the question of whether velocity is shifting is just as germane as whether money growth is accelerating or decelerating.
This is Friedman’s quote on the “Fisher effect,” along with our allowance for velocity in bold letters: “Let the higher rate of monetary growth, unchecked by velocity, produce rising prices, and let the public come to expect that prices will continue to rise. Borrowers will then be willing to pay, and lenders will then demand higher interest rates—as Irving Fisher pointed out decades ago.”
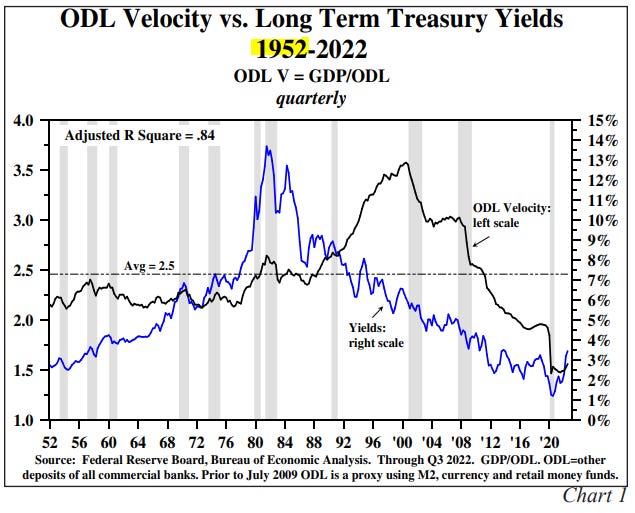
Huntgoes on to offer ‘Empirical Support’ and details correlations of ODL (other deposit liabilities of commercial banks) and illustrates ODL as well as M2
… ODL Velocity. In the past 70 years, each dollar increase of ODL generated an average $2.50 increase of GDP, but as the chart indicates ODL V spent little time at this level (Chart 1). The range was from about $1.40 to almost $3.50. Swings in ODL V have coincided positively with swings in the yield on long term U.S. Treasury bonds, with the rate rising with increasing ODL V and falling when ODL V fell. The adjusted R-Squared is an impressive 0.84 for 283 observations.
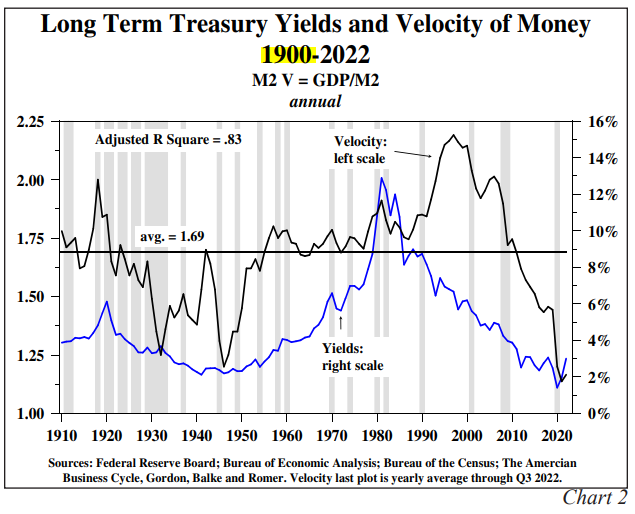
M2 Velocity. The relationship between M2 velocity and long-term U.S. Treasury bond yields, for the even longer sample since 1910, also indicates that velocity should be in the interest rate model (Chart 2). M2 V spent very little time over the past 122 years at the average of 1.69, with the range from a high of 2.15 to a low of 1.13. The adjusted R-Squared for this sample based on annual data is strong at 0.83 and the correlation between M2 V and long-term U.S. Treasury bond yields is also positive.
There are similarities of M2 and ODL where ODL is, at least in Hunts eyes, a ‘superior measure of money’ and shows growth rates — highly correlated — of REAL M2 and REAL ODL on a YoY basis … in wake of 2020-22 experience, noting,
ODL growth is estimated to have declined at a record 7.9% annual rate in the fourth quarter, following decreases at 2.7% and 1% annual rates in the prior two quarters. From the last quarter of 2021 to the same quarter in 2022, nominal ODL is estimated to have declined at record 2.8% annual rate, the largest yearly drop in history. In real terms, ODL also contracted at a record pace (Chart 3). Based upon the Fed’s monthly $96 billion balance sheet reduction and the monetary policy lags, the rate of ODL decline will accelerate in at least the first half of 2023. If the Fed sticks with its plan to raise the Federal Funds rate another 75 basis points, the rate of decrease in ODL will be sufficient to neutralize the money mountain of 2020/21 by the second quarter of 2023, when taking velocity into consideration.
He ENDS with a few final thoughts,
… Final Thoughts … The better growth in real GDP experienced in the third quarter and early part of the fourth quarter will reverse. Poor consumer spending over the critical Christmas shopping period, slumping exports, sharp deterioration in residential construction, and contracting diffusion indices in both the manufacturing and service sectors will result in business conditions in the first quarter that should be dramatically weaker than the fourth quarter. The risks of recession will become much clearer as 2023 progresses. Headline inflation will recede further from the 1.9% pace in the CPI of the latest six months. These developments are aligned with interest rate cycle theory as well as the case for lower U.S. Treasury bond yields.
Full note and context always a good idea … Have at ITand as far as some TECHNICAL INPUT — LEVELS TO WATCH — from 1stBOS on LONG BONDS
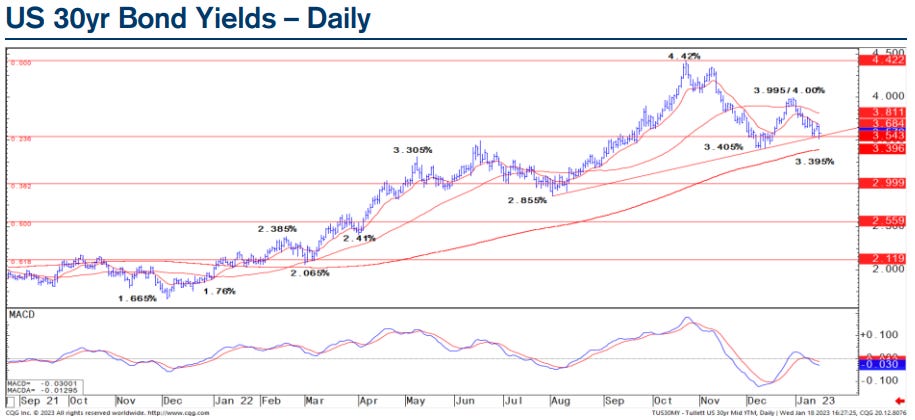
Chart of the Day: As we argued in our last report, longer-term rates are key to monitor to assess how far and quickly US Bond Yields can fall, as both 5y5y and US 30yr Bond Yields are threatening large, irregular topping structures. Following weak US data today, the 30yr US Bond Yield is again testing key resistance at 3.545%, below which would increase the risk of a top further. Next key resistance is at 3.405/395%, which includes the 200-day average. A quick break below this level is essential to confirm a top, which would suggest that US Yields more broadly can fall further and faster than we have been expecting. For the US 30yr Bond Yield, this would mean a move to 3.00% …
The firm remains tactically bullish 5yy, 10yy and regarding long bonds,
… Short-term Strategy: We recently initiated a fresh tactical bullish bias at support at 3.85%, with scope for a fall to 3.00%, where we would consider turning tactically neutral. Support is seen at 4.00%, above which we would also consider turning tactically neutral.
Keep friends and enemies close, keep your STOPS even closer?