As futures are opening up and folks flipping on screens and have a look rates ahead of Wednesday’s 20yr auction,
I’ll watch 20yy vs 50dMA (3.387) and note momentum (slow stochastics) suggesting 20yy are becoming (but are not yet) overBOUGHT and in need of some sort of concession (somewhere nearer 50dMA?).
… Since the June FOMC meeting, inflation expectations data have notably softened. 5-10 year inflation expectations were revised down by 0.2pp in the final June UMich report and declined by 0.3pp to 2.8% in the preliminary July report, 3 year inflation expectations in the NY Fed's survey have declined by 0.3pp since April, and market-based measures of inflation expectations have materially declined. Our monthly version of the CIE points to downward revisions after incorporating these and other data through mid-July, and indicates that the CIE would settle comfortably within its historical range if underlying inflation expectations measures stay at today’s levels.
This softening of inflation expectations is one reason why we expect the FOMC will not accelerate the near-term hiking pace and will deliver a 75bp hike at the July FOMC meeting.
Read the WSJ story along with the notes from Goldilocks (the powers that be agree and have been told what to tell us as the Fed speakers entered the pre-meeting ‘blackout period’) and watch eurodollar futures and curve / block trades. This is where the rubber meets the road and folks put their monies where their mouths are. All the narratives will ultimately be reflected in the CMEs FedWatch Tool.
Doesn’t seem to me that at this point, Goldilocks, Nicky T or the WSJ are going too far out on the limb and the markets HATE surprises almost as much as The Fed dislikes them.
That in mind, when you are done with the GS and Nicky T / WSJ story, have a look at this video from EPBMacro.
It’s not right or wrong, it’s just facts spoken via YouTube as clearly and succinctly as you could put them. This guy has a very interesting approach and you’ll be better off watching THE 8min VIDEO
… which addresses,
After you’ve read GS, WSJ and watched the video, you’ll also be delighted to know Goldilocks has weighed in this evening on another topic … asking / answering (with authority, too, I might say)
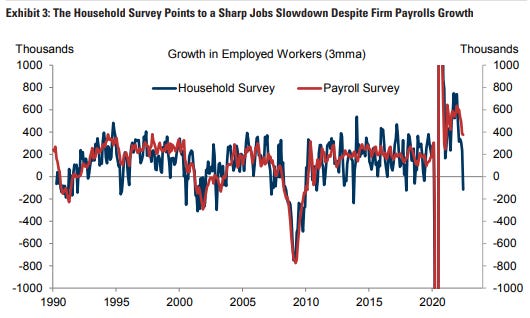
… We continue to expect that the slowing economy will lead job growth to fall sharply to 150k/month in 2022H2 and to 60k/month in 2023, causing the unemployment rate to gradually rise to 3.8% at end-2023 and 4.0% at end-2024. We see risks around this forecast as two-sided, reflecting elevated risk of a recession that would cause greater labor market damage, but also the possibility that very high labor demand might limit labor market deterioration…
… Although the household survey is noisier, the two surveys have historically tracked each other reasonably well, and the current divergence is the largest on record outside of spring 2020 (Exhibit 3).
… payrolls growth has historically been coincidental to economic activity, as demonstrated in Exhibit 8, which compares our CAI (recalculated to exclude labor market inputs) with payroll job growth. The two series typically track each other very closely, with job growth typically falling at the same time or only shortly after a decline in the pace of economic activity. Additionally, the disconnect between activity and job gains is currently unusually large, suggesting scope for job gains to slow soon.
And now we know — definitively. As the labor markets expected to throttle back markedly (H2 2022) Goldilocks not alone in NOW, calling things as the rest of us have been seeing them.
MSs economist (and former Fed insider) - Seth Carpenter - noting things are,
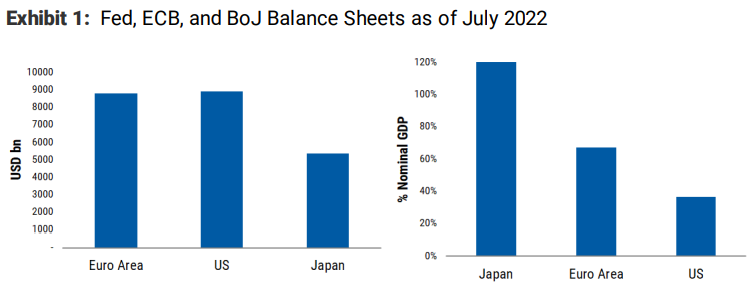
… In absolute terms, the ECB and the Fed have the largest balance sheets, with the BoJ a distant third. But relative to GDP, the BoJ has the biggest by far, with the ECB second. The Fed is an outlier on the low side, and as its QT continues and accelerates, the Fed’s footprint will contract further while the BoJ’s will likely grow (see Exhibit 1).
… Markets have a lot to digest. Following the Covid shock, all major central banks were moving in the same direction but no longer, and market liquidity will be buffeted by severe crosscurrents. The irony is that the risks come from both larger and smaller balance sheets. In dollar markets, a lot more Treasuries and MBS will have to be absorbed as financing costs are rising. In JGBs, the BoJ already owns half the market, and more might be coming.
Okay then.
This week we’ve got 20yy to contend with — in need of a concession. Let us see whatever happens overnight — you know — while we slept.
Finally, because I believe everything on the intertubes, THIS from twitter, was too good to pass up as I can confirm its accuracy,