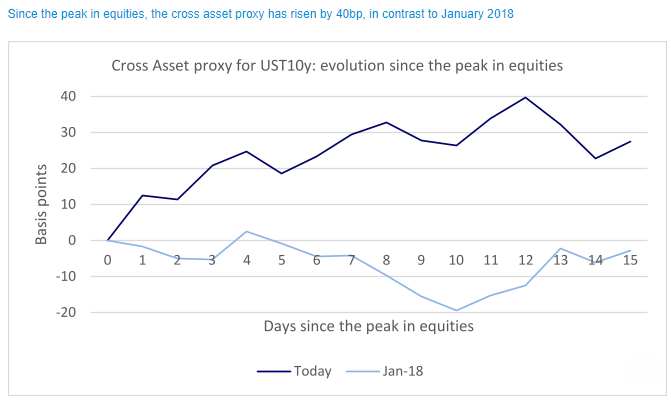
We argued two weeks ago that the proverbial Fed put was further away than in January 2018. The analysis was focused on the level of key variables. For instance, relative to January 2018, the UST2s10s curve is 45bp steeper and UST10y is 40bp more expensive v.s. a cross asset model that includes variables often associated with the evolution of rates (financials / spx, copper / gold, oil and the yen).
Both in January 2018 and today, the S&P500 suffered a 10% drawdown. In January 2018, the cross asset proxy declined 20bp, validating the drawdown in the S&P500 across other asset classes and equity sectors. This time is different: the cross asset proxy rose 40bp. This suggests that the current equity drawdown is more idiosyncratic than in 2018. This conclusion is consistent with the analysis done by DB's credit team. They show that there has been a significant change in the concentration in US equities towards megacap growth stocks and technology companies. However, they note that, credit indices do not suffer from the same sort of concentration issues.
One should look beyond broad equity indices to evaluate if the tightening of financial conditions is excessive.
I suppose, then, it depends on definition and semantics … So perhaps IT — whatever you assess that value to be — can be different this time.
Ok then. As far as where ‘risks’ might be, gatekeeper of all things position-related offered these,
Changes into FOMC: Over the weekmarket has rapidly cut extended short driven by a combination of short covering ($20m) and new long ($20m). Positioning is now only mildly short with longs losses offset by short profits (mostly concentrated at the front end).
Largest exposure into FOMC: Extended short in Eurodollar white as the market prices in more than x4 hikes prices within the year. In EDZ2 shorts (at $4m short / 90th percentile) are 20bps in profit below 98.95 / momentum account max shorts with a rally of more than 20bps required to start trimming shorts. Meanwhile in 30y we see extended shorts ($17m / 90th percentile) and profits (at 8bps) in WNs (which also matched the flows we have see in cash/swaps)… and into equity cheapening, ALM bid is waning (coverage ratio now at 100%)
Who has been buying?: Looking at intra day price action we see that the rally in treasuries has mostly occurred within Asian trading hours… account were short and took profits into richening. In our own flow we see that banks have moved into longs, with the bias for long swap spreads and steepeners.
Is curve vulnerable? The longer term consensus trades remains in 2/10s flatteners (in legacy) which is highly extended and deeply in profit below 100bps => flattening momentum. Meanwhile in 10/30s there has been a strong bias to fade recent flattening (steepeners starting to look extended post FED minutes but as yet no profits)
What about real yields?Into the real yield cheapening by 40bps, our flows have skewed to the longs side (driven by profit taking on shorts), but structurally market has switched from short real yields into long end real yield steepeners. Meanwhile in real linker ETFs less appetite to buy but still significantly extended long over the last 6mths…
…The largest risks into FOMC are short in Eurodollar white (with more than x4 hikes prices in). Short momentum... with positions deeply in profit by more than 20bps but clearly vulnerable to a more dovish FOMC. Meanwhile, we see extended shorts in 30y which are 8bps in profits... and into sell-off (in risk) 30y has become less attractive.
And NOW we know.
Food for thought as if you didn’t have enough on your minds before FOMC and presser.