(strong volumes, BoE confusion and China data delayed)while WE slept; reserve balances and the SPX; mortgage rates JUMP; govy liquidity and HY; a Halloween costume idea
thebondbeat.substack.com
(strong volumes, BoE confusion and China data delayed)while WE slept; reserve balances and the SPX; mortgage rates JUMP; govy liquidity and HY; a Halloween costume idea
(strong volumes, BoE confusion and China data delayed)while WE slept; reserve balances and the SPX; mortgage rates JUMP; govy liquidity and HY; a Halloween costume idea
Good morning … China delays Q3 GDP data. I’m sure there’s nothing to see here, folks. Move right along … back to your cars. Shows over…And speaking of the show being over, BOE to delay sales of bonds from QE purchases after judging the markets to be “very distressed”. Oh, but to jump to THAT conclusion would have then been wrong as BBG then writes up, “UK Bonds Take Hit as BOE Leaves Prospect of Debt Sales Looming” … If yer NOT confused then yer NOT paying attention. No WONDER there’s a lack of liquidity (aka TRUST) in the UST market (more on that below)?
… here is a snapshot OF USTs as of 706a:
… HEREis what another shop says be behind the price action overnight…
… WHILE YOU SLEPT Treasuries and Treasury curves are little changed this morning with bond investors shifting attention from the UK's mini-budget to the BOE's QT plans (see links above). JPY weakest since August 1990 this morning. DXY is higher (+0.2%) while front WTI futures are little changed. Asian stocks were mostly higher, EU and UK share markets are all higher (SX5E +1%) while ES futures are showing +1.4% here at 6:55am. Our overnight US rates flows saw 2-way flow in the back-end during Asian hours (Fast$ selling, real$ buying) with the market trading firmer despite twin block sales in TY futures totaling 3.7k contracts. Our Gilt desk reported ongoing buying despite the BOE denial of the FT piece on QT. Our London US rates desk reported overall better selling (fast$ and banks ahead of the UK '51 auction) with 20yrs underperforming (10s20s30s +1bp) ahead of their $12bn re-opening. Overnight Treasury volume was ~140% of average with 30yrs (229%) seeing the highest relative average turnover overnight.
… As the WSJ noted, "data points from elsewhere this earnings season have raised alarms with investors that many banks may be poised to see growing deposit-cost pressure." 75's and QT will do that... Anyway, this morning's first attachment shows a multi-year overlay of reserve balances with Fed banks and SPX. If RRP balances are going into reserves then good for stocks??
… and for some MORE of the news you can use » IGMs Press Picks for today (18 Oct) to help weed thru the noise (some of which can be found over here at Finviz).
With some of the news in mind, a few other topical bullets / links from global Wall St,
… In the end, we expect to be heading into a period of low growth and high inflation, which the Fed also projected at their most recent meeting. In this environment we believe it is good idea to become a little more defensive and consider positioning portfolios to include investments that may benefit during times of increased inflation and have the potential to perform better during higher volatility.
Putting the economics of the moment aside and looking at the long end of the yield curve as only Goldilocks can do for all its minions and muppets,
■US 2s10s and 10s30s curve inversion has deepened over the past month across forward horizons. Where forwards imply a degree of steepening over the coming years for the 2s10s curve, they suggest the current degree of inversion is likely to persist for curves at the long end.
■While investor expectations over the longer term could offer an explanation for the degree of long-end inversion, it isn't clear that investors should have particularly strong priors that the average level of yields 10 years hence will be materially lower than the average over the next 10 years. Instead, bond risk premium and convexity considerations provide a more compelling explanation in our view, with higher volatility in particular an important driver of flattening since late last year.
■Given the current level of volatility, estimates of US yield term premium appear too low. To the extent volatility persists, we would expect over time that investors will require more compensation for taking duration risk, steepening curves via higher term premium. Conversely, a moderation in volatility would diminish the convexity benefit to the long-end of the curve, with a more “normal” vol regime also consistent with steeper curves. Given our analysis, we think the long-end is too flat and recommend 10y/10y20y swap curve steepeners.
Ok so that was one for the RATES guys and here’s one for our collective inner macro
Global Macro Thoughts: Perilous Times The macro environment is as perilous as at any point this year, with another deeply worrying CPI print, Asian currencies making new 2022 lows, and potentially far-reaching new US sanctions on Chinese semiconductor firms. We recommend riding out market volatility in cash, at least for now.
Remember TINA? My how times have changed … From academia and trading desks TO real world impacts of the long end of the yield curve, let us look at a couple HOUSING RELATED topics. First from Calculated Risk blog from Sunday,
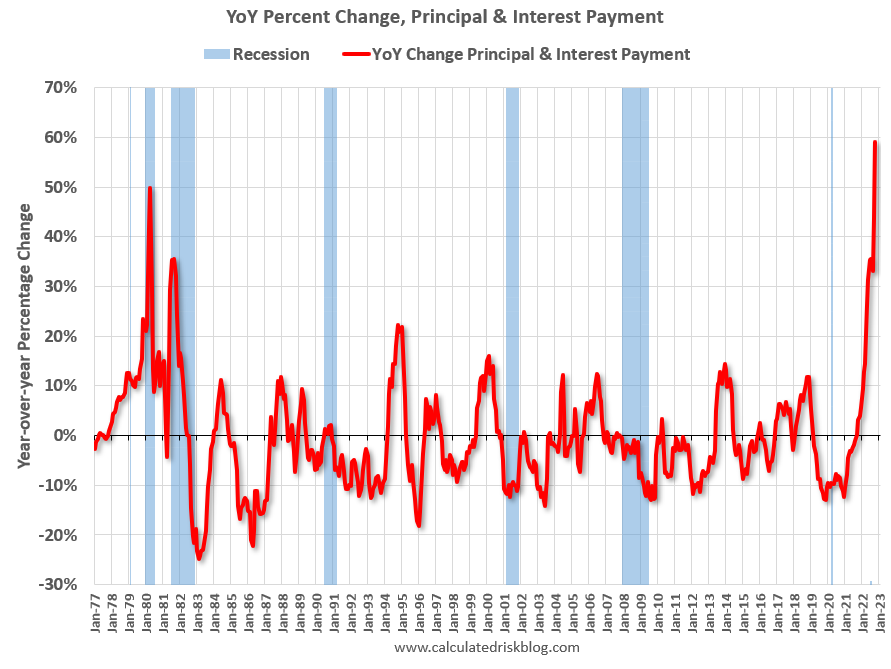
… The following graph shows the year-over-year change in principal & interest (P&I) assuming a fixed loan amount since 1977. Currently P&I is up about 59% year-over-year for a fixed amount (this doesn’t take into account the change in house prices).
This is above the previous record increase of 50% in 1980. This assumed a fixed loan amount - if we add in the year-over-year increase in house prices, payments would be up over 70% YoY for the same house…
Hmm. That can’t be good. What do officials think? FRBSFs latest Economic Letter,
Measuring the price of shelter for homeowners is difficult, even when housing markets are stable. A new measure of shelter price inflation uses mortgage, tax, and insurance payments, rather than the implied rental value of homes used in the consumer price index (CPI). The payments method suggests year-over-year shelter price inflation rose 4.3% nationally in July, compared with the CPI’s 5.8% estimate. Conditions in rental markets likely explain this difference. Comparing the varying results nationally and across regions highlights the challenge of accurately measuring the shelter inflation that homeowners face.
… Conclusion … Since research has shown that individual experiences affect inflation expectations (see, for example, Weber, Gorodnichenko, and Coibion 2022), it may be useful to consider shelter price inflation measures that reflect actual monthly spending by homeowners, such as the payments measure, as complementary information to help shed light on individuals’ inflation expectations.
Said differently, they’ve NO idea how it is real folk do it day in and out. Measuring shelter inflation is a ‘challenge’ and telling us so is, well, job security for those fortunately hidden away IN the ivory tower.
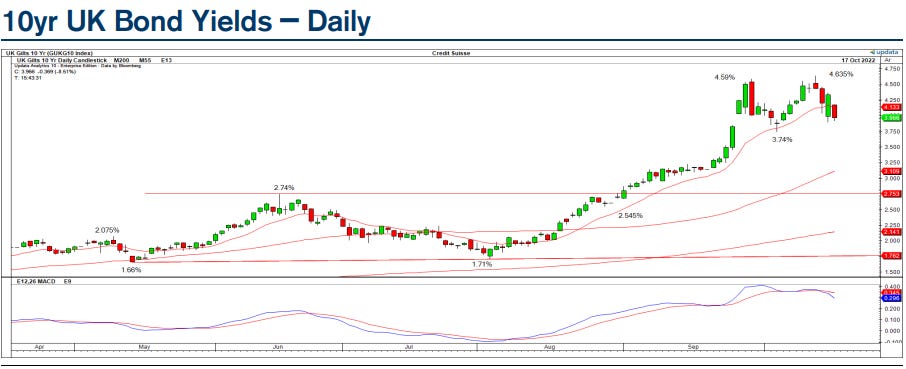
Chart of the Day: 10yr UK Bond Yieldssaw another strong rally onMonday after the further unwinding of the UK mini-budget, with the market now threatening a clear “double top”, which would be confirmed below 3.765%. Furthermore, short-term momentum holds a bullish divergence and is rolling over, which reinforces the case for a reversal lower. All this suggests the risks to yields are skewed to the downside from here, with scope for a test of next resistances at 3.515% and then 3.36%.
The firm is also NEUTRAL 5yy, tactically BULLISH 10yy and 30yy
Treasuries trading is become rough for many as the Federal Reserve hikes interest rates and runs down its balance sheet. So rough that momentum is building for another buyer with a bottomless wallet to step in and calm matters down: the US Treasury. Liquidity and volatility metrics for US sovereign debt have marched relentlessly higher with yields this year as robust, resilient inflation drives the Fed to the steepest tightening in a generation.
The fallout has also been pushing away traditional deep-pocketed investors, such as US commercial banks and Japanese pension and life insurance companies. There’s plenty of fear out there that the wild times in Treasuries will tip other markets into dangerous territory. US junk bonds for example have been holding up reasonably well, but credit-default swaps on the market may be poised to break higher to match the Treasuries liquidity gauge as they have in the past.
Finally, as noted Lacy Hunt talked of longer-dated USTs pricing in recession (and deflationary circumstances), I thought this ‘toon representation of my upcoming Halloween costume was in order. It’s called “Fear of Recession”,