… HEREis what another shop says be behind the price action overnight…
… WHILE YOU SLEPT The Treasury curve has pivoted further steeper overnight off a little changed front-end. JGB 5yr yields hit a ~7yr high this morning after a number of articles (see links above) hinted of a watering-down of Abe's deflation fighting mandate.Gilts have also underperformed with UK 10y yields (+12bp) rising back to levels last seen on November 10th. DXY is modestly lower -0.18%) while front WTI futures are modestly higher (+0.6%). Asian stocks were mostly lower (SHCOMP -1.9%), EU and UK share markets are modestly higher while ES futures are showing +0.25% here at 6:45am. Our overnight US rates flow color was unavailable again and overnight Treasury volume was very weak at ~55% of average overall with only 2yrs (141%) seeing above average turnover this morning (3's and 30's each ~35% of ave volume).
… The Treasury 5s10s curve showed some renewed buoyancy last week and this morning it is inching ever-closer to key range resistance in the vicinity of -10bp, as illustrated. There has been a 'barrier of supply' there since early August and it will be interesting if the recent up-thrust has enough oomph behind it to take us up on through this time. On a break above -10bp... there does not appear to be much resistance until ~0.0bp... but we'll assume -10bp will remain a key resistance until a daily close takes it out. So 5s10s nearing a key range level as we speak.
… As for duration, Treasury 5yrs have welded themselves to the 3.62% resistance (June move high in yields) just like 10's have to the similarly-derived 3.496% level... There's also a multi-month bear trendline in place just below 3.62% this morning so 5's have a lot of nearby resistance to forge through-- or to at least respect right now.
… and for some MORE of the news you can use » IGMs Press Picks for today (19 DEC) to help weed thru the noise (some of which can be found over here at Finviz).
HERE are a few observations from the sellside which I offered Saturday, in the case you missed.
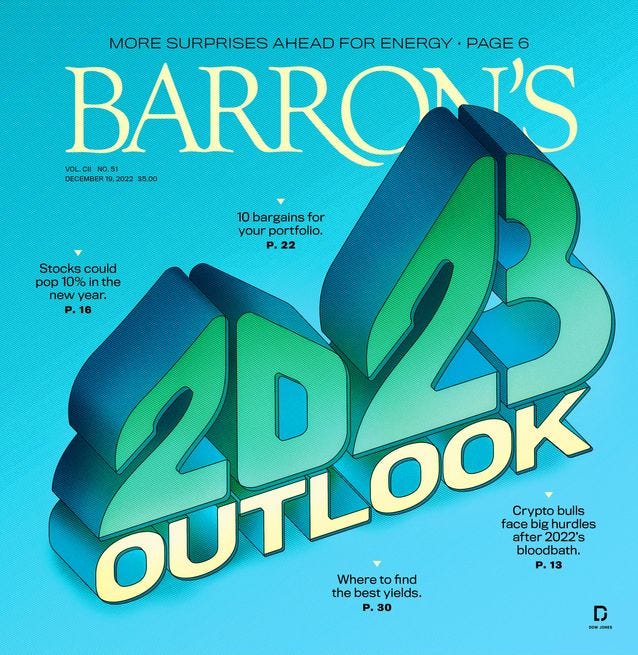
HERE is this weekends Barrons COVER STORY on what stocks are going to do in 2023 — a good read for those looking to plan their trades and TRADE their plans (at least according TO Barrons)
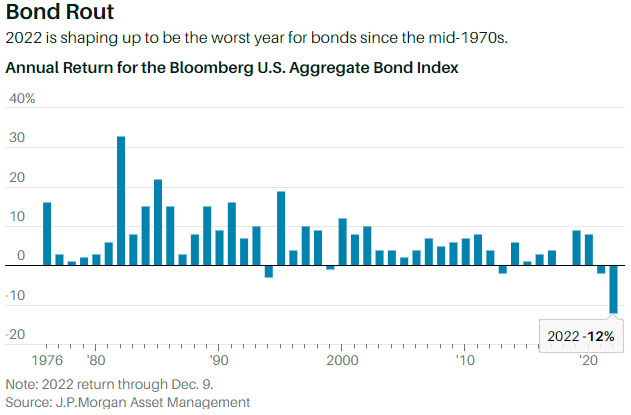
… In the bond market, yields offer the most compelling alternative to stocks in at least 15 years. A coming end to Fed tightening should mean a better year for bond prices, too.
“With rate increases moderating, a lot of the pain is already priced in when it comes to fixed income,” says Saira Malik, chief investment officer of Nuveen. “We prefer fixed income to equities for 2023 because you can get similar or higher returns with less risk.”
Malik is focused on quality in the bond market. She’s sticking with investment-grade corporate bonds and municipal bonds from states with the strongest fundamentals, while taking baby steps toward extending duration.
Investors will need more confidence that inflation is slowing and that rate hikes have peaked before they fully embrace longer-dated bonds. That might already be playing out, with the yield on the 10-year U.S. Treasury note recently down to 3.5% from its peak of 4.2% in late October.
“If you wait until the all-clear sign from the Fed, you’ll have missed probably most of the opportunity,” says Andy McCormick, T. Rowe Price’s head of fixed income.
McCormick is in the modest-recession camp, and has been selectively adding some bonds from lower-quality firms. The T. Rowe Price Global High Income Bond fund (RPIHX) includes bonds from issuers rated at BBB and below, and yields 5.7%.
He also sees value in municipal bonds, due to higher tax receipts and the federal budget support during the pandemic. And unlike the Treasury yield curve, the muni-bond curve isn’t inverted, meaning that longer-term yields exceed shorter ones. That allows investors to take on duration without sacrificing yield. McCormick points to the fund (PRFHX) as a compelling option.
Fixed income is no longer an oxymoron, and bonds will play more than a diversification role in portfolios in 2023. That, too, is a welcome change, especially as stocks are likely to head lower for a while. Like 2022, 2023 won’t be boring for investors. And it might be a much better year, especially once investors begin to contemplate a stronger economy in 2024.
Interesting that the story ENDS with a few words on BONDS.
Ultimately, the use of the word “COULD” is what stood out to ME — so idea is a 10% return is POSSIBLE but expect stocks to ‘FALL’ (again, nondescript, and so, I’m struggling to see exactly how to deploy assets on this) FIRST …
Sell, get SHORT, buy PUTS and that MAYBE buy to cover, cover puts, buy CALLS and get long stocks. Or don’t because all this “COULD” simply not work out as planned?
I suppose this is why they call ‘em surprises. Said another way, as a friend and trading counterparty across the pond, used to remind me nearly every single day, ‘IF the majority were right, the majority would be rich’.
… Steve Cianci, co-head of the global fixed-income team at MacKay Shields, says the yields on investment-grade bond strategies at his firm range from 5% to 7%—a big contrast from what had been available until recently. Portfolio managers “had to move well outside of public fixed income to private debt, to high yield, and to other, less-high-quality asset classes to get those kind of yields,” he says.
Bond investors no doubt will be watching the Fed, in particular its rate policy. “What the Fed is going to do, what’s going to happen with inflation, and the likelihood of a recession—that’s what you really need to think about pricing in,” says Herr…
From the press (so those who report on what narrative creators on Global Wall Street are saying) TO the Global Wall Street Inbox (once again, HERE are a few observations from the sellside which I offered Saturday, in the case you missed). A few OTHER items which may be of interest.
MSs weekly WORLD (economic) VIEW,
The Beginning of the End (of Covid-Zero)? Given the supportive dynamics surrounding the end of Covid-Zero, our China team raised 2023 growth expectations. But the positive spillover from China to the rest of the world will not be on par with history as global aggregate demand is slowing down as a result of widespread monetary tightening.
MSs Weekly (EQUITY) Warm-up,
Case Closed—The Market Has Spoken The fixation on inflation and the Fed continues, but markets appear to have moved past it and onto the real concern—earnings growth/recession. Rates and inflation may have peaked but we see that as a warning sign for profitability, a reality we believe is still underappreciated but can no longer be ignored.
Weaker inflation data is bullish for bonds but bearish for stocks... Last week, we got another weaker than expected inflation release on Tuesday which spurred a rally in bonds and stocks. However, that proved fleeting for stocks even as bonds held onto gains. This makes sense as markets contemplate what falling inflation means for growth and the equity risk premium. Finally, the technical reversal pattern on the back of the weaker CPI is the perfect book end to the rally that began in October.
Earnings outlook deteriorating; we offer further comparisons to August 2008…
Our attention is on the weakening survey data because it leads the hard data (and earnings)...
… While we called for the end of the tactical rally two weeks ago (Weekly Warm-Up: Tactical Rally Hits Resistance), we think last week's price action provided the technical reversal to confirm it (Exhibit 1). More specifically, the lower than expected CPI release for November on Tuesday drove the equity markets to open up sharply in the morning only to fail at the key resistance levels we highlighted two weeks ago. More importantly, that price action left a negative price tail that looks similar to the upside tail left back in October when the September CPI came in hotter than expected. We made our tactical rally call on the back of that upside tail reversal, and last week provides the perfect book end to our trade. Case closed.
Seasonally, the set-up is now bearish, too…
Speaking of seasonals … ok, actually having NOTHING AT ALL to do with seasonals, except to say, this time of year, desire to clutter inbox with mindless drivel goes WAY down (at least here) yet Global Wall St feels compelled to stay top of your inbox and so, offer things like THIS from Goldilocks which seems to ME to be counterintuitive,
The idea that monetary policy affects the economy with “long and variable lags” is probably the main reason why most forecasters expect a recession in 2023. And while the FOMC does not technically forecast a recession, Chair Powell has cited uncertainty around the lengths of these lags as a reason for slowing the pace of rate hikes in December, since a slower pace provides more opportunity to assess the impact that policy tightening is having on activity and inflation….
… Empirical evidence supports our view that policy tightening affects growth with fairly short lags. Our own regression estimates imply that unexpected policy changes have a peak impact on GDP growth after 1-2 quarters, and widely-cited models from the Fed and academic research suggest a peak growth drag after 2-3 quarters.
Our analysis reinforces our confidence in our FCI-based estimates of the impact of changes in financial conditions on GDP growth and raises the possibility that the fading drag from both monetary and fiscal policy tightening in 2023 may not be enough to keep growth below potential. If so, the Fed might need to raise the funds rate above our current forecast of 5.0-5.25%.
What ever happened to long and variable lag (Friedman HERE),
The policy implication of the long and variable lag is that government monetary, debt-management, and fiscal policies should not attempt to be actively anticyclical but should behave in a manner that is cyclically neutral
UBSs 2023-2024 rates outlook which is now about a month old,
Global: Rates set to move lower in the return to normal monetary policy 2022 has been witness to the most synchronized DM tightening cycle on record and UBS economists see an almost simultaneous dovish shift forthcoming. With the Fed expected to cut rates by 175bp in '23, the 10y UST yield should decline markedly to 2.65% driven by sharply lower real yields which retrace more than half of the 2022 surge. While the path for rates is decidedly lower, curve shapes will face a tail of two halves, with continued flattening characterizing Q1-23 before steepening follows. 10y Bunds and Gilts should underperform USTs as ‘single mandate’ ECB and BoE stay on hold for longer due to persistent inflation. Global term premia rise is limited by stable JGBs.
US: Flatter before steeper as yields move lower; long 30y swap spreads US 2s10s curve should continue to flatten through the Q1'23, and we see scope for the inversion to extend to -70bps with risk of an overshoot. October's CPI reading certainly provided an impulse to reprice Fed expectations, and the terminal rate has moved <5%. Following our fed expectations, US 10y yields will face significant downward pressure and curve steepening, notably through H2.
… Where can rates go? With the fed funds rate forecast to peak in Q1-23 at 5.00% followed by 175bp of cuts in H2, we forecast the US 10y to decline by 150bps to 2.65%, still solidly above the pre-pandemic 10y average of 2.25%.Three themes anchor our thesis. First, we expect the Fed's reaction function to balance growth and inflation risks next year, unlike in '22 when inflation risks drove policy. The risk weighted index for real GDP and core PCE are both at extremes in the latest Summary of Economic Projections (SEP), just in opposite directions Nearly all FOMC participants see downside risks for Real GDP and upside risk Core PCE. This should allow longer term rates to recalibrate to movements in the business cycle. The transition back to a more balanced reaction function should also improve the negative correlation between bonds and risk assets at least at higher yield levels. But Treasury yields at extremely low levels failed to offer the hedge effectiveness versus risk assets during this cycle, which we think curbs demand for 10s if yields head towards 2%.
Second, at current levels, long term real rates are roughly 150bps above the Fed's R* estimate…Third, after more than a decade of reducing volatility through strong forward guidance and QE, global central banks generated volatility in '22….
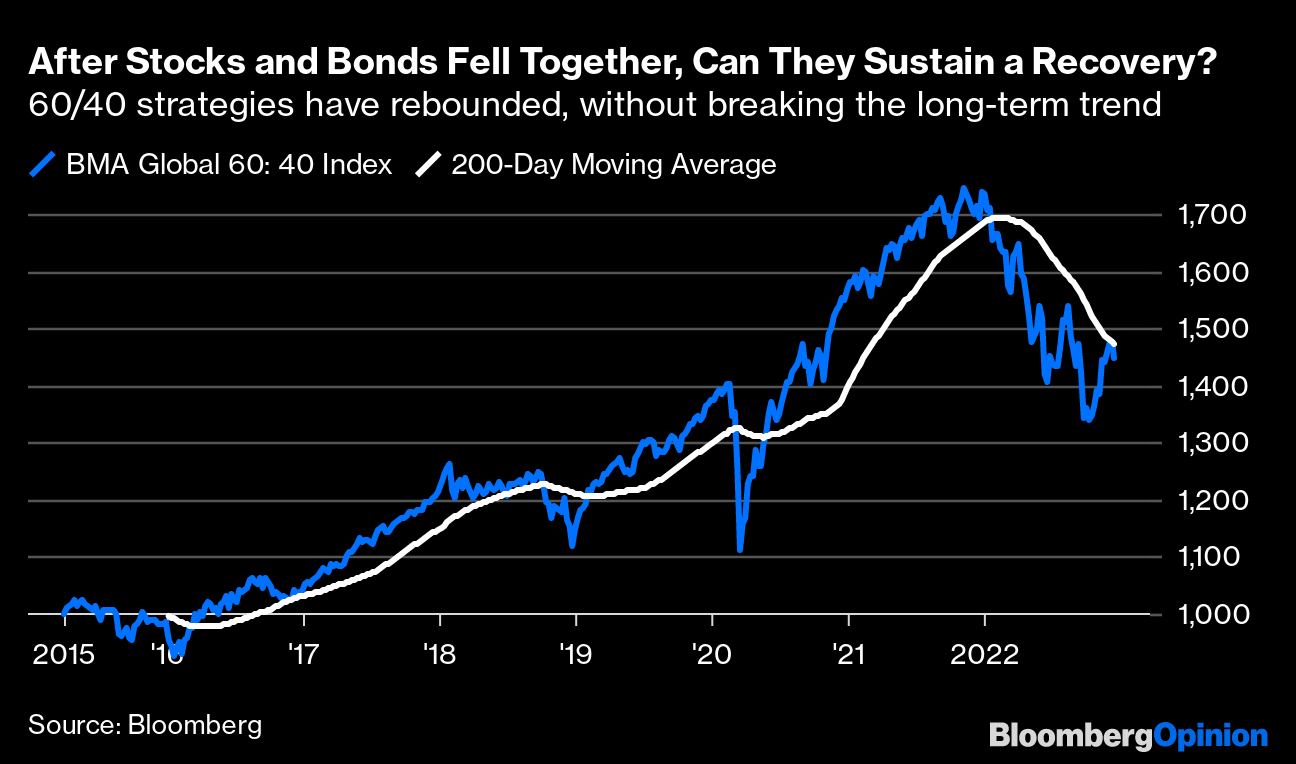
Bloomberg’s John Authers with a few words on stocks and bonds
… Investors have long set their hearts on a “pivot” from central banks toward easing monetary policy again. They’ve placed their money accordingly over the last few weeks, with both stocks and bonds rising after a torrid and very unusual selloff for both that has lasted most of the year. The latest batch of central bank meetings look as though they might have dented this confidence. Bloomberg’s global index of a “60/40” strategy (60% stocks and 40% bonds) had put together its most convincing rally of the year ahead of the central bank meetings — but in the aftermath of the decisions, the index fell back without breaking the 200-day moving average, a widely followed measure of the long-term trend:
Investors dislike hawkishness on monetary policy because they think it’s a mistake. An unusually strong consensus of fund managers and asset allocators, who oversee broad flows of money between asset classes, is braced for lower inflation and a recession next year. That means that higher interest rates in the short term will make things worse, and that the central banks will finally be forced into a “pivot” sometime next year when their mistake grows obvious.
That comes through from two surveys of global fund managers, released in the last few days, which suggest that after the shocking changes of 2022, investors are braced for a new regime to take over in the new year.
The monthly Bank of America Corp. Fund Manager Survey, running for more than two decades, found that investors expected government bonds to be next year’s best performing asset, and that they were the most overweight in bonds compared to stocks since March 2009. That proved to be a point of true despair, which allowed for the great equity rally to take shape. The current circumstances are very different, and the degree of negativity toward stocks is startling:
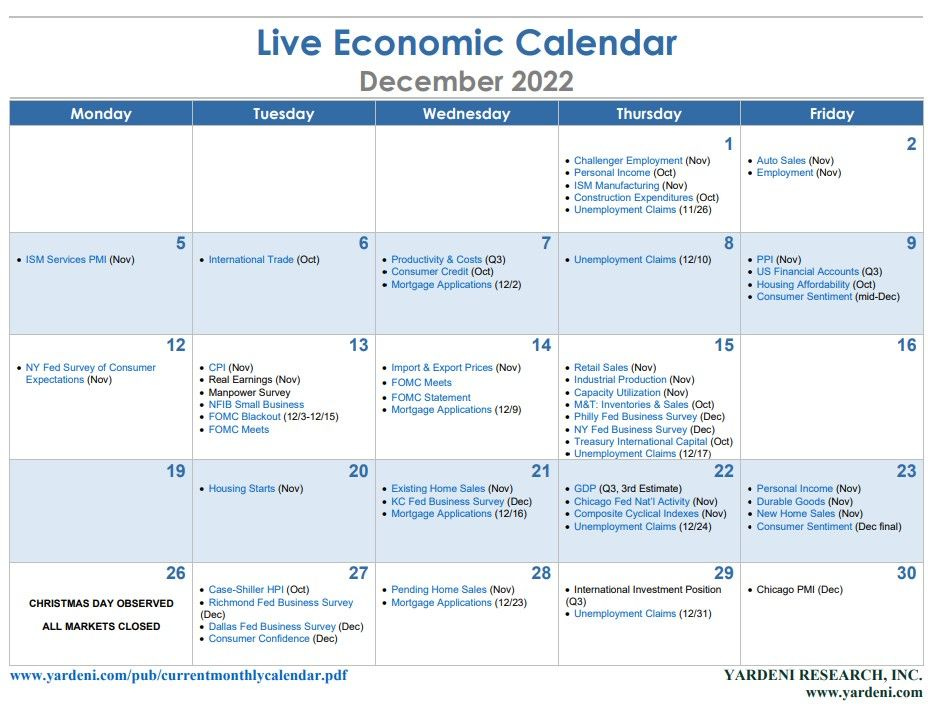
Finally, in case you are looking for MORE on the economic week ahead (more than was offered HERE Saturday),
Yardeni: The Economic Week Ahead: Dec. 19 - Dec. 24
… This week's economic indicators are unlikely to revive the Santa Claus rally in time for Christmas. The focus will be on November's Index of Leading Economic Indicators (Thu.) which is likely to be flat though at a record high as strength in payroll employment offset weakness in production. Then November's Personal Income (Fri.) should confirm that some of the weakness in retail sales last week reflected falling retail prices in some goods sectors and should confirm the ongoing pivot by consumers from goods to services. The PCED inflation rate should continue to moderate.
By the way, on Wednesday, December 13, a Philly Fed press release created a bit of a tweet storm claiming that the official payroll numbers were recently overstated. From March through June: "In the aggregate, 10,500 net new jobs were added during the period rather than the 1,121,500 jobs estimated by the sum of the states; the U.S. CES estimated net growth of 1,047,000 jobs for the period."
Does this mean that the Fed is tightening too much. Maybe, but so many labor indicators continue to suggest that demand for labor well exceeds supply.
And with that in mind, a couple other FOOTBALL related visuals,