sellside observations for the week ahead (12/12); BLKs 'rethinking bonds' (stays bearish), BMO bullish for 2023, and BoEs thinking about costs LARGE bond trades
Good Afternoon. PPI and UMISS-again happened and as data points of interest ahead of this coming weeks double header of supply MONDAY and long bonds Tuesday to clear the decks for the FOMC then WED … well, a couple ZH links
ZH: Core Producer Prices Surged In November; Food & Brokerage Costs Spiked
ZH: UMich Sentiment Rebounds, Inflation-Expectations Tumble
Am not sure any of this would entice ME to be bidding on 3s, 10s OR long bonds, the last ones of the year, just ahead of whatever it is we think the Fed thinks it thinks — to be announced WEDNESDAY.
3yy momentum still bullish but yields seem to be between longer term support (4.80) and shorter term resistance (3.60) …
OK … Moving along TO week ahead and from the narrative creators out there. HERE are a few of Global Wall Streets finest … along with some 2023 outlooks you’ve likely seen / heard about already, some new additions which are worth note,
BMO on 2023: Powell’s Predicament (detailing how 2s get TO 3.25% by end of 23 and long bonds to 3.30%)
BlackROCKs 2023 GLOBAL outlook where they are, “Rethinking bonds” (staying BEARISH or underweight, sorry)
BAML on 10yT fair value as well as CC spending, ‘cooling off’
MS asks IF too many rate CUTS priced in, “…We think that the set-up going into the December FOMC is too bearish with respect to the path of the economy and too sanguine about rate cuts from the Fed…”
And there’s more … In as far as a few OTHER items which may be of interest …
Russel Clark: AM I WRONG ABOUT BONDS?
… We can do a similar chart, but extend this out to 10 years. This chart does scare me. Looking back to the 1960 and 1970s, even in a bond bear market, the 10 year did seem to mean revert back to the average. The current 10 year average of the Fed Fund Rates is only 0.8%, and rising slowly. The implication is that 10 year bond yield could fall all the way back to 1%, even if I am correct that inflation continues and the Fed Fund Rate does not fall.
But I think that is the wrong way to analyse it. A better way to look at it is to compare current Fed Fund Rate to average of the Fed Fund Rate over the last ten years. There is a clear benefit to that way of thinking. The 60s and 70s, were pro-labour eras for me, which shows that Fed Fund Rate can diverge widely from its previous 10 year average. It also shows the clear break in 1980s, where in a pro-capital environment tightening policy relative to the last 10 years would create a recession. As I believe we inflecting to pro-labour environment, I don’t fear the inversion.
Its back to wage led growth in the West, and monetary policy needs to be tight to protect real wages. Yield curve inversion is likely to be the norm for the foreseeable future - and bonds still look like a short to me.
From an OFFICIAL account (BoE)
Do larger bond trades cost more to execute?
… Taken together, these results are interpreted as evidence that information-based explanations contribute to the heterogeneity in size penalty. To the extent that hedge funds and asset managers are more likely to trade on information than other clients, the differential degree of size penalty across client types, is consistent with theories of asymmetric information. These theories predict that larger trades (especially those of hedge funds) are more likely to be informational, so that dealers rationally charge higher execution costs on these trades in order to be compensated for adverse selection risk.
Why does the size-cost relation matter?
There are various dimensions of market liquidity such as the bargaining power and balance sheet constraints of dealers, the price impact of informed trading among others. Observing the identities of clients (and their transaction prices) in bond markets can help disentangle these different dimensions of liquidity and give us a better understanding on how prices are determined in OTC markets in general.
For example, if one aims to learn about the role of dealers’ market power in shaping market liquidity, then one could compare the transaction prices of different types of clients (eg small retail clients versus large asset managers). If, on the other hand, one aims to understand the price impact of informed trading, then one should compare the transaction prices for small and larger trades initiated by the same smart investor (eg a star hedge fund). Our results show that both channels seem to contribute to variation in bond market spreads.
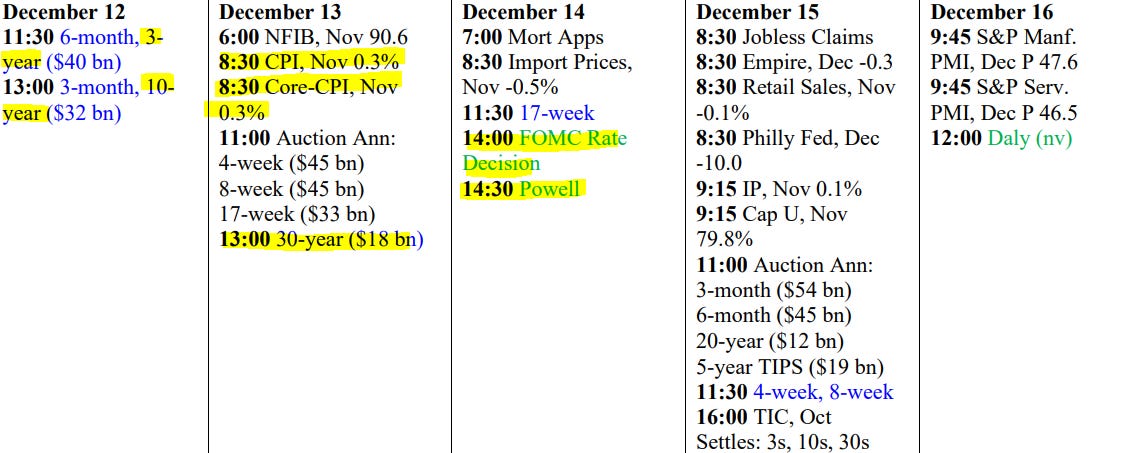
Moving on then TO the week ahead AND for any / all (still)interested in trying to plan your trades and trade your plans in / around FUNduhMENTALs, here are a couple economic calendars and LINKS I used when I was closer to and IN ‘the game’.
First, this from the best in the strategy biz is a LINK thru TO this calendar,
Wells FARGOs version, if you prefer …
… and lets NOT forget EconOday links (among the best available and most useful IMO), GLOBALLY HERE and as far as US domestically (only) HERE …
THAT is all for now. Enjoy whatever is left of YOUR weekend!!


All our times have come
Here, but now they're gone
Seasons don't fear the inversion
Nor do the wind, the sun, or the rain
(We can be like they are)
Come on, baby
(Don't fear the inversion)
Baby, take my hand
(Don't fear the inversion)
We'll be able to fly
(Don't fear the inversion)
Baby, I'm your bond fund manager
La, la la, la la
La, la la, la la