So much for last weekends excusing of TRANSITORY payrolls weakness, eh?? Thanks, CNBC (and just about everyone) for that…
Cycle forward to this weekend and it’s victory laps and recaps from all in this weekends SELLSIDE OBSERVATIONS.
These SELLSIDE OBSERVATIONS in mind, it’s said we’ve got a right to our own views and OPINIONS but not our own set of facts. Clearly it is in the way one uses and views these facts which create a compelling narrative.
I’d like to share some NFP thoughts and charts you will NOT find on this weekends SELLSIDE OBSERVATIONS. The following is from EPB Macro
… Focusing on 2021, total job additions were revised higher by 217,000 payrolls, but the revisions were "backloaded" to November and December, making Wall Street very happy considering the last two months' focus.
While many analysts touted the upwardly revised December job gains, there was little mention that May, June, and July were revised lower by 167k, 405k, and 402k, respectively. Of this 974k downward revision over the summer, 709k was added to November and December, again bolstering the most recent report.
With all that being said, long-time followers of EPB Macro Research know that focusing on the cyclical trend in growth is where we find the most valuable information. After all the data revisions, total employment growth declined to 4.5% in January from 4.6% in December and 4.7% in November. Job growth is now reported to be slightly lower than the newly revised summer dip, but still 1.6% slower than the peak recorded in April 2021.
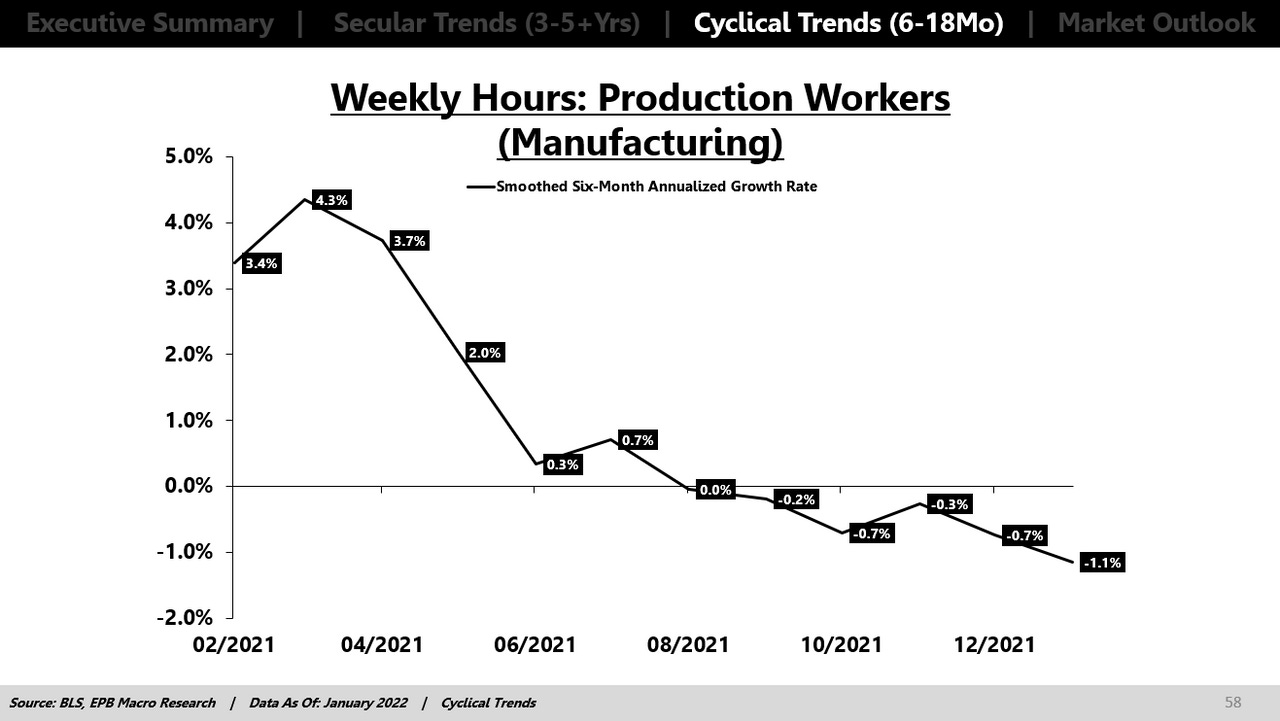
Weekly hours in the manufacturing sector are a long-standing leading indicator of employment growth because employers generally take the less binding step of reducing hours worked before the more permanent step of reducing headcount when margins start to compress. The manufacturing sector is more cyclical than the services sector, which is the logic behind weekly hours worked in the manufacturing sector as a leading indicator.
The growth rate in weekly hours worked for production manufacturing employees dropped to -1.1%, an 18 month low. Continued deceleration in weekly average hours is consistent with further reduction in employment growth ahead.
…Lastly, we can derive a real income proxy from the employment report by taking the product of private employees, average hourly earnings, and average weekly hours. To deflate this into an inflation-adjusted measure of income, we can normalize for the consumer price index using an estimated (0.5%) reading for January's inflation report.
Again, the trend of rapidly slowing real income growth was totally unaltered after the employment revisions.
… There are two opposing forces right now. Central banks are trying to raise rates, and the economy is showing declining growth. Central bank tightening causes all yields to rise (all else equal), and growth slowing causes long-term rates to fall. Right now, the central bank tightening effect is more powerful than the growth slowing effect, but the growth slowing effect is still loud and clear through the material yield curve flattening. Only 18 basis points separate 30YR and 5YR US Swap rates…
Clearly some OUTSIDE THE BOX thinking and EPB Macro’ss worth investigating especially if you’d like a different perspective than the rest of global Wall Street is willing or capable of offering.
A couple more quick bullets to share.
ZH on what was behind the stunning NFP beat
ZH offers RTRS Fed mouthpiece on 50bps March TOO MUCH, not happening
WolfStreet: NFP solves some headscratcher mysteries
StockCharts.com: Don’t confuse cyclical BEAR BOUNCE w/secular bull rally
Daily Chart Report: bonds breaking
And InvestMacro’s update on POSITIONS,
COT Bonds Speculators raise their 2-Year Treasury bullish bets
… Highlighting the COT bonds data is the continued rise in the 2-Year Bond futures bets. Speculative positions rose this week following two weekly decreases and this week’s gain brings the current standing to the highest level in the past four weeks. Overall, the 2-Year bond speculator bets have now been in bullish territory for ten consecutive weeks which marks the longest streak since the fall of 2016 when bullish bets also ran off a ten-week streak. The bullishness has pushed the 2-Year into an extreme bullish speculator strength reading of 91.9 percent (current speculator standing compared to past three years, above 80 is bullish extreme, below 20 is bearish extreme). Despite the speculator sentiment, the 2-Year price has been falling sharply (in tandem with other US bonds) as the US Federal Reserve is getting ready to raise their benchmark interest rate, most likely in the March Fed meeting.
Joining the 2-Year Bond (15,597 contracts) in gaining this week are Eurodollar (11,828 contracts), Long US Bond (27,547 contracts), 5-Year (19,933 contracts), Ultra US Bond (9,652 contracts) while decreasing bets for the week were seen in 10-Year (-10,219 contracts), Ultra 10-Year (-16,826 contracts) and the Fed Funds (-16,837 contracts).
Finally, by now you’ve heard all about USAs debt load surpassing $30 TRILLION and ZH has gathered some VISUAL AIDS for context.
Off to MA in the morning for a quick day trip to drop some travel necessities for Thing 1 who’s HOPEFULLY off to Thailand next weekend for school assignment, working with Thai govt on computer science / traffic planning project! And so, that’s all for now.


