sellside observations, economic calendar (s) and a few things I think I think (one mans trash is another's Treasuries, month/quarter end...) and some charts
With yields at the highest levels in years it’s worth pausing a moment before the markets open this evening and before St. Pete takes on NC. It may also be wise to pause before jumping TO any snap decisions that the end of the (LONG)bond bull market is over.
Ok, I realize, it’s a little late and that decision has already been made (several times now, over the past several years) BUT … there's likely to be an asset allocation and index demand vs equities in the days just ahead.
Thursday is not only month end but quarters end as well. But wait, there’s more.
We also will turn the fiscal year end for Japan and last year the price action was eerily similar to this year. There was robust Asian selling in February and March but on April 1st the bond market took off higher in price for a combination or reasons.
There may have been selling in February and March of last year to shore up liquidity for Evergrande and others but it quickly reverted to buying after fiscal year end was over in Japan etc.
The bond market may consider Asian demand for these yields will be a possible and meaningful technical input in the next week or so.
With double-header Monday (2s @ 1130a, 5s @ 1p) and 7s on Tuesday, the next few days might (continue to)seem like an eternity but then, it’s always darkest before the dawn.
Specific TO the front-end supply, please see below and a twitter thread from Beth Stanton detailing how it’s possible for an UNSCHEDULED REOPENING of USTs happens this week.
And while it may seem like USTs are ‘garbage’ — at least this possible ginormous 2.125% of March 31st 2024 might be ( > 120bb) in the REPO market, well, that saying goes — one mans trash may be another’s TREASURIE$ ?? More below…
HERE are a few sellside observations from global Wall Streets inbox where I’d highlight what the best in rate strategy is saying and doing — specifically RAISING YIELD and FED HIKE FORECASTS, getting stopped OUT of front-end longs and debating whether or not ‘50 is the new 25?’ … they are ALSO offering some NFP guesses and pre-caps / victory laps and talking about quarterly rebalancing OUT OF STOCKS — yes you guess it — and IN TO FI. SOME of the most trusted in the biz are detailing how it IS in fact different this time (Sunday Start) and there are several interesting charts, too …
Speaking of things from the CHARTS department, a few things everyone is watching and thinking about including but not limited TO the end of the (LONG)bond bull market …
… The Biggest Picture: 2020 markets secular low for inflation & yields – 3rd great bear bond market underway (Chart 2); prior great bears were 1899 to 1920 and 1946 to 1981; deflation to inflation, globalization to isolationism, monetary to fiscal excess, capitalism to populism, inequality to inclusion, US dollar debasement…long-term yields >4% by '24.
Here’s an interesting one to keep handy on Thursday … THIS one from Go-TechniKAL
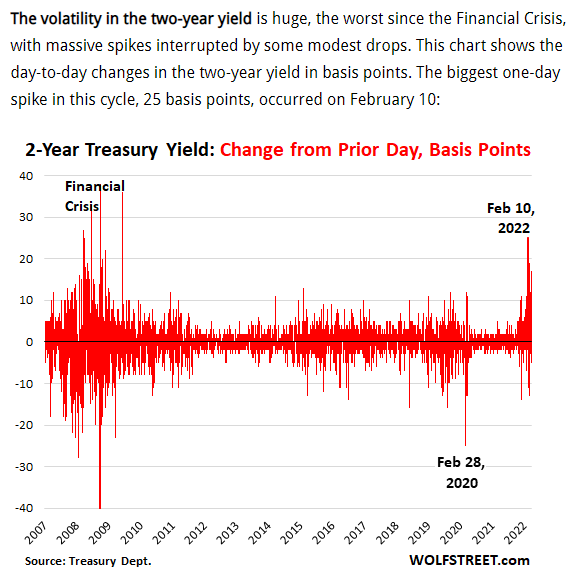
WolfSt.com: The Treasury Bond Massacre and the Spike to 5% Mortgage Rates: This is All Going Very Fast
For somewhat longer-term context, The Market Ear,
HERE, Hedgopiacombines charts and POSITIONS and offers this picture worth 1000 words,
AND THIS longer-term (back TO 1900) perspective on what many/most consider to be an absolutely USELESS index (and yet, we still slow down to look and consider)
… The Dow has traded at or above long-term resistance several times in the past — 1901, 1906, 1915, 1929, 1966, and 1999.
It is worth noting that soon after each resistance test, the market struggled …
Finally, a couple / few economic / fundamental calendars which I will refer back to as the week progresses …
From the best in the strategy biz is a LINKthru TO this calendar,
And as you’ll note I’ve hightlighted 2s and 5s both MONDAY and with regards to some specifics, a twitter thread you really SHOULD READ, HERE for this and more
You should read all about how it’s possible for single issue to become quite large (NORTH of 120bb — 2.125% of March 2024) and WHAT that means at least as far as financing gear-heads are concerned.
Moving right along to those trying to put / keep the FUN in FUNduhMENTALS, here’s an ECO CAL from JEFF,
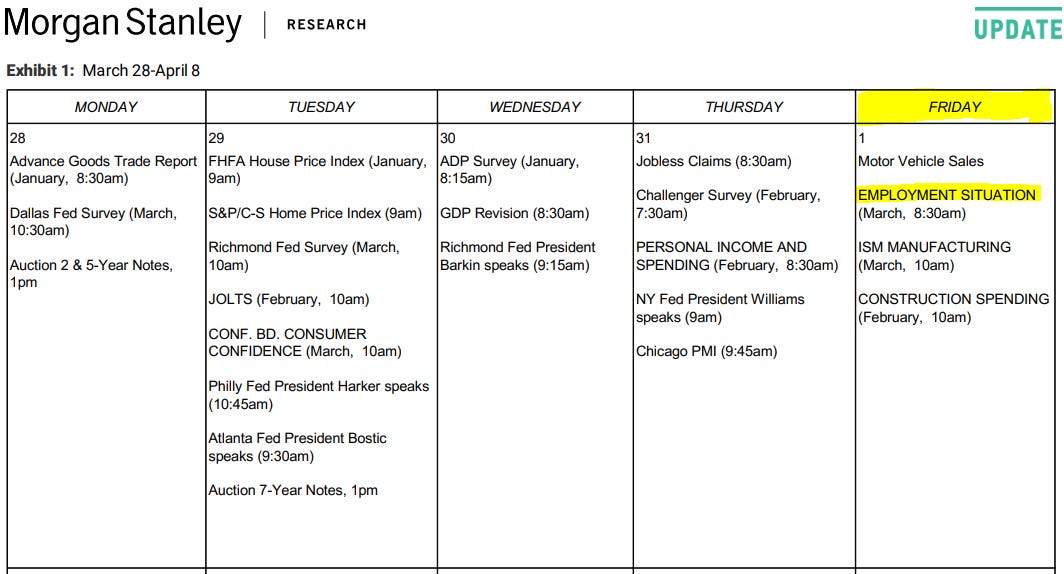
From MS (with some words on NFP Friday),
… Employment Situation (Friday, 8:30am): We expect nonfarm payrolls rose 550k in March following a 678k increase in February. This is just shy of the remarkably stable trend of about 580k/month since the middle of last year. We expect continued modest gains in public employment, so that private payrolls increased 535k. This, in combination with a slight uptick in labor force participation from 62.28% to 62.34%, is expected to lower the unemployment rate to 3.6%. We expect average hourly earnings growth was 0.4%M in March, lifting the year-over-year rate from 5.1% to 5.5%, and the average workweek was unchanged at 34.7.


")