With ‘markets’ forced to put aside fun-duh-mentals for the time being (or worse, to price in some fun-duh-mental outcomes not yet fully understood and which go against the hike / QT guesstimates currently widespread — ie, past peak hikes) and instead, trading geo-POLITICAL headlines of meetings to take place next week …
Global markets having to wait until sometime next week be like
It is with that in mind, I’ll try to keep this mornings update short. You know where I’m going first …
WHILE YOU SLEPT Treasuries are modestly lower and the curve flatter after Blinken of the US and Lavrov of Russia agreed to meet next week on Ukraine Hill. DXY is little changed (+0.06%) while front WTI futures are lower (-1.8%, see attachments). Asian stocks were mostly lower (ex-China) after US stocks dumped yesterday, EU and UK share markets are mixed while ES futures are +0.4% here at 7am. Our overnight US rates flows saw choppy price action during Asian hours around the Ukraine headlines- a rally above yesterday's high in Treasuries sharply reversed after the Blinken-Lavrov headlines. The bear flattening theme carried through into the London session with better paying in 10's a noted flow from the desk. Overnight Treasury volume was solid at ~150% of average overall.
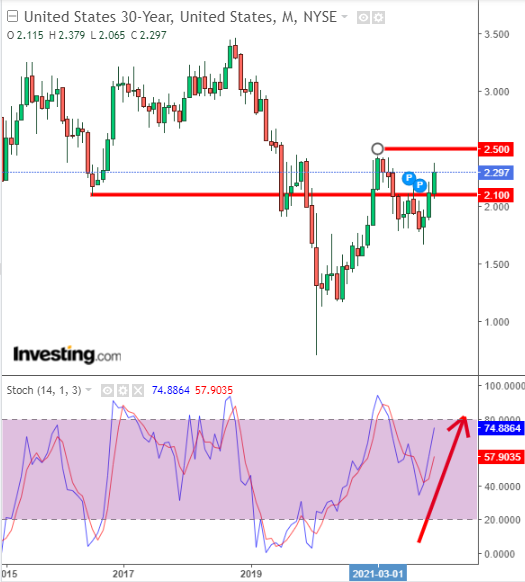
And same shop with some news and a chart which caught MY attn given MY chart below of 30yy WEEKLY (and yesterday’s attn to FI techs and a plan of sorts,
US News: Cleveland's Mester (V) said she would support selling some MBS 'at some point' during QT to "minimize the effect of our balance sheet holdings on the allocation of credit across economic sectors" BBG The DOJ and FBI will be hunting down US companies exploiting the supply chain crisis for 'illicit profits' DOJ US [truck] freight volumes suffered in January under Omicron with the Cass freight shipments index -10.8% MoM and -2.9% YoY Cass In US housing, the Observed Rent Index rose 15.9% YoY during January, the fastest pace on record Zillow The US 's largest auto retailer said that half the cars arriving in the next 90 days are already sold NYT One of the US Tech darlings just tumbled out of the world's top-10 (by market value) rankings BBG Calls grow for the US to consider a 4-day workweek like Europe has MSN
… Our next attachment is one we've highlighted recently: the weekly chart of TLT's, the 20+-year Treasury ETF. We've been pointing out the pretty clearly-defined range support near 134.45 in TLTs- a level roughly equal to the 2.44% support level in 30yr Treasuries. Bonds haven't gotten to their equivalent support yet (flatter 10s30s a headwind for that) BUT... TLTs did test their support this week, respecting and rejecting it so far. So keep this potentially key support in mind if/when probed again.
… here's the longer history of Treasury 2s5s30s in a monthly chart. The entry level for 2s5s30s does look historically attractive, no? Moreover, 2s5s30s has tried to push above resistance derived from the 2009 highs for this 'fly in each of the past 4 months- never closing any of those months above it, at least so far.
Belly lookin’ almost BUYABLE, eh?
… for some MORE of the news you can use » IGMs Press Picks for today (18 FEB) to help weed thru the noise (some of which can be found over here at Finviz).
…Let's walk through the geopolitical developments that came before the slightly more positive news this morning. The mood was very jittery all day yesterday, with Ukraine’s military saying not long after the European open that a kindergarten in Luhansk had been hit by separatist shelling, with two civilians concussed. Then in the European afternoon, US President Biden said that the probability of an invasion was “very high”, and that “Every indication we have is that they are prepared to go into Ukraine”, adding that a “false-flag” operation that would give Russia an excuse to invade was underway. In Brussels, we then also had NATO’s Secretary General Stoltenberg and US Defence Secretary Austin both saying that they didn’t see signs of Russia withdrawing troops. On the Russian side, they moved to expel the Deputy Chief of Mission, the number 2 official, from the US Embassy, and at the United Nations they restated their claims that “war crimes” had been committed by Ukraine. Russian officials continued to deny that an invasion was planned let alone underway.
With geopolitical risk very much the dominant market theme right now, it’s worth highlighting a chart from a table from our equity strategists that I borrowed for my chart of the day earlier this week. It shows the declines in the S&P 500 around geopolitical events, and shows that typically the selloffs have been short-lived (the median selloff was -5.7%), with a duration of around 3 weeks to reach a bottom and another 3 weeks to recovery from their prior levels. Another pattern is that ultimately, the underlying economic context tends to dominate, so if you believe the template, much might depend on what you thought momentum was before the sell-off. Here’s a link to my chart of the day as well as Binky’s original piece (link here).
He continued, pointing out what I think quite obvious,
One of the effects of developments in Ukraine has been to make investors more cautious about the prospects of aggressive central bank action to tackle inflation. Immediately after the very strong CPI report from the US last week (+7.5% year-on-year), Fed funds futures were basically fully pricing in a 50bp move in March at the intraday peak. But since the Ukraine situation escalated last Friday, that’s almost continuously fallen back, with futures only seeing a 38% chance of a 50bp move next month. It’s a similar story for other central banks, with overnight index swaps for the next BoE meeting now “only” showing a 50% of a 50bp move, down from an intraday peak above 90% last week. It’s been a more subdued story for the ECB, who aren’t expected to hike for some months yet, but even there the amount of hikes being priced by year-end has fallen to 42bps, having been above 50bps just a week earlier…
And a couple other links / bullets / visuals which I’m going to review and which might be of interest to you, as well. First a visual of 30yy WEEKLY where the path of least resistance (and momentum) still appears to be HIGHER BUT …
… The youngest of three sons, Mr. Jones remembers getting up at 4:30 a.m. twice a week to fill up the family’s station wagon and try to beat the lines at the pump during the 1979 energy crisis. He put the car in neutral when driving downhill to save gas.
The spell of rapidly rising prices left a lasting impression on Dr. Jones. He and his wife have long been frugal. They live in a smaller house than they can afford, prefer saving for a rainy day instead of spending money for a new car or jewelry, and pay off their credit card debt each month.
“I have a pathological debt aversion,” Dr. Jones said.
Early experiences with money stress, such as a prolonged period of inflation, have lasting effects on spending and saving habits, said Dan Egan, managing director of behavioral finance and investing at investment-advice company Betterment LLC. The younger you are during a negative financial event, the deeper impression it can leave …
Sounds alot like how we’re all living now, right? READ the story and when I did, I couldn’t help but think the bigger (mess we’re in NOW) they are, the harder they fall.
First, as much as investors will always say that positioning around geopolitics is a mug’s game, they’re not called flight-to-safety moves for nothing. The threat of another Russian attack on Ukraine remains palpable, and has cooled some bets on a half-point rate hike next month (markets currently favor a quarter-point move). Moreover, it’s argued that a revival of the international nuclear deal with Iran could take some heat out of oil prices, thereby easing inflationary pressures.
Second, 2% isn’t exactly a hefty yield selloff. Trend-wise, we’re still in a bull market for Treasuries.
And third, there’s the big question of the growth outlook.
Solita Marcelli at UBS Global Wealth Management doesn’t see the 10-year yield getting much higher, at least not while the market remains unconvinced by the Fed’s view of the neutral policy rate. Rates traders have already priced in roughly six hikes this year, and the Fed simply delivering on these expectations won't be enough to boost the 10-year by much, in her view.
“That’s because the market is also pricing for the Fed to only hike to about 2% in this cycle, while the Fed’s forecast for the terminal value of the fund rate is 2.5%. For the 10-year yield to go much higher the market will likely have to raise its implicit expectations for long-term growth, unless the rise is due entirely to inflation staying elevated indefinitely.”
The market’s views of long-term growth are pretty underwhelming at the moment, if we consider expectations for interest rates beyond 2023. Our rates guru Edward Bolingbroke noticed this week that eurodollar contracts over that horizon have begun to build in rate cuts. That dovish kink in the eurodollar curve is an exceptionally reliable precursor to a slide in 10-year yields, according to MacroMan Cameron Crise, who goes so far as to say it’s infallible.
So bond bulls can take heart. Lest we get too caught up in the technicals, though, the implications of a renewed decline in rates are sobering.
Ask just about any market veteran about the Fed’s skill at tapping the brakes on an overheating economy and you’ll get some pretty dry responses.
Who Bought the $6.5 Trillion in Treasuries Piled on the Incredibly Spiking US Debt in 22 Months? Who Holds the $30 Trillion? The question is particularly hot because Treasuries are now ugly instruments with the worst punishment yields ever…
And as a visual learner having learned a bit from WolfStreet.com — perhaps too much — I couldn’t help but TRY and lighten the mood. This one from Investing.Com