Good morning. Markets are STEADY as they continue to digest all the ‘good’ news of Russian troops pulling back yesterday (ignoring PPI) AND ahead of this mornings (omicron impacted) ReSale Tales. Fully scapegoated ahead of time, at least we’ll have the data and a few hours of trading to prepare for this afternoons 20yr auction …
… which looks to ME and my now less professional lens, to be at / near ‘support’ established this past May as momentum still suggesting path of least resistance is HIGHER (a break?) but becoming overSOLD … perhaps a continued selloff in the bond market will be viewed as concession…But then, bid on 20s 1p and THEN learn what FOMC minutes have to offer an hour later?
WHILE YOU SLEPT Treasuries are modestly higher with the belly slightly outperforming ahead of a big-ish day for rates events (retail sales, 20y auction and FOMC Minutes). DXY is lower (-0.2%) while front WTI futures have clawed back some of yesterday's losses (+1.5%). Asian stocks were higher (Korea's KOSDAQ +4.5%), EU and UK share markets are little changed while ES futures are showing FLAT here at 7:15am. Our overnight US rates flows saw more Asian real$ buying in the long end as the curve bull steepened during their hours. Flows were light and TY futures volumes tell the tale at 70% to 75% of their 30-day average.
Same firm offers some NEWS / charts / tidbits thinking LIQUIDITY and 5s30s,
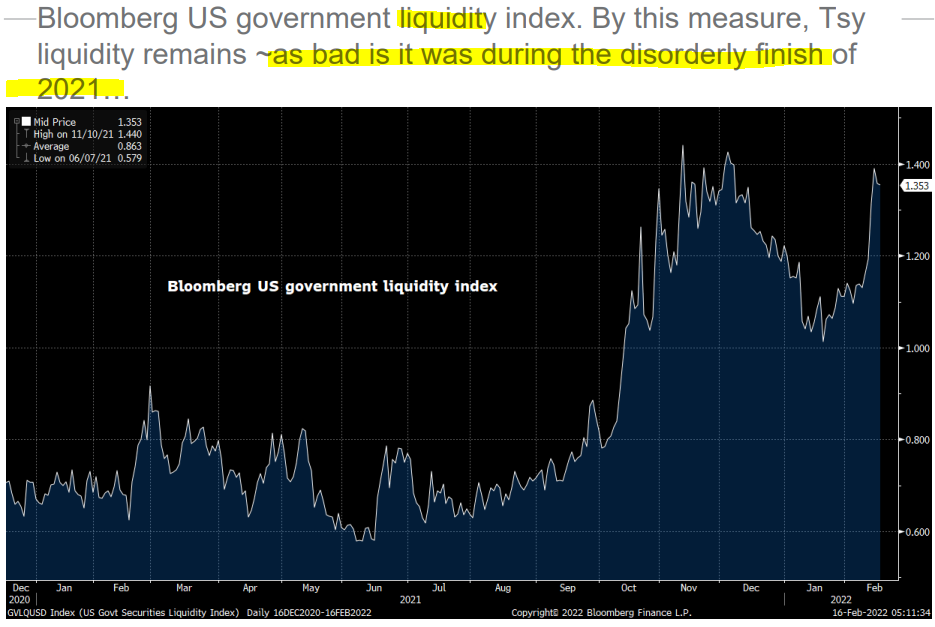
US News: Can the Fed tame inflation without causing a recession? WSJ Treasury market liquidity is eroding and nearly as bad, by some measures, as late last year (see attachments) BBG Rent inflation will stick FT Opinion Pensions pile into bonds TAI
… Bottom line: Those adding or still in 5s30s flatteners may be pushing on a string here while others wishing to add 5s30s steepeners should now eye the entrance.
… Finally, our last picture is an updated look at Bloomberg's US government liquidity index. This is a companion to the BBG link in the top section on the same topic. It's a bit shocking that today's liquidity is basically as bad as it was during the extremely disorderly trade late last year. I guess a Fed policy trend reversal will do that... We'll see you this afternoon and good luck today.
… for some MORE of the news you can use » IGMs Press Picks for today (16 FEB) to help weed thru the noise (some of which can be found over here at Finviz).
And in the category of ‘this just in’, MBAs mortgage applications data offering some record setting data — this via CNBC …
The average contract interest rate for 30-year fixed-rate mortgages with conforming loan balances ($647,200 or less) increased to 4.05% from 3.83%.
The average purchase loan size was a record $453,000.
Applications to refinance a home loan are now less than half the volume of a year ago.
There was ALSO some Chinese data overnight worth noting … from REUTERS,
China inflation was below expectations, PPI was 9.1% yoy vs f/c 9.5%, CPI rose 0.9% yoy vs f/c 1.0% and from GS:
CPI and PPI inflation declined in January Bottom line: China's CPI inflation fell to +0.9% yoy in January (vs. +1.5% yoy in December), primarily due to a high base of food prices. PPI inflation fell to +9.1% yoy in January from +10.3% yoy in December, primarily on a high base of prices in upstream sectors. In year-over-year term, we expect CPI inflation to stay moderate and PPI inflation to decline further in the near term.
Here are a couple interesting graphics which caught my eyes from John Authers
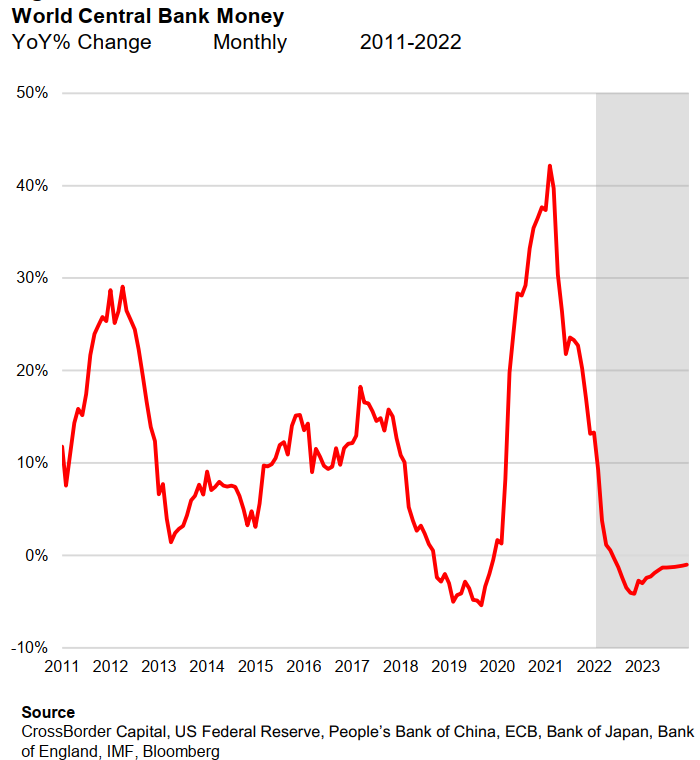
…Mike Howell of Crossborder Capital Ltd. in London is the doyen of liquidity analysts. By his measure, the liquidity created by central banks has stopped growing and is now in a significant decline. It is the second derivative of the change in the speed with which liquidity is flowing that has the greatest impact on markets:
This matters because the great post-Covid rally has been driven almost exclusively by the provision of extra liquidity. As Howell has demonstrated in the past, the rise in share prices has been achieved merely by by diverting a normal amount of new liquidity into stocks, and is not driven by any over-exuberant increase in allocations to equities.
As he shows, provision of liquidity and the creation of wealth through higher asset prices are intimately connected over time. Falling liquidity, while obviously necessary now that the emergency has passed and inflation is rising, could well signal problems ahead:
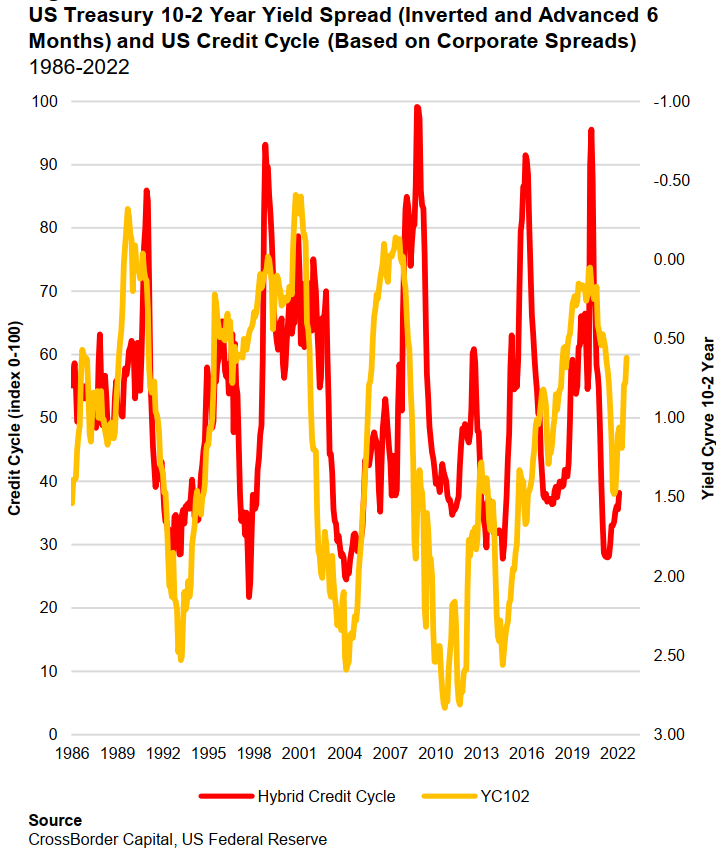
Shifts in liquidity have also naturally had a profound effect on bond markets. Yields are rising, but particularly for shorter maturities. The yield curve, or the spread between two- and 10-year bonds, has flattened swiftly in the last few months, suggesting that the market anticipates an early end to the forthcoming tightening regime from the Federal Reserve. A flat yield curve can be a self-fulfilling prophecy, because in practice it tends to force central banks from persisting with higher rates.
A flat yield curve also tends to have a lagged effect on the credit market as it becomes more expensive to refinance debt. Over time, Howell shows in this chart that a flatter yield curve tends to be followed quite swiftly by rising credit spreads. While there is no great issue with solvency at present, this suggests that credit may already be causing problems by the end of this year:
That's what makes it hard for the Fed to continue with rate hikes. But as Howell shows, there is a 50-year history that the Fed never hikes rates once the fed funds rate has risen above the five-year yield. That point could come before the end of 2022, and suggests that it will be very difficult to continue with tightening to the extent that the Fed currently believes necessary to bring down inflation to its target.
For even MORE and without a ‘paywall’ (that I’m aware of), and specifically on the bond market LIQUIDITY aspect,
ZeroHedge: A Far Greater Risk Emerges: Bond Market Liquidity Is Quietly Collapsing … “As volatility has picked up, market depth has fallen,” JPMorgan rates strategists Jay Barry wrote in a Feb. 11 note, adding that the “softer Treasury market liquidity acted as an accelerant in the latest moves." Market depth, a key measure of liquidity -- derived from the sizes of bids and offers on the BrokerTec trading system -- is depressed for all Treasury tenors, and worse for two-year notes than for the five- and 10-year.
With these CHARTS in mind, I thought these CREDIT SPREAD / RISK related charts from 1stBOS weekly macro themes also interesting