Good morning. I looked at this chart of 2yy before heading home,
…and I thought … oh, wait, I AM home … AND THEN I thought — that’s a nearly 30bps daily candle — been a long while (2009 to be specific) since we’ve seen moves like this on ANY end of the yield curve, let alone 2yy. I then thought
How about that CPI! Holy smokes!!
ZeroHedge: Rate-Hike Odds SPIKE After Hottest CPI in 40yrs
So much for JPMs whisper’er, eh?? For somewhat MORE from ZH,
For more on the Ballad of Bullard have at a large Canadian banks closing commentary. That was then and this is now and so here’s what happened,
WHILE YOU SLEPT The Treasury curve has pivoted flatter off a little changed 2y note overnight. DXY is higher (+0.3%) while front WTI futures are too (+1.2%). Japan was out on holiday but the rest of the Asian stock markets were lower, following NY. EU and UK share markets are all lower too (SX5E -1.05%, FTSE 100 -0.8%) while ES futures are showing -0.5% here at 7am. Our overnight US rates flows saw an active London trade in very thin markets with EU real$ names buying the long-end. HF's have faded the 5s30s flattening again today and overnight Treasury volume was impressively ~130% of average even with Japan out.
And same shop with some news and a 2yy chart,
US News: Citi now looks for a 50bp March hike after "stronger, broader" price pressure Citi The Fed doesn't yet favor a half-point hike or an emergency move BBG Daly and Barkin downplayed 50bp hike risk overnight MNI and RTRS The history of inter-meeting Fed rate moves BBG Timiraos of the WSJ: no longer a question of 'if,' but 'how much.' WSJ The Fed will test the largest banks for a scenario where unemployment spikes to 10% and markets seize up WSJ US foreclosures surge in January after the end of the pandemic freeze BBG Investors pull $1.5bn from bond ETFs during January (after $27.3bn pumped into bond ETFs in December...) FT
…UST 2yrs: Some in the socials yesterday swear it's a snowboarding half-pipe. Well, we're nearing the top of the wall or support we've been eyeing near 1.69%.
… for some MORE of the news you can use » IGMs Press Picks for today (11 FEB) to help weed thru the noise (some of which can be found over here at Finviz).
Now in light of all this AND the obvious — BULLard + CPI, exactly what did you THINK Goldilocks was gonna say? Right,
For somewhat MORE on CPI and BULLard, this from a large German bank who doubled down (or up) on hike calls (note here),
… Bullard’s remarks helped accelerate the policy repricing that had already begun after CPI. The probability of a 50bps hike in March rose to 80%, which was up from 29% at the close the previous day, and earlier briefly priced in more than a 100% chance of a 50bp hike during Bullard’s remarks. This growing conviction in the odds of future tightening could be seen beyond March as well, with 114bps worth of hikes now priced in by the July meeting, crossing 100bps for the first time, which would imply back-to-back hikes until then if the Fed were to move in 25bp increments. And looking at the year as a whole, futures are now pricing in 6.6 full hikes by the December meeting (5.5 previous close), which is more than double the 2.96 hikes expected at the end of 2021, which let’s not forget was only six weeks ago today.
When it came to rates yesterday, that CPI report was the catalyst to finally push 10yr Treasury yields above 2% for the first time since August 2019, with a +10.8bps rise on the day seeing it close at 2.05%. The move was driven predominantly by real rates, as real 10yr yields increased +8.3bps. However, the big story of the day was the much sharper moves at the front-end as investors priced in a more aggressive Fed. The 2yr yield rose an astonishing +21.4bps on the day to 1.58%, the largest daily increase since June 2009, meaning that the 2s10s curve reached its flattest since August 2020, at just 44bps. For those of us warning about recessionary signals, that’s an ominous sign given that the 2s10s curve has inverted prior to every single US recession in recent decades…
Here are some updated FI technicals which hit inbox ~125p (yest)
Chart of the Day: 10yr US Bond Yields completed a bearish “pennant” continuation pattern last week following the strong payrolls report, and now the strong CPI report is seeing the market break above the Q4 2019 high and important psychological support at 1.965/2.00%. A weekly close above here would significantly reinforce the multi-year yield base that remains in place to open up 2.16/2.18% next and eventually our newly revised 2022 objective at 2.34%.
… Our successful tactical bearish bias from resistance at 1.77% was neutralised following the move to support at 1.965%. From here, we would turn tactically bearish again on a pullback to resistance at 1.975/965%, with next support then seen at 2.16/18%.
They go on to detail successful tactical bearish trades in 5s, too. Turning tactically bearish AGAIN at resistance which is now, 1.825%, in this shops eyes. Finally, they say BONDS have more fun and this same outfit will STAY tactically bearish and continue looking for 2.32/33 THEN 2.42% where they’d put hay in the barn (while stopping out at 2.03% resistance…).
Now BEFORE BULLard hit the tapes, this from a large German bank
A month ago we highlighted risks that more persistent price pressures could cause the Fed to raise rates much more aggressively this year (see “What’s in the tails? Why the speed of impending Fed policy tightening could surprise”). This morning’s CPI data, which rose more than expected with outperformance driven by persistent items like rent and medical services, has turned that risk scenario into a baseline. With inflation pressures showing signs of accelerating in the near term, we now anticipate that the Fed will undertake a 50bp rate hike in March to kick off the tightening cycle. More limited evidence of waning inflation pressures in the back half of the year suggest that the Fed will continue their more aggressive response for longer. As such, we anticipate further 25bp rate increases at every meeting this year except for November, bringing the total increase in the fed funds rate in 2022 to 175bps.
This more aggressive policy response raises downside risks to growth. Engineering a soft landing for the economy is never easy. It is especially difficult with inflation well above target and accelerating at a time when the unemployment rate is already at the Fed’s view of maximum employment. We have highlighted how consumer indicators currently see nearly 50% risk of a recession over the next year (see "Consumers are most pessimistic in 50+ years on this metric"). While that likely overstates the near-term potential for a downturn, a more aggressive Fed response aimed at taming inflation clearly raises recession risks in 2023 and 2024.
Not far behind this more dramatic and updated Fed f’cast, was this chart of the day
The Fed should just end QE now but it probably won't After this morning's upside CPI surprise, it feels appropriate that the Fed should be taking more drastic measures to curb rising inflation. One potential consideration is to end QE early. Tomorrow, the Open Markets Desk is planning to release the final buyback schedule for purchasing another $20bn in Treasuries over the next 4 weeks. In our view, it makes very little sense that QE should run for another month with inflation rising much faster than expected.
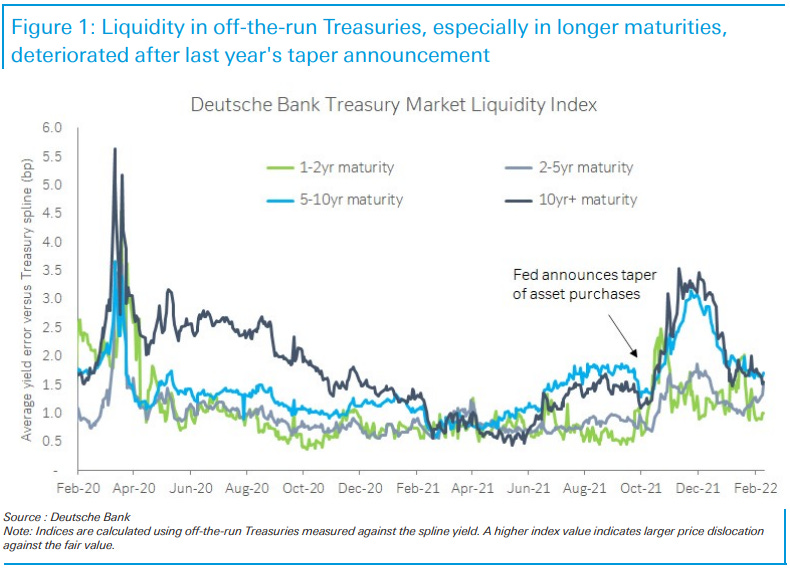
We think there is a small chance of the Fed pulling its planned schedule release, but the downside risks may be too great for the Fed to actually do so. In recent weeks, multiple Fed speakers including Chair Powell have said that QE should end in March as planned, so backtracking on their comments after one economic data report could send the wrong message to the public and hurt the Fed’s credibility in the long run. Additionally, abruptly ending QE could lead to unwanted market disruptions. As today's chart shows, market liquidity for off-the-run Treasuries had deteriorated after the Fed's QE taper announcement last November and has only recovered recently. Primary dealers have also noted reduced liquidity in off-the-runs to the Treasury in the most recent refunding meeting. As a practical matter, the Fed should just end QE now, now but letting it finish as intended might just be the least bad of the two awful options.
THIS makes a fair amount of COMMON sense and is why we’ve got no truer saying than common sense ain’t so common.
A few more links to carry you through UoMISSaGAIN data at 10a on into the weekend.
WolfStreet.com: Mortgage Rates Hit 4.02%. Two-Year Yield Spikes by Most since 2009. Ten-Year Yield Goes over 2%. All Heck Breaks Loose
BBGs Weekly Fix: Inflation Bombs Send Bonds to the House of Pain? … Thursday’s inflation beat shattered nascent optimism in the bond market that the worst of the damage the imminent Federal Reserve rate-hike cycle could do was behind it. Less than 24 hours after investors piled into 10-year notes at the strongest auction in years they were busy piling back out at a rate of knots. Ten-year yields spiked above 2% for the first time since 2019 and two-year yields staged their biggest one-day increase since a decade before that -- way back in 2009.
Treasuries are now off to their worst start to any year since at least 1980, down 3.8% at the end of Thursday. They could yet post the worst opening on record -- the Bloomberg Treasuries Index only has daily data from 1994 onward, so at the moment we have to compare year-to-date performance to the losses in 1980 through to the end of February of that year which came in at 6.5%. With the current quarter close to the halfway point and Fed officials open to the possibility of a half-point hike in March the potential is there for this year to outpace 1980’s collapse. ..
… In the fixed income markets, traders and investors have recalibrated their expectations for how high yields need to be to accommodate the changing environment. The 10-year U.S. government bond yield has doubled since the start of last year, reaching its highest level since August 2019. The consensus forecast among analysts surveyed by Bloomberg News is that the benchmark will continue to head higher in the coming months.
That market reaction is echoed around the world. Global bonds, as measured by the Bloomberg Global Aggregate Index of more than $60 trillion of investment-grade debt, have lost value for six consecutive months. Their total return in January was -3.51%, the worst outcome since the start of the pandemic.
Finally, this last OpED — again, these are OPINIONS so treat them as such, Authers:
… Behind the headlines, perhaps the most useful numbers come from the Cleveland Fed, which compiles a trimmed mean (excluding the highest and lowest outliers) and a median. These give a good sense of underlying inflationary pressure, and unfortunately the trimmed mean is at yet another new high since the series started 40 years ago.
More important data come from the Atlanta Fed, which divides the components of inflation into sticky and flexible categories. Unsurprisingly, flexible prices have been at a remarkable level of late and continue to accelerate. It’s hard to see how a reduction in headline inflation can't be avoided later this year as some of these prices return to normal. However, sticky price inflation is now as high as it has been in decades, albeit at a much lower level. The most likely scenario appears to be that inflation will peak soon, but that rising sticky prices will insure that it doesn’t return to the Fed’s target of 2%:
…Not exactly sure where in school or in markets life over the past 30yrs I missed the equation that ATLANTA > Cleveland but again, Authers VIEW so continue reading for more of HIS lines of reasoning,. if you’d like … He reminds us of another equation which has been drilled home for centuries,
… The market reaction to all this has been dramatic. The intervention by James Bullard, of the St. Louis Fed, to suggest a 50 basis points hike only served to stir up activity still further. One clear lesson is that predictions that stocks would continue to outperform bonds are being proved correct. However, as this is happening via declines for both, it’s not necessarily terribly reassuring. It is true that stocks have been cheap relative to bonds, but this hasn’t stopped them from falling:
… Moves in the bond market have been nothing short of phenomenal. The rebound of the two-year Treasury yield looks compellingly like the half-pipe on which Olympic snowboarders have been competing:
The 10-year Treasury yield is back above 2%, and once again threatening to rise above its long-term and very well established downward trend. When it has neared this trend line in the past, it’s often meant problems for equities:
And rounding out this mornings update is a ‘toon from investing.com which sums up the central banking community …