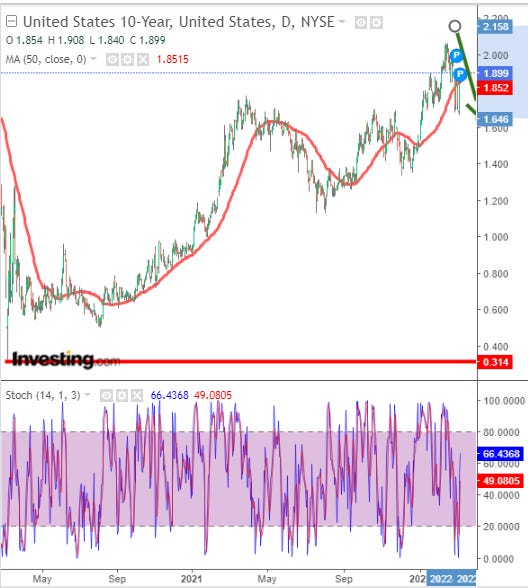
On this day in 2020, 10s hit 31.37bps and today, we’ll have a DIPportunity to help Dept of Treasury finance it’s national debt by facilitating the sale of 10s @ nearly 2.00%. To savers this might seem better than 31bps but when adjusted for inflation, well, you’ve heard this story before. Here’s a look at 10yy, DAILY in that context…
The rest is going to be left to a couple of morning updates from the best in the biz.
From the great white north,
No Clear Answer, Just a Market … Overnight Events * Chinese CPI, Feb – unchanged, as expected at +0.9% YoY. PPI slowed to 8.8% YoY vs. 9.1% Jan and 8.6% consensus. * French Total Payrolls, Q4 – increased +0.4% vs. +0.5% Q3 and +0.4% consensus. Private Sector Payrolls revised up to +0.6% vs. +0.5% anticipated. * Italian Industrial Production, Jan – disappointed at -3.4% MoM vs. -1.1% Dec and -0.5% forecast. YoY pace disappointed at -2.6% vs. +4.8% Dec and +3.2% consensus. * Japanese real GDP, Q4 Final – revised lower to +4.6% vs. 5.4% initial and 5.4% consensus. Consumption revised down to 2.4% vs. 2.7% initial. * MBA Mortgage Apps, week ended Mar 4 – rose to 8.5% from -0.7%. Purchases increased to 8.6% from -1.8% and refis rose to 8.5% from 0.5%.
Overnight Flows Treasuries were cheaper overnight with the belly of the curve leading the move. Overnight volumes were subdued with cash trading at 72% of the 10-day moving-average. 5s were the most active issue, taking a 41% marketshare while 10s were a distant second at 29%. 2s and 3s combined to take 20% with each taking 10% marketshares. 7s were light a just 6%, 30s took 4%, and 20s <1%.
as far as what happened from US money center bank — you know who …
… WHILE YOU SLEPT Treasuries have been led lower by the belly of the curve as EU/US/UK stocks rebound smartly while energy prices recede somewhat. DXY is lower (-0.35%) while front WTI futures are -3.1%. Asian stocks were mixed but EU (SX5E +4.5%, SX7E +6.8%) and UK (FTSE 100 +1.55%) have snapped sharply higher while ES futures are showing +1.5% here at 6:50am. Our overnight US rates flows saw Asian real$ buying during the dip in their hours with yields continuing higher into London's open as risk assets staged a notable turnaround. Later this morning we'll see the last of the scheduled Fed buybacks in Tsy 2.25y-4.5y paper. Overnight Treasury volume was about average all across the curve…
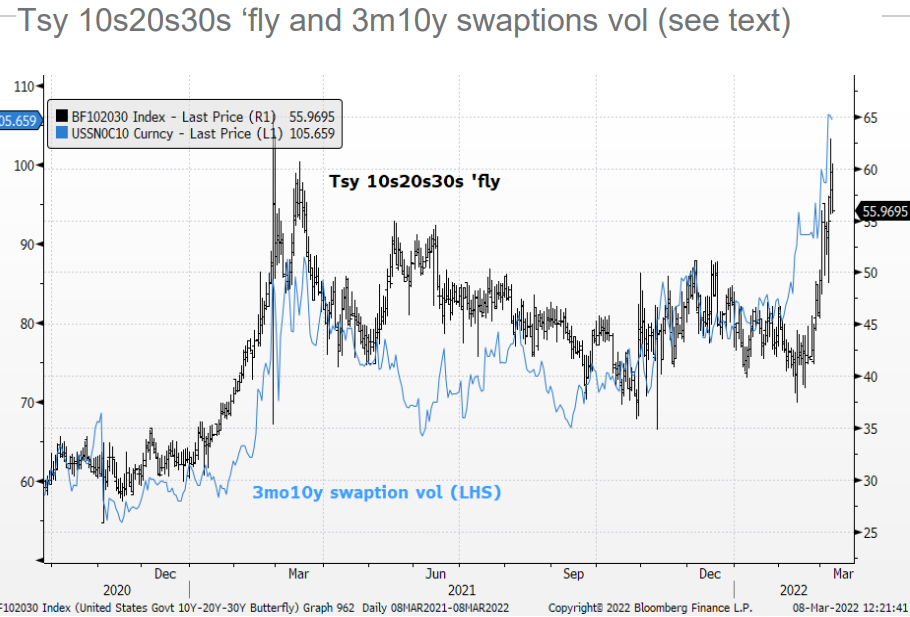
… We then chatted with a colleague yesterday about implied vol levels and curves. So we decided to test the convexity-curve-'fly thesis using 3mo 10y swaption vol, at their suggestion. The hope was that the 'price of convexity' or curvature showed links to the price of vol- with some correlation between vol and 10s20s30s. We show the results in today's first attachment (2-scale alert) which we could not do last fall because the 10s20s30s time series was as short as the 20yrs were new as a current issue. There does seem to be something to this idea; perhaps helping to explain why 10s20s30s has gone mostly straight up (cheaper 20yrs) even though Treasury has pretty aggressively cut 20y issuance relative to 10s and 30s since last fall. Bottom line: buying 20's on 'fly may, at least in part, be a soft/indirect way of betting against vol? Food for thought anyway...
… and for some MORE of the news you can use » IGMs Press Picks for today (09 March) to help weed thru the noise (some of which can be found over here at Finviz).
Got 10s? 20s? Envy the Treasury as known SELLER into this weeks current weakness? Or how about the Fed or worse, the ECB?