(nearly UNCH, steeper on modest volumes...) while WE slept; spottin' THE turn in macro; 20% decline in house prices POSSIBLE (FRBDallas); UST liquidity (as viewed by those on Liberty Street)
Good morning … Today the Dept of Treasury is throwing a LIQUIDITY EVENT (aka, 20yr Treasury auction) and any increase in liquidity (if only for a few hours of a trading session) will be greeted by those on Liberty Street as a welcome reprieve. Here’s where 20s stand,
On the approach OF 50dMA with ReSale TALES up first to HELP make ones decision (or lead to some sort of concession) … ZH,
… HEREis what another shop says be behind the price action overnight…
… WHILE YOU SLEPT Treasuries are close to UNCH, curve modestly steeper beyond the 5y point. USTs are underperforming EGBs and Gilts (despite another 40-yr high in UK inflation), as Asia/EU risk benchmarks mean-revert lower after recent cyclical component-led short-squeezes. The AP reported that the missile that hit Polish ground on the border of Ukraine post the European close on Tuesday could have been fired by Ukraine, with limited reaction. Volumes are OK, USTs seeing 0.95-1.2x 30d volumes across the curve. Hawkish comments from the soon-to-be retiring Fed’s George was highlighted by the WSJ’s Timiraos in early-trade, some pressure on the front-end seen in the follow-through (small flatteners seen on SFR strip as well). US Equity futures have pared some overnight losses to trade flat while oil prices continue to slide (-0.3%) after a modest spike higher overnight.
… and for some MORE of the news you can use » IGMs Press Picks for today (16 NOV) to help weed thru the noise (some of which can be found over here at Finviz).
In as far as a few items of interest from the Global Wall St inbox, I thought this one from a large French bank on stocks to be interesting,
Equities: 100 years of crashes – Navigating capitulation
A recessionary bear market: If we are past the peak in inflation, the pressure from rate-driven P/E multiple compression may slow. However, it could be a case of out of the frying pan, into the fire. In order to tame inflation, the Fed has tightened policy aggressively. Our US Economics team now anticipate this tipping the US into recession next year. In 100 years of Crashes: Covid-19 crisis playbook, 17 April 2020, we highlighted that dynamics in recessionary bear markets tend to be distinct from those without a recession.
Reaching a capitulation point: Recessionary bear markets historically have often ended with a capitulation. We are calling for a capitulation event in equities next year. This would be a departure from the current bear market regime, which has been characterized by a grind lower in equities as P/E multiples have contracted. Implied volatility YTD has underperformed and skew has aggressively flattened.
We highlight our view on how that will change if we see an equity market capitulation early next year. We also examine the impact that a shift in volatility dynamics could have on products such as VKOs (put with volatility knockout) ) and the impact of structured products. The two most recent equity bear markets accompanied by US recessions saw the VIX peak above 80. We argue that those two instances are poor representations of how equity markets typically behave in a recession, and instead lay out what we view as a more typical path. Also despite geopolitical risks in Europe, an European crisis could likely be different from previous Euro centric crisis.
… The US offers supply and demand data. Industrial production for October is expected to continue to expand, albeit more slowly. The issue is whether we are now entering a period of excess supply for goods.
US demand is represented by retail sales. Weak pay bargaining means workers are unable to maintain real spending power. Consumption rests on the willingness to leverage household balance sheets with credit and savings. Lower income consumers are experiencing difficulties. Middle income consumers have more savings to access, and their inflation rate is notably lower than the headline consumer price figure—albeit still producing negative real income.
The simple lesson from historical equity corrections is that the driver of the correction matters when it comes to looking for an indicator of the trough in equities. When monetary policy concerns are the cause, a peak in longer-dated yields has always come shortly before the equity trough. In contrast, when the correction is instead associated with concerns around deeper financial imbalances, it is the trough in growth that has been a better indicator of the turning point.
The relationship between the inflection point in yields and the inflection point in economic activity also depends on the type of episode. The equity trough generally occurs relatively closely to the activity trough across all types of equity troughs. But the yield peak is a better indicator that activity, not just the equity market, will turn relatively shortly in monetary policy episodes than in others, while it does not provide a very good indication that activity will soon improve in the deleveraging episodes of the early 2000s.
We suspect that what really matters most for the turning point in macro assets is the turning point in activity. In monetary-policy-driven cycles, the yield peak is sufficient for the market to anticipate an economic trough ahead as investors perceive that the policy easing itself will induce a pickup in economic activity as it knows the cause of the slowdown. But in cycles driven by other problems, the only firm clue that the episode is ending is that activity itself starts to turn.
We think there are useful lessons from the equity experience for the Dollar. Ultimately, it seems to be the trough in activity that matters for assets, and in cycles like this one, the peak in yields is a clue that the activity trough is imminent. While history suggests that Dollar peaks have generally been associated with a bottoming in economic growth alongside a Fed that has already been easing for some time, there are very few monetary-policy-driven episodes in the Dollar’s historical record. Given the lesson from equities that yield peaks have historically been a good indicator of the activity trough in the current environment, we think that there is a better chance than history suggests that the Dollar peak could occur before a bottoming in growth and coincide more closely with a peak in yields this time around.
The yield peak comes shortly before the equity trough in monetary-policy-driven corrections, while the activity trough matters more in deleveraging-driven corrections
Goldilocks putting FEARS of mass tech layoffs to rest,
… An increase in layoffs in both tech and other industries is probably inevitable as the labor market rebalances—after all, the monthly gross layoff rate is currently only 0.9% of total employment (1.4mn workers per month), a notable decline from an already low pre-pandemic level of 1.2% (1.8mn per month)—but we continue to expect that many laid-off workers will be able to find new jobs relatively quickly, and that the required reduction in aggregate labor demand will come primarily from fewer job openings rather than higher unemployment.
Feel better? I do (my kid is in that industry so I’m HOPEFUL they are right!)
Now in as far as 2023 outlooks go, they are continuing to drip into Global Wall Street inboxes across the land. HERE is one from a large French bank
Driving in restrictive lane: We expect a downturn in global GDP growth in 2023, led by recessions in both the US and the eurozone, with below-trend growth in China and many emerging markets.
Despite a likely steep fall in inflation next year, stubborn price pressures look set to keep the US Federal Reserve and the European Central Bank hiking into a recession in Q1 2023.
U-turn in bonds: We see Q1 2023 as a turning point for US and eurozone government bond markets due to peaks in both central-bank policy rates and net supply net of QE/QT.
For EM rates, idiosyncratic factors are likely to become increasingly important, especially following the peak in global rates.
USD staying in drive, then braking: Risk-off market moves should provide safe-haven support to the USD during H1 2023, but we see it ending 2023 at weaker levels than at present.
In general, duration-sensitive currencies are likely to outperform equity-sensitive ones…
From global OUTLOOKS to money manager SURVEYS … here is THE one most always rely on,
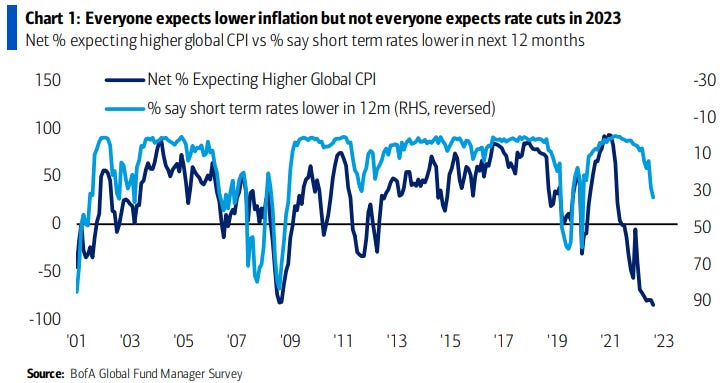
BAML Global Fund Manager Survey: Stagflation, It’s So Hot Right Now
FMS bottom line: sentiment still uber-bearish…FMS cash levels @ 6.2%, BofA Bull & Bear Indicator @ 0, net 77% say global recession, allocation to tech lowest since ’06, all manna from heaven for Q4 trading bulls; we say “rent the pivot”, fade SPX 41k.
FMS on Macro: 92% predict "stagflation" in ’23 vs 0% for (bullish) "goldilocks," and just 1% see (bearish) "debt deflation" as tail risk next year; we say probability of latter high on credit events/unemployment but if inflation rates tumble lower in coming months (Chart 1), bulls can wrestle back some control from the bears…
And finally, a couple notes / thoughts / papers from ‘OFFICIAL’ sources.
Liberty Street Econ dept (ie FRBNY) asks, answers
How Liquid Has the Treasury Market Been in 2022? Liquidity is crucial to the many important uses of Treasury securities in financial markets and its availability in the U.S. Treasury securities market has been a concern for policymakers and market participants lately. The authors assess the recent evolution of Treasury market liquidity and its relationship with price volatility. They find that although the market has been less liquid in 2022, it has not been unusually illiquid, after accounting for the high level of volatility.
… Trading Volume Has Been High …
… Nothing to Be Concerned About? Not exactly. While Treasury market liquidity has been in line with volatility, there are still reasons to be cautious. The market’s capacity to smoothly handle large flows has been of ongoing concern since March 2020, as discussed in this paper, as Treasury debt outstanding continues to grow. Moreover, lower-than-usual liquidity implies that a liquidity shock will have larger-than-usual effects on prices and perhaps be more likely to precipitate a negative feedback loop between security sales, volatility, and illiquidity. Close monitoring of Treasury market liquidity—and continued efforts to improve the market’s resilience—remain important.
Then there’s THIS ONE FROM DALLAS on house prices taking a 20% hit
Skimming U.S. Housing Froth a Delicate, Daunting Task
… Housing wealth increased by nearly $9 trillion between first quarter 2020 and second quarter 2022, more than 82 percent through price gains rather than from an increase in the stock of housing (Chart 4).
Plausible estimates of the direct impact on housing wealth suggest that a pessimistic scenario—with a real price correction of 15–20 percent—could shave as much as 0.5–0.7 percentage points from real personal consumption expenditures. Such a negative wealth effect on aggregate demand would further restrain housing demand, deepening the price correction and setting in motion a negative feedback loop.
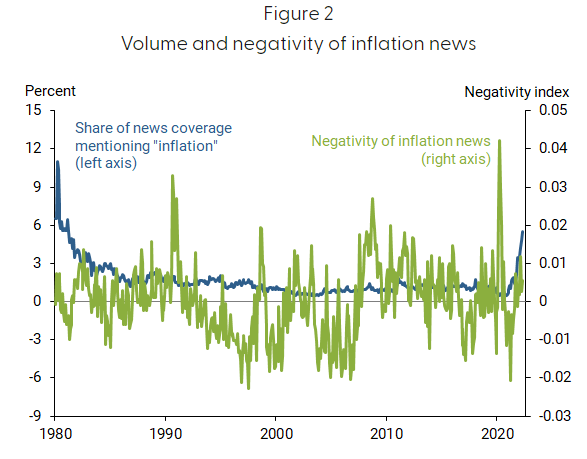
FRBSF Economic Letter: Can the News Drive Inflation Expectations? How households expect inflation to evolve plays an important role in explaining overall inflation dynamics. Household expectations rose dramatically over the past year or so, much faster than professional forecasters’ inflation expectations. News coverage can explain part of this growing gap. Analyzing the volume and sentiment of daily news articles on inflation suggests that one-fourth of the increased gap between household and professional expectations can be attributed to heightened negative media coverage. These results highlight the important impact of the content and tone of economic information on the real economy.
… Figure 2 plots both the volume of inflation news coverage (blue line) and the inflation news negativity (green line) from 1980 to present. Both the volume and negativity are currently elevated. The volume of coverage is at levels not seen since the early 1980s, while negativity has risen substantially over the past year. As Figure 2 shows, it is rare for both of these factors to be elevated at the same time. This suggests a kind of perfect storm of high volume and unfavorable inflation news coverage.
… Conclusion Because household inflation expectations play an important role in explaining overall inflation dynamics, their dramatic climb over the past year or so has become a cause for concern. Our analysis shows that a significant portion of the run-up in household inflation expectations relative to professional forecasts is attributable to heightened negative news coverage of inflation. This suggests that continued extensive and negative news coverage of inflation could pose a risk for household inflation expectations becoming entrenched and contributing to higher inflation itself. More generally, these results demonstrate the importance of the content and tone of economic information in impacting the economy.
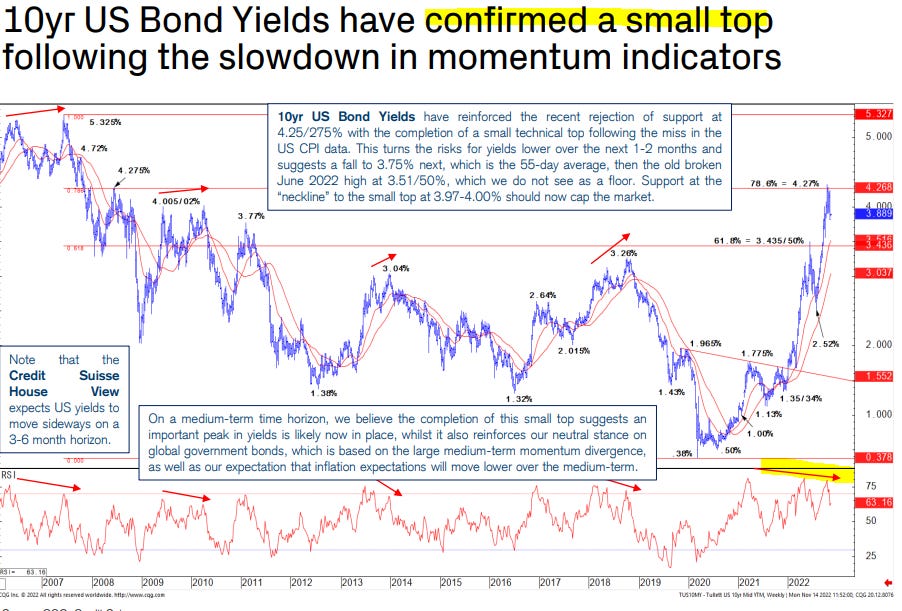
AND from the CHARTS department (of 1stBOS) and their weekly Multi Asset Macro Pack, specifically on RATES,
10yr US Bond Yields also fell sharply following the miss in CPI last week, completing a small top below 3.90% to turn our bias lower over the next 1-2 months, with a test of 3.515/50% still expected.
5yr US Bonds are expected to outperform as yields move lower, flattening the US 2s5s Bond Curve, with the US 5yr Bond Yield also set to test 3.50/48% in our view.


Love this as part of my morning routine. Thanks Steve.