A relatively quiet overnight has yields down a touch as equity futures are UP a touch ahead of earnings.
… here is a snapshot OF USTs as of 705a:
… HEREis what another shop says be behind the price action overnight…
… WHILE YOU SLEPT Treasuries are higher and sharply underperforming the sharply outperforming UK Gilt market (UK-US 10yr rate switch -28.5bp) as new UK Chancellor Hunt announced today that much of his predecessor's mini-budget plans will be scrapped (see link above). DXY is lower (-0.35%; GBP +1.07%) while front WTI futures are little-changed to start the week. Asian stocks were mixed, EU and UK share markets are all in the green (SX5E +0.7%, FTSE 100 +0.6%) while ES futures are showing +1.25% here at 7am. Our overnight US rates flows saw an uneventful Asian session with 'good' long-end buying noted despite the back-end curve steepening overnight. Treasury volumes were very weak (~60% of ave) during Asian hours and with our volume sheet on the fritz and no update from London yet... we'll leave it here and wait for the Empire State survey.
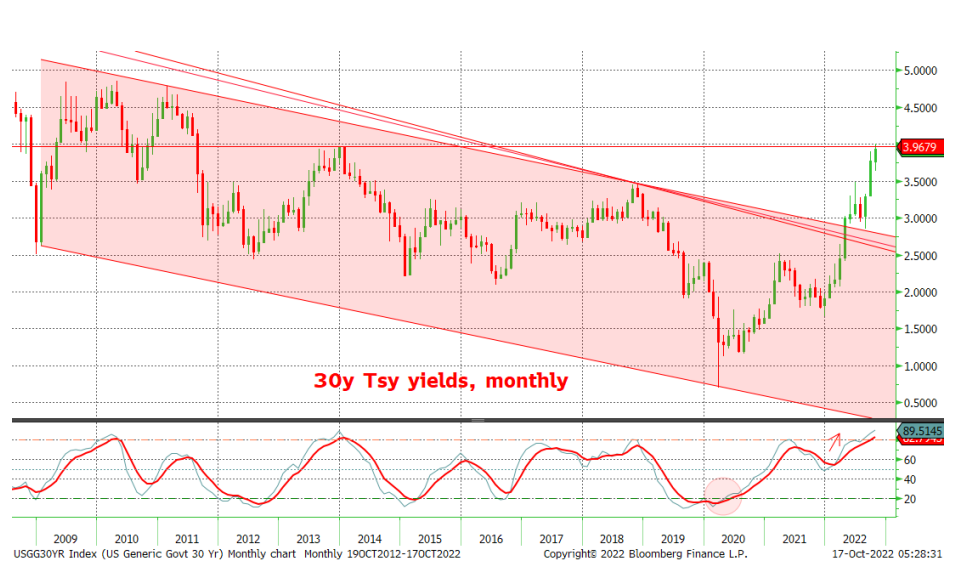
… Treasury 30yrs yields, monthly: The Taper Tantrum move highs near 3.97% still holding as a loose support for bonds. Interestingly, monthly momentum (lower panel) still guides pretty clearly bearish 30's- more so than the shorter benchmarks mentioned before. So that's a small hint of some steepening risks up ahead- under the right conditions or course.
… and for some MORE of the news you can use » IGMs Press Picks for today (17 Oct) to help weed thru the noise (some of which can be found over here at Finviz).
… Worries about liquidity in the U.S. government bond market were also underlined late last week as Treasury asked primary dealers whether it should buy back some of its bonds to improve pricing and activity in the $24 trillion market. There were also reports of further disturbance in UK fixed income markets following the recent 'gilt' shock…
This was mentioned this past weekend and while I did not have time to offer much from the ‘Global Wall St inbox’ — I did highlight the survey (as link to the source).
SIDEBAR and scheduling note — I am traveling the end of this coming week. That said, we DID learn what was (still) on Dr. Lacy Hunt / HIMCOs mind (“Volckernomics”) where he cited EPB Macro’s Eric Basmajian,
… Based upon the calculation by the inciteful young economic analyst Eric Basmajian, of EPB Macro Research, by the end of first quarter of next year the three-year rate of growth in Other Deposit Liabilities (ODL) of the banks, a superior alternative to M2, will be consistent with a longer-term trend rate of 2% inflation. Achieving the actual target will be later since inflation is a lagging indicator. This estimation allows for the fact that ODL velocity fell sharply in both 2020 and 2021 and remained depressed in the first two quarters of this year (Chart 1).
In 2020, 2021 and the first half of this year ODL velocity averaged 1.6, versus 2.5 since 1952. Also, Basmajian, assumes that the 1.6% annual rate of decline in ODL that occurred in the first eight months of this year will deepen due to a decrease in the Fed’s portfolio of government and agency securities that is now running off at $96 billion per month and a decline in total reserves due to increases in the policy rate, of which the central tendency median of the FOMC indicates that there will be three between now and next February…
Using it as a springboard on to just a couple other items recently dumped into the inbox which may help as you attempt to distract yourself from Q3 statements (if they’ve arrived in your mailbox).
First, from econ dept of MS and Seth Carpenter,
The Weekly Worldview: Everyone is talking inflation Last week’s CPI print renewed focus on the path for inflation. In the US, we might be at or near the peak. In Europe it is a ways off. We see disinflation coming, but it is too soon to be confident.
… For the US, last week’s CPI showed the persistence of core services inflation. We discussed the disinflationary path for core goods in a recent note. Inventory correction is well under way, and measures of supply chain disruptions continue to recover. And as an example, apparel prices fell notably in last week’s print. Negative real disposable income growth and continued rising interest rates will continue to restrain demand for goods.
The upside surprise to services inflation last week, however, is critical. Those components reflect domestic aggregate demand, and the only way those inflationary pressures will ease is through a notable further slowing in the economy. Shelter inflation remains a clear upside risk in the near term. Typically, shelter inflation is driven by labor market strength, vacancy rates, and affordability to buy a home (the combination of home prices and mortgage rates). Vacancy rates are starting to creep up. Market-based measures of spot rents are levelling off. But we think we will need a much slower job market to bring rent inflation down on a sustained basis, and even so, there will be a lag. So, the jobs report will continue to be a key indicator, both for the health of the economy and for inflation. The September print of 263k continued the downward trend. The stage is set for US inflation to come down from here…
From economics TO stocks (and from the same firm)
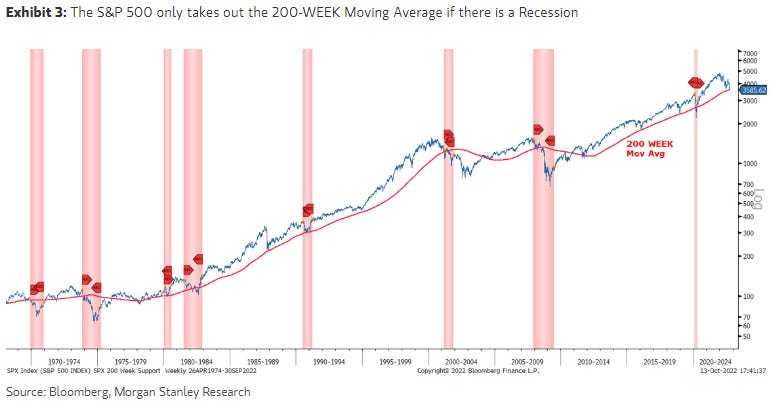
Technicals May Gain Upper Hand on Fundamentals if Rates Come In Last week's infatuation with CPI/PPI may be a trap for the inflation bulls. The 200-WEEK moving average is a serious floor of support until companies fully confess or a recession officially arrives, both of which could take several more months and lead to a technical rally in the short term.
… So how far can this rally run? We think 4000 is as good a guess as any and would not rule out another attempt to re-take the 200-day moving average (~4150). While that seems like an awfully big move, it would be in line with prior bear market rallies this year and prior ones. The other factor we have to respect is the technicals. As noted two weeks ago, the 200-week moving average is a formidable level for the S&P 500 that is hard to take out without a fight. In fact, it usually takes a full blown recession, which we don't have yet (i.e., a 1-2% rise in the unemployment rate). Second, not all recessions result in a break of the 200-week moving average so there is also a case to be made we won't take it out even if a recession arrives. Obviously, Friday's breach on a closing basis is notable; but given the very positive divergences in many momentum indicators (RSI, MACD) combined with the extremely bearish sentiment, this is exactly where the equity market should make a stand if one is going to happen. We did not try to trade the lows in June mainly because we hadn't yet reached the 200-week moving average; but now we have, and in the absence of hard data to confirm the recession has arrived – i.e. negative payrolls – we think this is a good spot to cover some shorts and let this bear breathe. Finally, if this market cannot hold the 200-WEEK moving average, then it's likely there will be no meaningful countertrend move. Instead, we can make straight shot to 3400 or lower. A break below last Thursday's lows would seal the deal in that regard, in our view.