(modest o/n bid on avg volumes)while WE slept; "Debt Ceiling tension likely to rise significantly"; CREDIT? pivot or platform?
Good morning … On heels of yesterdays bad 3yr auction …
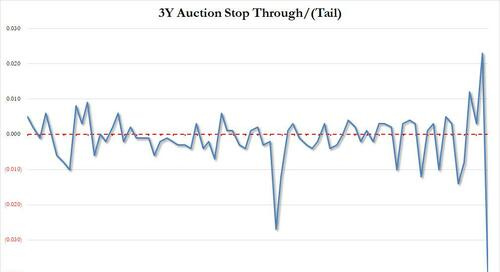
Horrific 3Y Auction Sours Post-Powell Bond Rally
… The high yield of 4.073% was not only well above last month's 3.977%, but also stopped through the When Issued 4.033% by a 4bps which was a record in our data set which goes back to 2016. More remarkably, it was the polar opposite of last month when the 3Y was also a record, only in the other, stop through direction!
The bid to cover was also a huge swing from last month's 2.839, the highest since 2018, to just 2.333, the lowest since Dec 2020!…
In light of that — arguably impacted BY JPOW confusion — this afternoons 10yr auction does come with its very own set of challenges …
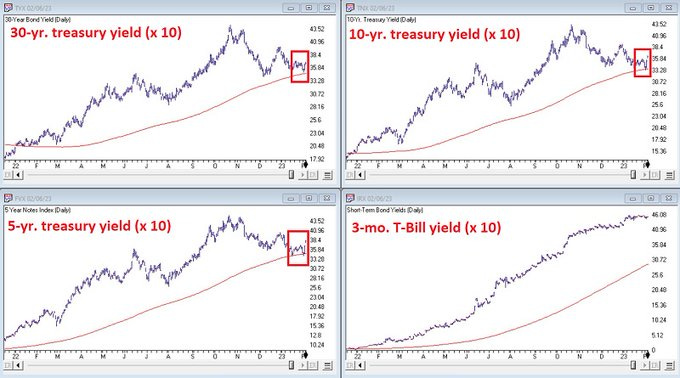
…or opportunities. I’ll let YOU read the inkblot test above — TLINE and momentum are supportive OR is the levee about to break? A WEEKLY look may suggest just that:
AND … here is a snapshot OF USTs as of 705a:
… HERE is what another shop says be behind the price action overnight…
… WHILE YOU SLEPT
Treasuries are modestly higher and the curve little changed this morning as continued Asian buying met a light news tape overnight. DXY is lower (-0.25%) while front WTI futures are higher (+1%). Asian stocks were mixed, EU and UK share markets are all higher (SX5E +0.5%, FTSE 100 +0.8%) while ES futures are showing -0.3% here at 6:30am. Our overnight US rates flows saw Asian real$ buying from the front end out to 10's alongside a few block buys in TY (+1500) and TU (+4500) futures too. Overnight Treasury volume was ~ average overnight.
… and for some MORE of the news you can use » IGMs Press Picks for today (8 FEB— and STILL SPORTING THAT NEW LOOK!!) to help weed thru the noise (some of which can be found over here at Finviz).
From some of the news to some VIEWS you might be able to use. Global Wall St SAYS:
A large German operation and fan fav straTegerist morning note review of JPOW,
… To review his comments, Powell continued to repeat last week's FOMC mantra that further rate hikes were needed in order to rein in inflation and that policy would have to stay tight for some time. While directly addressing last week’s report he said it “shows you why we think this will be a process that takes a significant period of time ... the labour market is extraordinarily strong". He then spent a good deal of time referencing back to his comments from the FOMC press conference. These opening remarks caused the market to initially turn risk on with the S&P up 1.2% and 2yr yields moving -9bps lower after the first 30 minutes of the interview. However, Powell then pointed out that if the labour market remains strong “it may well be the case that we have to do more.” This seemed to signal to markets that a further 50bps of hikes is the floor for fed funds with risks to the upside on labour or inflation data coming out higher than expected. This caused a quick reversal with the S&P 500 dropping nearly -2% and 2yr yields climbing +8bps in the span of a half hour.
However, once Powell had wrapped up, both moves were retraced throughout the rest of the US afternoon with the S&P finishing near the highs of the day, and higher than during the peak of Powell’s interview, at +1.29%. Meanwhile the policy-sensitive 2yr yield sold off with yields finishing flat at 4.46% and 10yr yields +3.4bps higher at 3.67% (although -2.2bps lower this morning in Asia). Even with Powell raising the spectre of a higher terminal rate than the Fed had previously signalled, fed future pricing actually dropped ever so slightly with the July meeting closing at an implied fed funds rate of 5.153%, down 0.05bps. We've actually dipped -2.5bps this morning…
Goldilocks on last nights SOTU,
Few Surprises in the State of the Union Speech
BOTTOM LINE: President Biden’s State of the Union speech Tuesday evening pushed back on the debt limit debate, taking cuts to Social Security and Medicare even further off the table; emphasized “Buy American” policies, including further domestic content requirements for IRA projects; and highlighted the healthcare, consumer, and tax policy items we expected. The US-China relationship, immigration, and domestic oil production investment got less emphasis than we might have expected, especially given the political salience of gas prices over the past year. There were no significant policy announcements that weren’t already previewed in Monday's White House fact sheet, and no major changes to our policy outlook for the Administration this year.
From the SOTU to a topic which was touched and not truly addressed last night, 1stBOS offers,
Debt Ceiling tension likely to rise significantly
Tension and brinkmanship over raising the US government’s debt ceiling are likely to rise significantly despite early soundbites from House Speaker McCarthy and Senate Minority Leader McConnell that have been constructive.
The Freedom Caucus wing of the Republican Party in the House of Representatives seems likely to demand spending cuts that Democrat leadership and even some Republicans in the Congress will find difficult to agree to.
Freedom Caucus power within the House is disproportionate to the group’s small numbers. Additionally, some in Congress seem to doubt the credibility of the Treasury’s warnings of debt default because of past Treasury plans to prioritize debt servicing and debt maturities in the event of a breach of the debt ceiling.
A resolution is unlikely any time soon. Substantive negotiations and ultimate compromise are likely to occur mainly in the days and hours approaching the last day that the Treasury can fund its payments, the so called “X-date.”
Treasury has not given an X-date yet, but estimates range from as early as late June to potentially as late as early October.
Markets have begun pricing default risk in CDS spreads and the yields of some T-bills that mature around estimated X-dates. We expect Congress to ultimately raise the debt ceiling.
However, we see risk that greater upward pressure on Treasury security yields will emerge as tension increases ahead of the X-date.
… Markets have begun to price default risk but may need to price more. Credit default swap spreads on the US have risen sharply in the 1y tenor but are still below 2011 highs for 5y protection (Figure 1).
Ruh Roh RelRoy … where are those directions of how to play debt ceiling chicken, again?
A rather large French operation offering some updated thoughts post NFP & JPOW …
No major changes in Fed narrative post NFP, but upside risks to terminal rate emerging
KEY MESSAGES
Fed Chair Powell chose his words carefully during a 1:1 interview at the Economic Club of Washington today. We view this as a sign that the Fed will take time to digest January’s strong jobs report – and other data – before deciding whether to deviate from the rate path laid out in December.
Market pricing had already moved into better alignment with the Fed’s December dot plot, in advance of the interview. This mitigated the need for Powell to float more hawkish scenarios like putting a 50bp hike back on the table, or tipping a higher path for the funds rate.
We think it is important that Powell flagged the employment data as supportive of the Fed’s view that inflation may not come down as quickly as markets think, in 2023. That would require restrictive policy for longer, leaning against cuts in the back half of the year.
We continue to think the Fed will raise to 5.25% after two more 25bp hikes, then remain on hold for the remainder of the year. Risks tilt in the direction of a modestly higher terminal rate (5.50%). Read our reaction to the FOMC here and payrolls here.
Looking at where we may / may not be in the cycle,
Our Cycle Indicator Moves to 'Downturn'
Our US cycle indicator has flipped from 'expansion' to 'downturn'. Historically, this phase has supported a defensive posture.Our market cycle model flips to 'downturn': With US data still above average but deteriorating, our cycle indicator has shifted from 'expansion' to 'downturn' at the end of January, for the first time since February 2019, making this one of the fastest market cycle turns by our indicator.
'Downturn' means defense: This phase change in our US market cycle indicator has historically meant a worse backdrop for risk asset returns, changes in sector leadership, and a good environment for fixed income. Our cross-asset preferences in the US remain defensively skewed.
A strategic, not tactical, signal: Lower returns for equities and credit in 'downturn' have historically only materialised several months after 'downturn' begins, unlike our Market Sentiment Indicator (MSI), which reflects risk-on/risk-off environments on a tactical horizon. Our MSI is still 'neutral', but modest market weakness from here will likely shift the signal 'negative'…
Same shop moves from the cycle TO the seasonals (of NFP),
Sifting Through The Seasonals
The pop in January payrolls is unlikely to persist into February. We quantify three temporary factors that boosted January payrolls: weather, strikes, and seasonal factors. Our preliminary forecast for February payrolls is a net gain of 200k, but more slowing is needed. Fed hikes peak in May.
Friday's employment report was a major upside surprise to expectations, but we do not think it marks an inflection point for the labor market. The January number reflects large-scale boosts from three factors that are temporary: 1) weather, 2) strikes, 3) seasonal factors.
Favorable weather added ~126k jobs in January, which should roll off over next three months. We expect a ~38k drag on nonfarm payrolls in February, 50k drag in February, and 38k drag in March.
The resolution of strikes added 35,000 state education jobs in January - a one-off lift to public employment.
Revised seasonal factors provided a very soft benchmark, turning a 2.5mn drop in not seasonally adjusted (NSA) payrolls into a headline net gain of 517k. Looking at the NSA number clarifies that January's gains are less about firms actively hiring more workers and more about not firing them - reaffirming a key call we made back in October. Seasonal adjustment turns much less friendly for the upcoming report, but some sectors like retail could still benefit. We provide a sector-by-sector analysis within.
The hurdle rates for NSA jobs show the biggest month-to-month swing is from January to February, but remain relatively favorable until July. Seasonal adjustment is a zero-sum game across the year so the seasonal boost to January raises the bar for strong prints through June.
We forecast growth in nonfarm payrolls returns back to the established July-December downward trend in February. Our preliminary forecast for February payrolls is for net job gains of 200k.
A seasonal boost in both the January jobs report and motor vehicle sales has lifted real PCE growth in 1Q23 to 1.9% from 0.3%, prior. Our 1Q tracking incorporates some reversion in the remaining months of the quarter.
More evidence of labor market slowing is needed for the Fed to consider an end of the tightening cycle. We see the Fed delivering a 25bp hike at both its March and May meetings, bringing the peak policy rate to 5.00% to 5.25%. We continue to see the first 25bp rate cut in December this year, followed by 200bp of additional easing through end-2024 to 2.75% to 3.00%.
… January to February marks the largest swing in seasonality month-to-month.Looking ahead, the hurdle rate is somewhat more favorable in March but generally remains relatively high until July (Exhibit 3). Seasonal effects are a zero-sum game over the year, so it is likely that the boost in January will be paid for by weaker prints through the first half of the year
A rather large British operation asking a very good question,
Is an Allocation to Credit Beneficial in an Inflationary Period?
In 2020, we showed that an allocation to corporate bonds was superior to a risk-matched combination of equities and Treasuries over the previous three decades. We assess the validity of the results in the current inflationary period.
In 2020, we published the report 'Can a Combination of Treasuries and Equities Replace Credit in a Portfolio?,' which documented that corporate bonds achieved better risk-adjusted performance than a combination of Treasuries and equities of the same companies with similar systematic exposures.
The return difference was persistent across time periods, ratings, industries, geographies, and controlling for credit relative illiquidity, irrespective of which risk-matching approach was used. The implication is that corporate bonds delivered a unique return component that doesn't exist in the simple combination of equities and Treasuries.
Additional analysis shows that corporate bonds' unique return component can be attributed to two sources: their embedded optionality allows investors to collect premia for ‘short volatility’ positions in equity and rates markets; and they benefit from the ‘low volatility’ phenomena across the capital structure.
The period following the publication of the study was characterized by unusually high inflation. We examine whether credit continued to outperform a risk-matched combination of equities and Treasuries.
And finally, a couple / few CHARTS
AllStar: Credit is fine. What's the problem?
It starts with credit.
Bottom line.
This isn't crypto where all these shitcoins can go to zero and it won't matter to anyone who matters.
These aren't marijuana stocks that are irrelevant to global asset allocation.
This is the bond market.
This is the biggest and baddest of them all.
We're talking about almost a $120 Trillion asset class.
It's just math: if there is real systemic risk in the equities market, you're going to see it in credit.
There's no way around it.
And so how are credit spreads doing?
As tight as they have been since last summer, and getting tighter:
Why should investors care?
And for MORE on why anyone should care, read the rest of the post and the large British operation noted above … CREDIT may be an interesting place over the coming days/weeks and months …
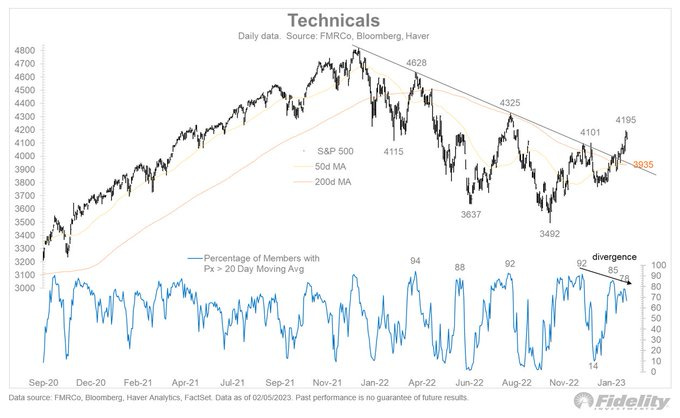
From credit and stocks TO stocks and the following look from Timmer / Fidelity
@TimmerFidelity
How seriously should we regard the recent market surge? At last week’s new recovery high of 4195, we can now see a small bearish divergence in the breadth data (percentage of stocks above their 20-day moving average).
AND from stocks and credit to stocks we’ll now turn TO rates,
@jaykaeppel
These charts seem important IMO. Lot's of talk about falling inflation leading to lower interest rates. Could be. But I prefer to get it straight from the horse’s mouth. So far the horse isn't saying anything I want to hear...
AND from one of (if not THE)best TechAMentalists out there,
Chart Of The Day: Pivot or platform?
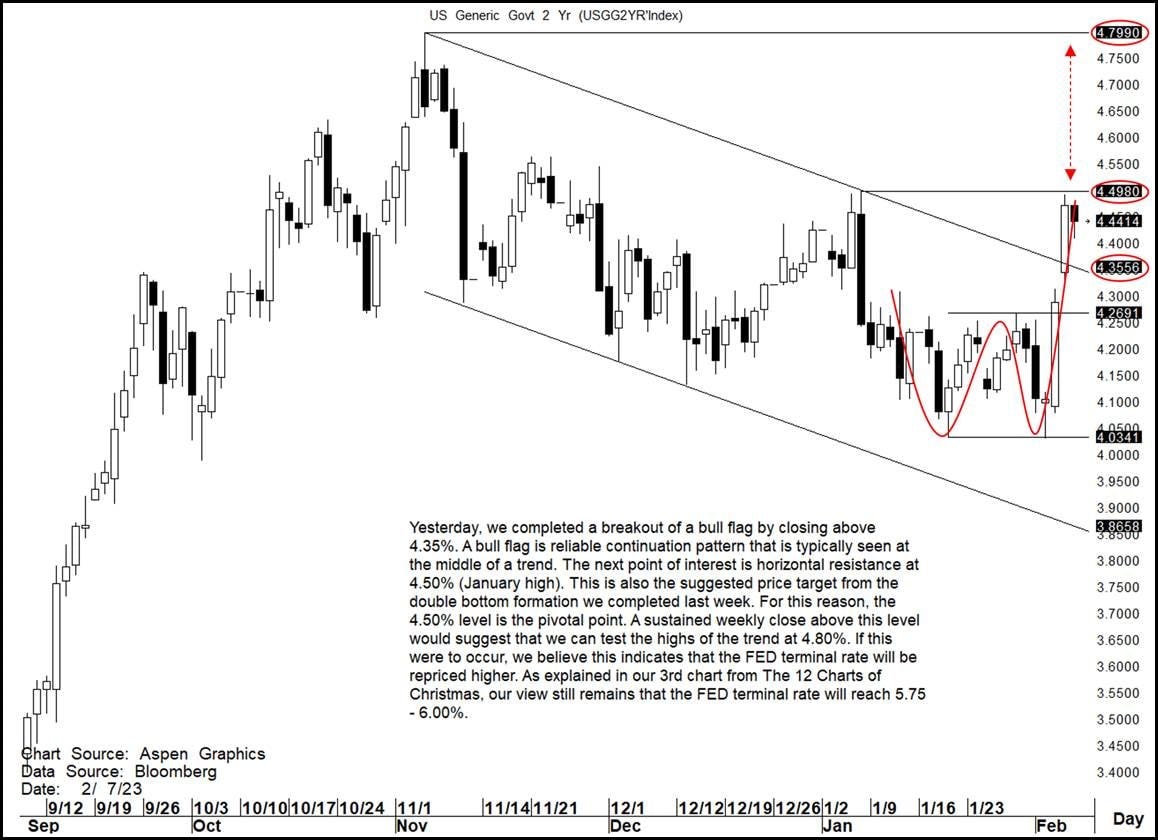
2yr Yields: We are at a point where price action may provide a pivot where we turnover in yields and come down, OR a platform to bring us to the trend highs and potentially higher.
Yesterday, we completed a breakout of a bull flag by closing above 4.35%.
A bull flag is a reliable continuation pattern that is typically seen at the middle of a trend.
The next point of interest is horizontal resistance at 4.50% (January high).
This is also the suggested the price target from the double bottom formation we completed last week.
For this reason, the 4.50% level is the pivot/platform point.
A sustained weekly close above this level would suggest that we can test the highs of the trend at 4.80%.
If this were to occur, we believe this indicates that the FED terminal rate will be repriced higher.
As explained in our 3rd chart from The 12 charts of Christmas- It was the best of times, it was the worst of times, our view still remains that the FED terminal rate will reach 5.75 – 6.00%.... so in our view, PLATFORM.
4.50% is the pivot point
… THAT is all for now. Off to the day job…


