… HEREis what another shop says be behind the price action overnight…
… WHILE YOU SLEPT Treasuries are modestly higher with the belly slightly outperforming as the UK curve leads and bull flattens this morning. DXY is higher (+0.2%) while front WTI futures are lower (-1.3%). Asian stocks saw China-linked markets lower but others mostly higher, EU and UK share markets are mixed while ES futures are showing +0.2% here at 6:30am. Our overnight US rates flows saw a continued sell-off in Treasuries during Asian hours with 10's reaching 4.24% before finding their footing into the London open. Our flows were 2-way in the long-end though market volumes were concentrated in the front end and the belly ahead of today's 3-year auction. Overnight Treasury volume was ~120% of average with relatively high turnover seen in 3's (144%) and 20's (162%).
…At the other end of the curve, 30yr Treasury yields are trending back toward their move highs and still ~25bp above their bear trend in place since early August. So the key levels to watch on Thursday on a topside/downside CPI miss might be 4.40% level above and the 4.05% area (recent 'highs,' bear trending intercept) below.
…As for curvature, the 2s5s10s Treasury 'fly looks biased lower still (richer belly) with long-term/monthly momentum still guiding lower while still some distance/time from 'oversold' readings. So the belly looks in good shape still and a return to the -30bp range support area appears quite possible for the few months ahead.
… and for some MORE of the news you can use » IGMs Press Picks for today (8 NOV) to help weed thru the noise (some of which can be found over here at Finviz).
As far as a few items from the Global Wall St narrative creation machine … things to help you pass the time as we await election results,
… Gridlock has been good for stock market investors in the past few decades, particularly when there’s been a Democratic president and the Republicans in control of at least one house of Congress. For example, under President Clinton, from the market close on election night 1994 – when the Republicans took control of both houses of Congress for the first time in forty years – to the end of the Clinton presidency, the S&P 500 generated a total return of 20.7% per year. Under President Obama, from the close on Mid-Term Election Night 2010 – when the GOP took the House and made gains in the Senate – through the end of his presidency, the S&P 500 generated a total return of 13.3% per year.
But there are some big differences between the current economic situation and those other two episodes …
Ok, right. Elections having consequences. We all get it. Moving on to NOT election related material, and TO recent SLOOS data via Goldilocks
BOTTOM LINE: The Federal Reserve’s October 2022 Senior Loan Officer Opinion Survey—conducted for bank lending activity over the third quarter of this year—reported that standards tightened on net and demand weakened for commercial and industrial loans for firms of all sizes as well as for commercial real estate loans. Standards also tightened for nonfarm nonresidential loans and multifamily properties on net. On the household side, banks reported stronger demand for consumer credit card loans and weaker demand for auto loans, as well as weaker demand for residential real estate loans.
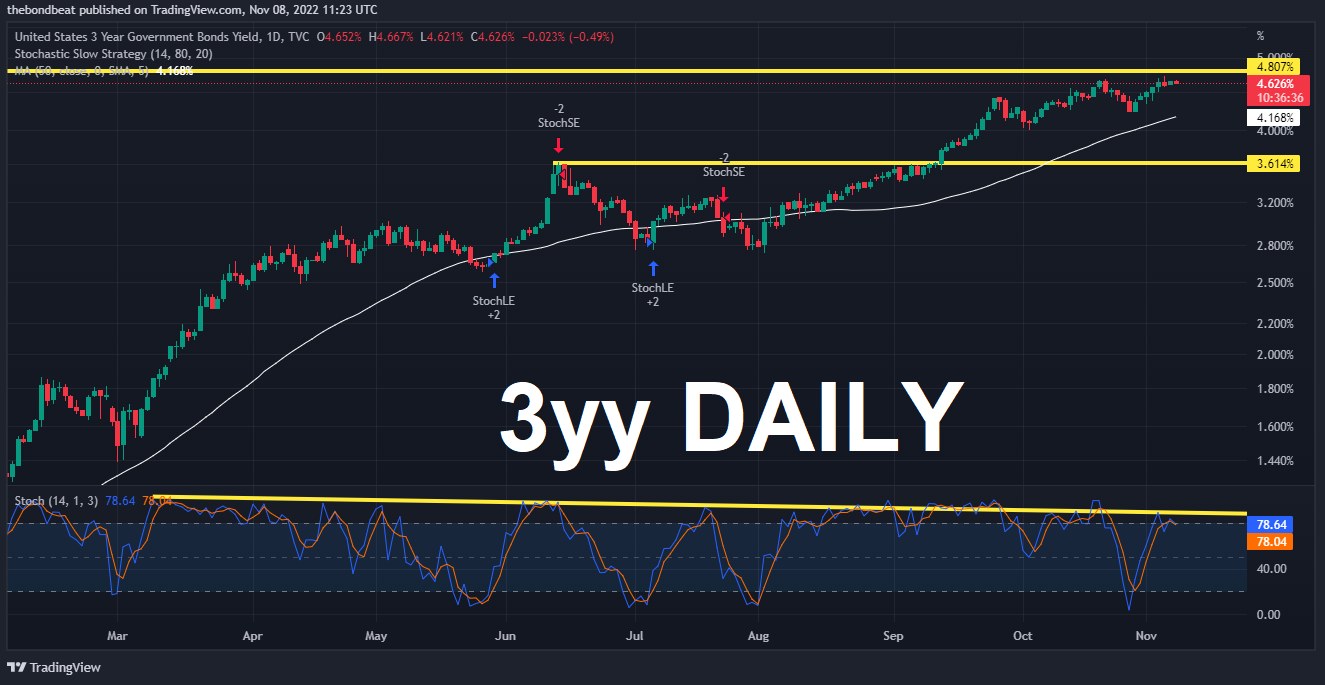
10yr US Bond Yields have edged higher since the FOMC meeting, with this week’s CPI print seen as key for the next short-term move.
… We quickly turned tactically neutral last week following the clear break above minor support at 4.13%.
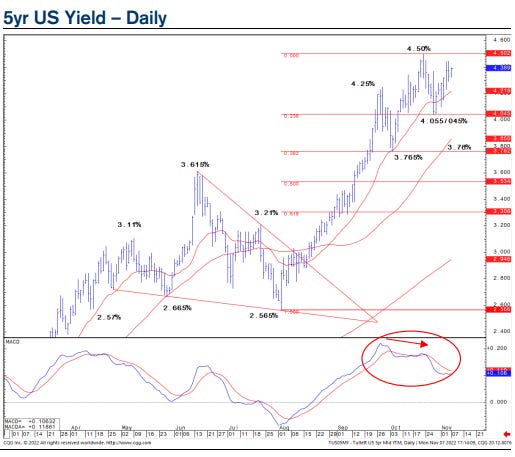
At the same time, organization REMAINS TACTICALLY BULLISH 5yy …
US 5yr Bond Yields have so far failed to follow through on the recent break of resistance and the bullish short-term momentum divergence.
…We stay tactically bullish, with the market struggling to sustain a move above at 4.35%. We look for a move to resistance at 3.76% initially, whilst a break above support 4.50% would quickly neutralise our bullish view.
AND finally, the suggestion REMAINS to stay tactically NEUTRAL 30yy ...
Finally, from a semi - official blog of the FRBSF — comes a letter,
Monetary Policy Stance Is Tighter than Federal Funds Rate The Federal Reserve’s use of forward guidance and balance sheet policy means that monetary policy consists of more than changing the federal funds rate target. A proxy federal funds rate that incorporates data from financial markets can help assess the broader stance of monetary policy. This proxy measure shows that, since late 2021, monetary policy has been substantially tighter than the federal funds rate indicates. Tightening financial conditions are similar to what would be expected if the funds rate had exceeded 5¼% by September 2022
… Figure 1 shows the monthly effective federal funds rate and proxy rate from June 1976 to September 2022. In the period before December 2008, these series align nearly perfectly, meaning that the proxy rate captures almost all the variation in the effective funds rate. However, starting around July 2003, there is a slight shift in the alignment of the two series, as the proxy rate tends to lead the funds rate. This shift corresponds to when the FOMC started regularly using a version of forward guidance to communicate that it was likely to move the funds rate. Forward guidance provided financial markets and the public with information about the FOMC’s monetary policy stance that was not previously available. More generally, the proxy rate captures financial market expectations of future policy and encapsulates all available information provided by the FOMC in both its actions and its communications.
After 2008, the series diverged when the use of additional policy actions drove a wedge between the funds rate and the full stance of monetary policy, as estimated by the proxy rate. Figure 2 focuses on the comparison from 2009 to 2022. The divergence can be seen through the constrained path of the funds rate and the proxy rate’s decline below zero in the early 2010s. Monetary policy accommodation through forward guidance and multiple rounds of asset purchases played a critical role in this movement.
Finally, with elections forthcoming and HOPEFULLY results not too terribly far behind,