(mixed on light volumes due to holiday and soccer) while WE slept; Gruesome 7Y Auction (ZH); '...Peak Hawkishness Has Passed...'; "risk OFF, yield ON" -PIMCO; Fed Funds 12mo ROC; S&P YTD
Good morning … thankfully there’s no more coupon issuance straight ahead because that 7yr auction tailed and by all accounts, was no bueno
JEFF: 2.5bp Tail, Biggest Dealer Takedown Since July, Another Low Bid/ Cover BMO: 7-year auction tails 2.6 bp -- weak non-dealer bid ZH: Gruesome 7Y Auction Sees Biggest Tail Since "That" Feb'21 Sale Which Nuked Bonds … This was the biggest 7Y tail since that infamous Feb 2021 seven year auction which sparked a flash crash across the curve and a mini freak out in the rate market.
… here is a snapshot OF USTs as of 705a:
… HEREis what another shop says be behind the price action overnight…
… WHILE YOU SLEPT Treasuries are mixed with the curve pivoting flatter around a little-changed intermediate sector. New Zealand's 75bp hike (they considered +100bp too) garnered most attention overnight with Japan out on holiday. DXY is modestly lower (-0.13%) while front WTI futures are lower too (-2.25%). Asian stocks were mostly higher, EU and UK share markets are little changed while ES futures are showing +0.1% here at 6:55am. Once again our flow color was limited but there was an apparent 4.15k block sale of ultra10's earlier. Overnight Treasury volume suffered amid the holidays and the World Cup at ~55% of average with 7's (89%) seeing the highest relative average turnover among benchmarks overnight.
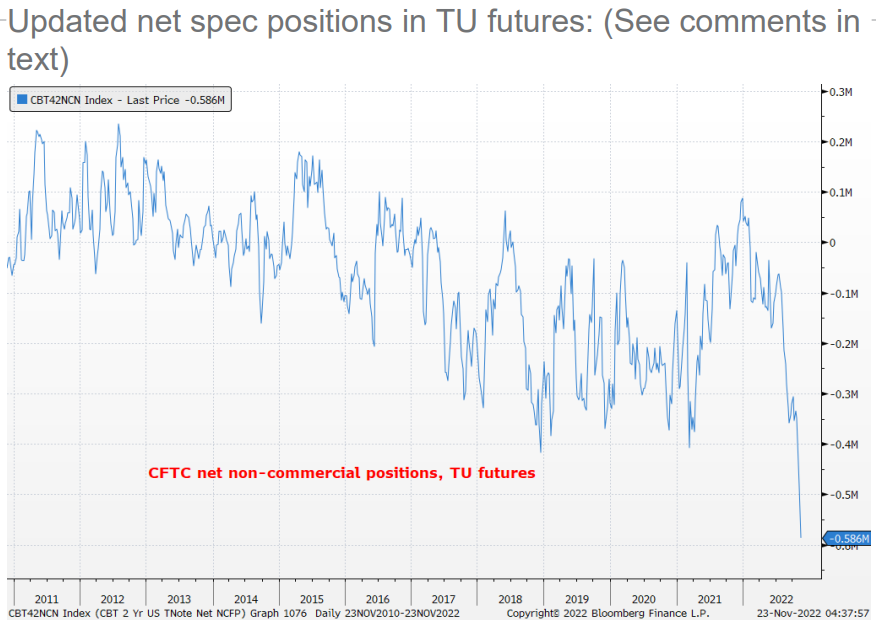
… we show the updated spec positioning in TU futures- the CFTC's net non-commercial positioning series for TU's. Boy do the specs love to hate TU's, and historically so- as you can see. In recent days we've shown the weekly chart of Treasury 2yrs and how 2's appear at 'risk' of a return to their 4.00% resistance (early October low) area
AND we know what happens when everyone is on the same side of the boat … Question IS what IF they are RIGHT and there’s NOT quite the pivot then rate CUTS?
… and for some MORE of the news you can use » IGMs Press Picks for today (23 NOV) to help weed thru the noise (some of which can be found over here at Finviz).
Moving right along in TO and through this holiday shortened week, a few things from the Global Wall Street narrative creation machine as well as random links from the intertubes … First up is yet another (2023)dart thrown, this time by a rather large German bank who notes,
We expect Treasury yields to end 2023 lower at 3.65% and Bunds to underperform Treasuries and end the year higher in yield at 2.60%. While the cyclical peak in US yields is likely behind us, we are waiting for further evidence of weakness in the US labour market to switch to an outright long US duration view. Overall, our conviction on duration is materially lower than it has been during the past few years, when we believed that rates and the Fed had significant catching up to do. In contrast, we expect a notable tightening of the Treasury-Bund spread.
The US will soon be in recession, US core inflation has peaked and there are downside risks to fiscal policy following the midterm elections. However, the Fed will enter the year quite far from its dual-mandate objectives: core inflation is more than 3pp above target and the labour market is still historically tight. In contrast, US core PCE has only briefly exceeded 2.5% over the previous 30 years. As a result, the link between weaker growth and Fed easing is more tenuous than in recent decades. This view is corroborated by a Fed that prefers to err on the side of over vs. under tightening. Thus, even though core inflation and the labour market are lagging indicators, we prefer to wait for clearer evidence of labour market weakness before changing our outright US duration view…
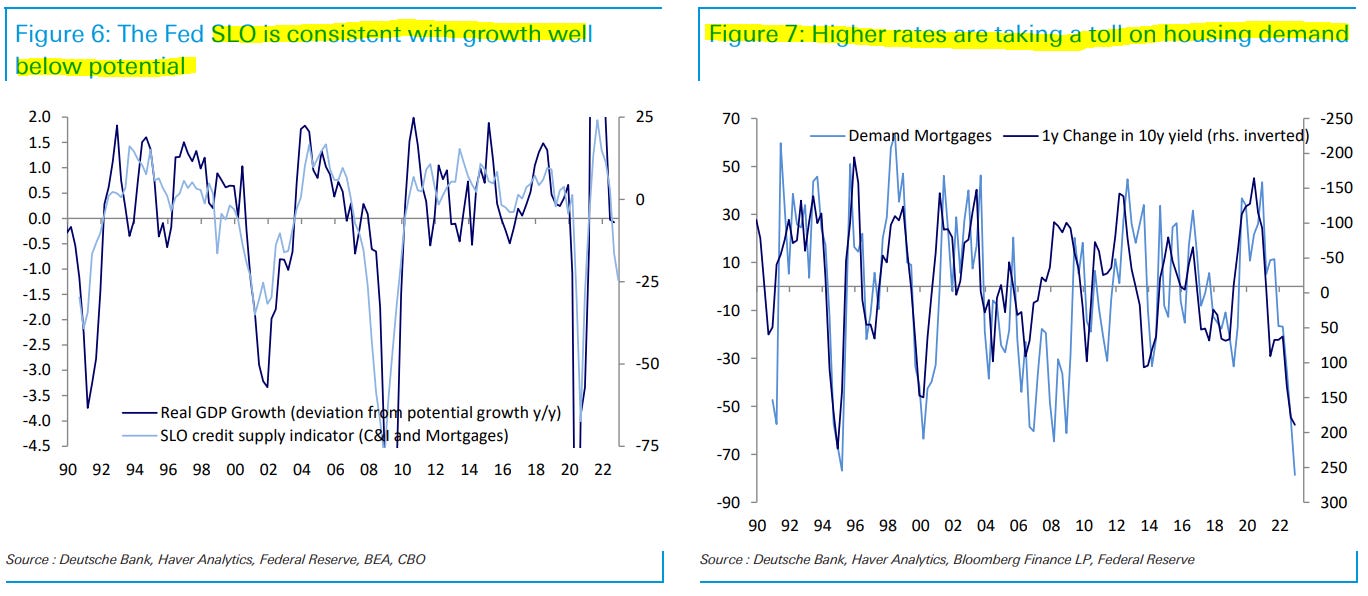
The bank forecasts 2s to END 2023 @ 3.15, 5s @ 3.25, 10s at 3.65 and 30yy @ 3.85. Interestingly note the Senior Loan Officer Survey — RATES MATTER — like this:
The US is likely to enter a recession during the next few quarters, and inflation is peaking. For instance, the Senior Loan Officer Survey is consistent with well below potential growth. The rise in rates is having a significant impact on demand for mortgages and the housing market. Rent y/y inflation is likely to decline during the next few months, and core goods inflation is already on a downward trajectory.
So we’ve got THAT aggressive Fed hiking cycle to TAME the ‘flation going for us … which is nice. Plan your 2023 year ahead trades and TRADE your 2023 year ahead plans accordingly? As far as the HERE AND NOW, the bank in a DAILY NOTE (S&P back to 4200 by year-end) highlighted this chart — of the S&Ps YTD performance …
Chart of the day S&P has risen ~12% from its October trough in its fifth bear rally this year
NEXT UP is one regarding this afternoons FOMC Minutes
The Federal Reserve will be publishing the minutes of the last meeting, which raised rates by 0.75 percentage points in accordance with Fed Chair Powell’s relentless “hike, hike, hike” tactic. There are signs that some members of the FOMC are questioning this Pavlovian policy, with comments hinting at a slowing in the pace of tightening.
US October durable goods orders data comes as the slowdown in consumer durable goods demand is producing rapid price deflation. The Michigan consumer sentiment survey should continue to show a huge gulf between Democrat and Republican views of the economy. This was not the norm until President Trump was elected. Political partisanship, combined with low survey response rates, undermines the quality of survey evidence…
While we will be parsing
BBG (Simon White) via ZH pointing out another instance of nothing happening without a consequence … in this instance higher rates … lead to … A LOT OF THINGS, such as …
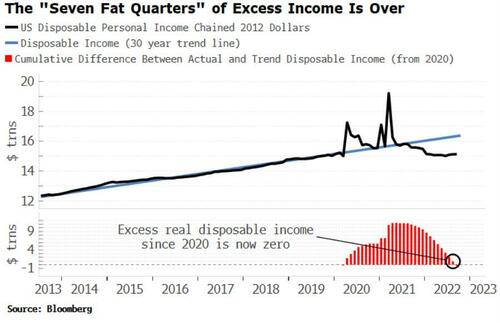
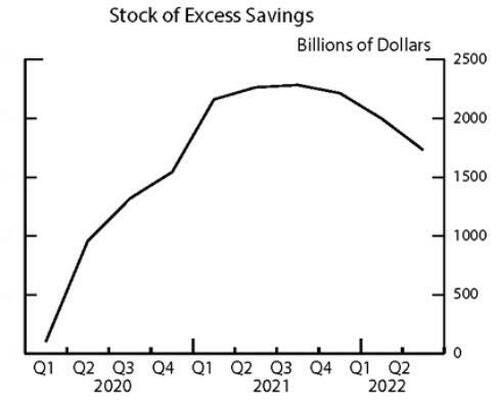
The pandemic rise in excess savings was probably the most rapid increase in wealth ever seen. A combination of a collapse in demand and huge government transfers led to an estimated peak of $2.3 trillion in excess savings being accumulated by the middle of 2021.
But after the feast comes the famine, and excess savings are being run down swiftly as inflation causes prices and interest rates to rise. These excess savings act as a buffer to a recession as they dampen the feedback loop of a decline in spending, leading to a fall in income, which means less spending, and so on.
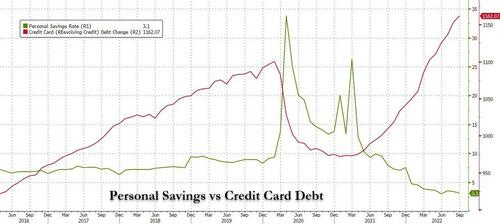
The BEA (Bureau of Economic Analysis) defines the flow of savings = disposable personal income – consumption – other outlays. The personal savings rate is the difference between disposable income and consumption as a percentage of disposable income. The savings rate reached as high as 33% in the depths of a the pandemic – a previously unimaginable level – but since then has collapsed to near all-time lows of 3.1%.
The dissaving can be seen in the rapid decline in “excess disposable income,” i.e. disposable income above its pre-pandemic trend. It is back to flat based on a 30-year trend line, signifying that excess savings are no longer being bolstered by excess income because people are spending more and pandemic-related transfer payments from the government have ceased.
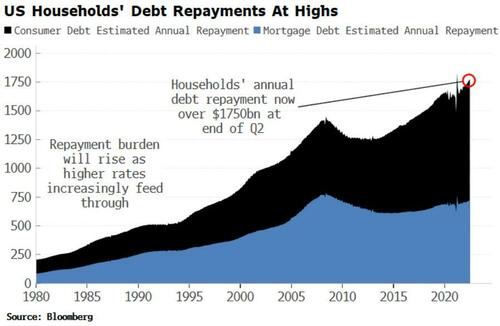
Savings are being increasingly stressed by rising debt repayments. Interest rates are rising on consumer and mortgage debt. Debt-service ratios (debt repayments as a percentage of disposable income) remain relatively low, but are rising, and could do so fairly rapidly as debt is re-fixed at higher rates.
In nominal terms, households have to repay an estimated $1.75 trillion each year, or almost 10% of disposable income. Further, this burden will get worse as more income is eaten up by rising prices.
The Fed estimates that excess savings have dwindled to $1.7 trillion (as of mid-2022), a 26% drop in a year (see chart below). The stock of excess savings is likely to fall with an increasing pace as the lagged effects of rising interest rates bite.
The recession buffer is being wiped out, leaving the US economy in a more fragile position and raising the likelihood the Fed has reached its peak in bellicosity on the war on inflation (for now)…
Sticking to this theme — on higher rates and IMPACTS and also from BBG
…Investors have been extremely attentive for any signs of a Federal Reserve pivot toward slowing and at some stage halting interest-rate hikes. But many of them risk missing the wood for the trees as they keep an eye out for the when and how, rather than accounting for the dangers of the why when it comes to a potential shift.
San Francisco Fed President Mary Daly this week drew plenty of attention to the fact that policy acts with a lag, meaning there’s already plenty of pain coming down the economic pipeline. Consider the rapid shift by US banks toward stricter lending policies and higher credit costs. The Fed’s loan officer survey shows a surge in those metrics toward levels seen before each of the last three recessions. Conditions are yet to get as tight as in those instances, though the spike higher contrasts with the situation when the Fed last raised interest rates in 2016-18. It underscores the tightrope the Fed is trying to walk as it seeks to tame inflation without wrecking the economy.
Here’s a tweet to hopefully offer somewhat MORE CONTEXT
… The past six times the 2Y/10Y part of the yield curve inverted, a recession followed, on average, 18 months later. However, the length of time between the quickest time to recession (6 months) and the longest time until recession (nearly 36 months!) complicates the signal and in the Fed’s words, the relationship is probably spurious. As such, we (and the Fed) tend to put more credence on the 3M/10Y, which has had a better track record in predicting recessions with a lead time of about four to six quarters, but as few as two quarters ahead.
The 3M/10Y signal has predicted essentially every U.S. recession since 1950, with only one “false” signal, which preceded the credit crunch and slowdown in production in 1967. There is also evidence that the predictive relationships exist in other countries, notably Germany, Canada, and the United Kingdom. Further, a signal that lasts only one day may be dismissed, but a signal that persists for a month or more should be looked at carefully. The current 3M/10Y inversion began in earnest in October, so using historical data as a guide and according to this quantitative metric, we’re likely at least two quarters away from recession. Finally, it’s also important to note that yield curve inversion does not provide much evidence in terms of length and/or magnitude of a potential recession. Over time, we’ve seen deep inversions with shallow recessions and shallow inversions with deep recessions. The signal only provides information on if a recession is likely over the next few quarters. We think any economic contraction will likely be a shallow one due to the continued strength of the consumer.
From yield curves TO a few macro / KEY THEMES from the operation formerly (and to be known again) as 1stBOS
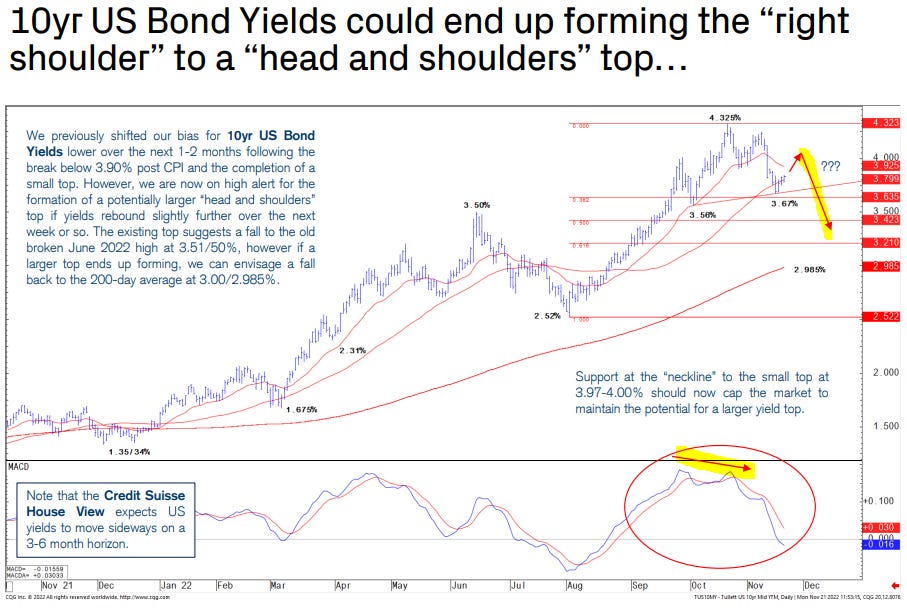
* There is the possibility that if US 10yr Bond Yields rebound further over the next week or so, the market could form a large “head and shoulders” top, which would suggest a more significant move lower in yields beyond 3.515/50%.
AND from the charts TO the BeachBoys (aka PIMCO)
Macro Signals From Corporate Earnings Season By Erin Browne and Geraldine Sundstrom
As we discussed in our recent Asset Allocation Outlook, “Risk-Off, Yield-On,” changing macroeconomic and financial market conditions have led to bonds rising in attractiveness relative to equities. In an environment of higher yields and slowing growth, we expect duration to be the first asset class to outperform. Within our multi-asset portfolios, before we broadly re-engage across the spectrum of risk assets, we will want to see convincing evidence that inflation has peaked, interest rates have generally stabilized, and corporate earnings estimates have been revised downward to acknowledge likely weakness in the broader economy.
PIMCO’s equity research analysts scour quarterly corporate earnings reports for insights into individual companies as well as trends across industries, sectors, and regions. More broadly, we’ve found earnings reports can be a rich source of timely intelligence about the business cycle and the macro outlook. We combine these bottom-up data with macro indicators and market signals to inform our multi-asset portfolio positioning.
Here are six themes from the third quarter earnings season in the U.S. that help inform our outlook for the economy and for investing in risk assets.
Supply and demand. In general, companies are moving from an environment in which they were building significant backlogs every quarter but struggled to deliver to one in which backlog delivery is supporting earnings but order growth is decelerating. This speaks to both improving supply chains and slowing demand. Overall revenue growth now exceeds order growth, portending further slowdown to come.
Labor. Reports of layoffs have mostly come from the technology sector, which is not representative of the broader economy as it constitutes only 2% of U.S. workers (source: ADP as of November 2022) and many tech companies pulled forward hiring activity during the pandemic. However, our analysis of earnings call transcripts shows that many U.S. companies are increasingly instituting hiring freezes. Freezes have primarily come from cyclically sensitive domains such as real estate, logistics, semiconductors, and certain areas of finance, in addition to tech. Some companies appear reluctant to reduce headcount after experiencing a tight labor market, and are cutting labor costs by reducing the number of hours worked. Indeed, regional Fed data show that the average work week has shortened meaningfully over the past six months.
Margins. After reaching record highs, S&P 500 profit margins fell by 43 basis points (bps) in Q3, according to FactSet. Excluding the energy sector, the Q3 decline was an even greater 137 bps. A challenging demand backdrop and elevated wage inflation is likely to result in negative operating leverage, further compressing margins in the coming months. We don’t see these trends priced into markets yet, and consensus estimates (as of the latest earnings reports) imply no year-over-year compression even though S&P 500 margins historically have declined by an average of around 80 bps during recessions. Tighter margins and corresponding market pricing are a key signal we are monitoring as we evaluate when to re-engage with equities in our multi-asset portfolios.
Corporate spending. Clear signs of corporate belt-tightening are emerging. In line with our transcript analysis, which shows sharp declines in capex sentiment and in mentions of corporate investment, a growing number of companies have cut capex guidance. Even the most resilient tech companies have shown signs of tighter budgets. The largest U.S. companies by market cap experienced significant slowdowns in advertising revenues, while cloud computing investments – one of the last areas to be cut – are also decelerating as of Q3.
Consumer demand. With volumes declining, U.S. retail and consumer discretionary companies that beat earnings estimates in Q3 primarily did so via pricing. However, more companies are reporting that consumers are trading down and price hikes are becoming more difficult to push through, while discount retailers are gaining share. Similarly, recent credit card data show that ticket sizes are declining and surveys indicate that consumers expect bigger discounts this holiday season. On the other hand, demand for services appears to remain strong, particularly in categories such as airlines and hotels, where the post-pandemic reopening boost has not yet faded completely.
Industrial demand. Deteriorating fundamentals are hitting a wide range of industrial end markets, including construction, consumer electronics, mining, and transportation. Several semiconductor companies noted that weakness that began in consumer verticals was spreading to industrial verticals, with the primary exception being the still-constrained auto market. Based on FactSet consensus estimates, industrials suffered the greatest magnitude of earnings misses out of any S&P 500 sector.
In summary, the bottom-up evidence we collected during earnings season substantiates our macro outlook of a deteriorating economic backdrop in an environment where high inflation will increasingly challenge margins. While the consumer has been generally resilient thus far given strong labor demand, there are emerging signs that this is changing. We will be monitoring both top-down and bottom-up signals as we approach the cyclical tipping point.
In closing, an ‘official’ account (St Louis FED) asking most important question ahead of the holidays,
… Inflation is top of mind for many U.S. consumers entering this holiday season, yet current prices don’t fully predict future consumer spending patterns. Because of the pandemic surge in demand for goods and supply-chain disruptions over the last few years, retailers have been aggressive in placing advance orders for this holiday season. Currently, retail inventories are about 20% higher than they were at the same time last year, and consumers are increasingly more price sensitive. According to the National Retail Federation, about three-quarters of consumers consider discounts and promotions to be an important factor in their buying decisions.
Given the elevated inventory levels, lower real incomes, higher travel costs and increased price sensitivity, promotions may play a larger role in driving holiday sales volumes this year. The CPI data collectors will carefully account for any discounts in measuring consumer prices.1
Finally, one last ‘toon to help get you in the mood … while Madden’s TurDUCKen should be enough of something for everyone, this