Stocks and bonds will eventually get it as this comes to a theater near you and me soon. Fill up yer tanks on the way TO work (then again on the way home) and gone are the days of ‘drill baby, drill’ … at least for now. Elections (around the corner) have consequences and here is Reuters ‘Morning Bid’ — a look at the day ahead because,
We’ll get some 3yr, 10yr and 30yr UST supply announced today and lets put / keep UST market wiggles in some context of supply concessions as well as trying to GAME the whatever next from officials — be they monetary policy ones, fiscal policy ones or sanctified cartels … ALL of which impact what you and I pay for a gallon of eggs, a dozen milks and prices at the pump.
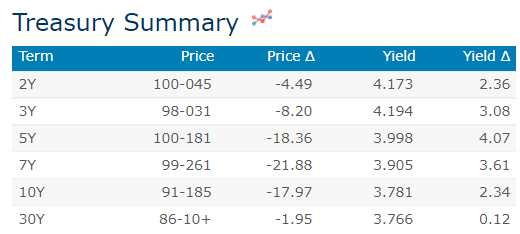
… here is a snapshot OF USTs as of 725a:
… HEREis what another shop says be behind the price action overnight…
… WHILE YOU SLEPT Treasuries are modestly lower after a belly-led sell-off overnight. Front WTI futures are lower (-0.3%) with the OPEC+ supply cut news offset by word of the US easing sanctions on Venezuela (see link above). DXY is little changed (+0.1%). Asian stocks were mostly higher (China still out), EU and UK share markets are mostly lower while ES futures are showing -0.5% here at 7:15am. Our overnight US rates flows saw a flurry of (5) futures blocks during Asian hours while our desk saw better real$ selling in the long-end. During London's AM hours flows were more subdued with mildly better buying noted. Overnight Treasury volume was weak overall at ~65% of average all across the curve.
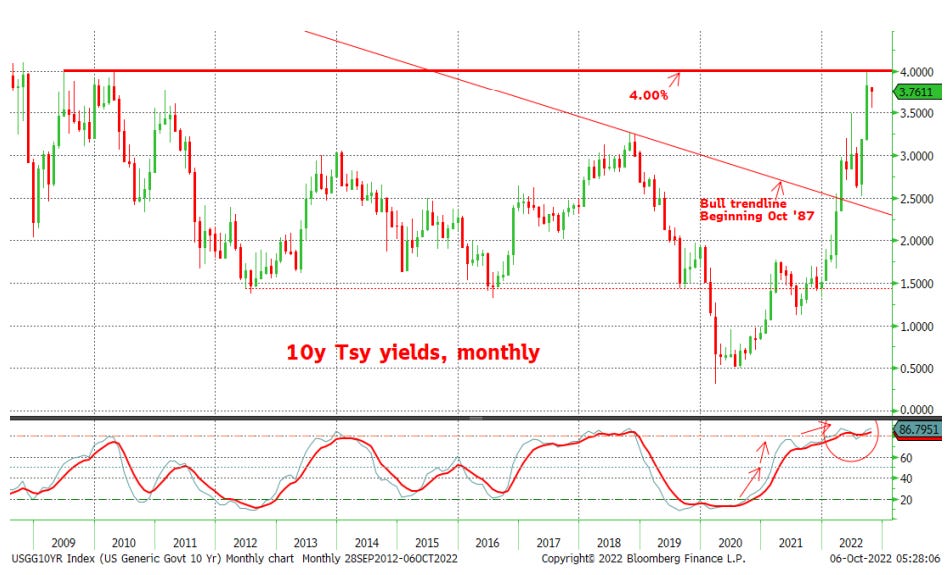
… Treasury 10yrs, monthly: What can be said about 10's is that the 4.00% area (briefly tested September 28th) remains a solid support for the benchmark. Last tested in mid-2009 and later in 2010, the barrier of demand at the level appears to be there still. Note in the lower panel that monthly momentum remains deeply 'oversold,' looking a lot (level-wise) as it did late in 2018. A further consolidation (3.50% to 4.00%?) and a later rally should be enough to reverse the still-bearish signal for 10's.
… and for some MORE of the news you can use » IGMs Press Picks for today (6 Oct) to help weed thru the noise (some of which can be found over here at Finviz).
And we’ve reached that part of the programming where I’d like to highlight / note a few things from Global Wall Street’s narrative inbox — a couple days worth, so bare with (humor)me if you’ve seen / heard …
First up is Goldilocks on the NOPEC+ ‘Earl decision
… If sustained through Dec-23 next year, such cuts would amount to $25/bbl upside from our previous 2023 $107.5/bbl Brent forecast, with potential for price spikes even higher should inventories fully deplete, requiring demand destruction as a last resort. This outcome is likely unsustainably bullish in our view. As such, we would expect the cuts to have to be temporary before some form of political detente allows quotas to move back significantly higher. To that end, OPEC+ have said the quotas will stand for at least November and December before the return of their biannual meetings that month[1]. OPEC+ also agreed to extend their framework, presumably with current baselines, through end-2023.
**IF** this is sustained, it’s going to be very bad. For stocks, bonds, and, you know, regular humans NOT privy with BBG terminal access to trade the bad / madness and turn a profit but relegated TO … filling up tank (us poor folk proxy for bein’ LONG ‘Earl?) to hopefully drive TO work (provided they’ve still GOT job at this point) …
And w/‘EARL — all the rage these days — a CHART which may / may NOT be of interest … THIS from BBG of 5yr BREAKS and ‘Earl
OPEC+ earned the ire of US President Joe Biden, and possibly other world leaders, with the biggest announced reduction in oil production since 2020. The cartel is defending the move by saying it needs to do this to protect the oil industry and their own economies from sagging global demand.
While the move helped WTI crude futures extend their recent rally, there’s plenty of signs the world economy is weakening sufficiently to drag prices back down sooner rather than later. Five-year US breakevens — a key gauge of the bond market’s inflation expectations — remain in a steep downtrend well under 2.5%. That says investors still expect a steep drop in consumer prices that would almost certainly require a severe economic slowdown to achieve. OPEC+ looks to face a world of difficulties trying to push crude sustainably back close to $100 per barrel, and even if it did so the hit that would deliver to already soft demand could make the medium-term outlook for oil, and the global economy, considerably darker.
A HIT to an already SOFT DEMAND picture which seemingly off the Fed’s radar screen at the moment as they attempt to affirm commitment TO fighting the ‘flation — see BOSTIC as recent example,
Specifically, the very last bit of BOSTICS SPEECH,
… Once policy reaches what I judge an appropriately restrictive level, I'm going to analyze and assess how the Committee's policies are flowing through the economy. If economic conditions weaken appreciably—for example, if unemployment rises uncomfortably—it will be important to resist the temptation to react by reversing our policy course prematurely.
I hope I've made it clear that I will be purposeful and resolute in the quest to bring down inflation. We cannot waver because price stability is necessary for us to achieve sustained maximum employment and to pursue an economy that works for everyone. Thank you.
Mr. MARKETS don’t seem to care much and while I’ve not checked THIS MORNING, a recent pricing of the ‘PIVOT TRADE’ indicating, well, the EXPECTATIONS back. BBG
The pivot trade is alive and well and was revived long before the Reserve Bank of Australia's dovish rate surprise Tuesday. Expectations for a US rate cut in 2023 have returned and are already edging back towards pricing in a move of around 40 basis points. They had briefly been wiped out amid the hawkishness of late September, at least according to pricing in the Eurodollar market. While the RBA raising rates by a less-than-expected 25 basis points has been interpreted by some as a sign that the end is in sight to the global wave of aggressive monetary tightening, Fed rate cut pricing actually narrowed a tad on Tuesday. That suggests at least US traders don't see the Australians as a bond market lead indicator -- a mantle they took on when the RBA’s sudden abandonment of curve control in late 2021 sent local yields spiking. And that in turn, means the rate cuts priced into the US market have likely returned on wagers of a severe economic shock forcing a U-turn from Fed policymakers.
With this PIVOT TRADE being back, there was THISfrom Mr. Big Short — Mike BURRY warning on stonks
… In a Sunday tweet, Burry said the current market backdrop reminded him of the second half of 2000 — some unloved stocks were trading at bargain prices, but high-flying names had further to fall…
With Mike Burry in mind, and permission from Ms. Danielle DiMartino Booth to share an excerpt from recent QUILL, I thought what better way to address some of the above as we await latest quarterly letter from Dr. Lacy Hunt. Ms. DiMartino Booth offered to her subscribers an interview and updated thoughts from Mr. Hunt (specifically related TO the revival of the Discount Window) and subscribers found this on page 6,
… I reached out to Hunt today to get his reaction to the buzz ignited by Michael Burry of “The Big Short” fame. On Tuesday, the Scion Asset Management founder warned that the U.S. economy was at risk of suffering the first sustained inflation in more than 40 years. His reasoning, as reported by Bloomberg, is that the frequency with which money moves through the economy has risen from the dead. In Burry’s view, “We are seeing a tick up in velocity, emerging from narrative obscurity. In 1978-79, rising velocity trumped falling money supply to drive inflation higher and higher. Redux would shock.”
To this Hunt replied, “The factor behind the rise is an increase in the bank loan-to-deposit ratio at the banks. This is a cyclical variable that will collapse when the recession hits and, along with lower marginal revenue product of debt, push velocity to new lows.”
The upshot: “The Fed is beginning to reverse the huge policy error, but they have a ways to go.” That journey is apt to be riddled with risk because, as Hunt contends, banks are already in a liquidity squeeze: “They’re basically having to liquidate securities to accommodate loan demand. The loan demand had been very robust earlier in the year. But it’s beginning to show signs of slowing now as they’ve been forced to sell their securities at the same time that the Fed was tapering which has put a lot of pressure on the front end of the Treasury curve. I believe that this liquidity shortage will intensify and add to the deterioration of economic activity later this year.” …
IF in the case you missed it, Ms. DiMartino Booth shared VIDEO INTERVIEW where you can spend about an hour listening to the conversation … Stay tuned for more from Lacy whenever it is that his next / latest quarterly drops and in the meanwhile, sincere gratitude out TO Ms. DiMartino Booth for allowing me to share this excerpt from a recent QUILL
… we think the 10-year Treasury yield can end the year between 3.25% and 3.75%, up from our previous year end forecast range of 2.75% to 3.25% …
As seen in the LPL Chart of the Day, the yield on the 10-year Treasury yield was up over 3.4% from its August 2020 lows and has already seen the biggest move higher in yields since 1983-84, when rates moved higher by 3.8%. Since the 1980s, the average trough-to-peak increase in 10-year Treasury yields has been closer to 2.5%, but that includes large rate increases in early 1980s when Treasury yields were much higher. Since 2000, the average increase in the 10-year yield during major moves higher is around 1.8%. Clearly, we’re not in normal times but the move on the 10-year Treasury yield since it bottomed in August 2020 has been significant.
The significant increase in yields, especially this year, is because of changing Fed rate hike expectations…
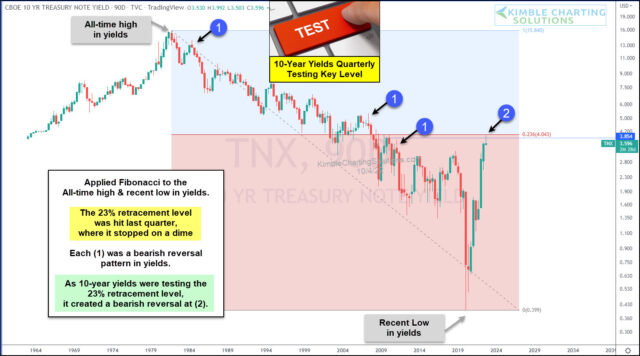
Thanks … thanks for that. Since we’re looking at 10yy yields, perhaps THIS ONE from Chris Kimble worth noting, too, as he appears ready to take other side here,
… As well, when we apply Fibonacci to the all-time high and low in interest rates we can see that the 10-year yield tested the first common fib retracement level this past quarter – 23.6%. And it stopped on a dime and reversed lower…
Okie dokie … place your chips down at the table and let me know what YOU think …
Moving along, a couple MORE things from the intertubes … first ZH (with links to source) notes,
Roughly 60% of Americans say they're living paycheck to paycheck - a figure which hasn't budged much overall from last year's 55% despite inflation hitting 40-year highs, according to a recent LendingClub report…
That ain’t good and we’re only just now staring down the barrel of the NOT hard landing …
Here’s one not from Global Wall Street BUT RATHER a quasi official source — Dallas Fed out with note / reminder as we all head to the polls in a few weeks,
A rising real wage allows workers to improve their standard of living. However, the Wall Street Journal recently reported that “… vast numbers of Americans find their cost of living is rising faster than the income they’re bringing home.”
How prevalent is this situation and how much is the shortfall? We find that a majority of employed workers’ real (inflation-adjusted) wages have failed to keep up with inflation in the past year. For these workers, the median decline in real wages is a little more than 8.5 percent. Taken together, these outcomes appear to be the most severe faced by employed workers over the past 25 years…
…How severe are the losses for workers experiencing negative real wage growth? For the 53.4 percent of such workers in second quarter 2022, the median decline (that is, half of the declines were larger and half smaller) in real wage growth was 8.6 percent.
How does the severity of the real wage decline in second quarter 2022 compare with the declines over the last 25 years? The average median decline over the last 25 years is 6.5 percent, with real wage declines typically falling in the range of 5.7 to 6.8 percent (Chart 3).
While the chart shows two declines that are more severe than in second quarter 2022, these spikes occurred during the Great Recession and in 2015 and, again, result from inflation turning briefly negative.
Technically, negative inflation readings move the large number of individuals with zero nominal wage growth out of the negative real-wage-growth category, which raises the conditional severity. However, these two episodes contrast with the current period in which the increase in the incidence and severity of negative real wage growth is associated with elevated inflation…
In case there were any doubt … FRBDallas has a BBG (likely a fleet of them) … they’ve got THAT going for them …
And from BBG, Ed Harrison notes,
Grey Swans Are Circling Markets Ripe for a Pivot The pace of rate hikes has become as potent in threatening global financial stability as inflation. There are already emerging signs of trouble around the world. This is adding to the reasons markets are starting to look for the Federal Reserve to ease off the brake. For now though, the Fed is still looking inward where the risks are more tilted toward a recession than a financial crisis.
…Global ‘Grey Swans’
Every time we get a whiff of global financial panic, people turn to the European banking system with dread. That’s because while US banks were forced to recapitalize aggressively after a global financial crisis made in America a decade and a half ago, the balance sheets of European institutions remain fragile. That’s because much of the risk that is securitized in the US and then passed on to investors’ balance sheets is concentrated in the balance sheets of European banks. So, I would call European banks a ‘Grey Swan’ — a known unknown. Add to that the war in Ukraine, Russian saber-rattling and the natural gas crisis in Europe, slowing growth and rising inflation, and the fragility of these banks can become systemic. Still, I am skeptical that this is the case right now.
The two banks on everyone’s lips are Credit Suisse and Deutsche Bank because both institutions have low market capitalization levels given the size of their balance sheet. That’s a reflection of poor returns on equity and the likelihood of future credit writedowns as prior bets go bad. Still, it may not be worrisome enough to put the European Central Bank off raising rates by three-quarters of a percentage point at its next meeting…