The following is a short excerpt from MSs chief stock jockey and his weekly note, and the section titled,
Is It Over Yet?
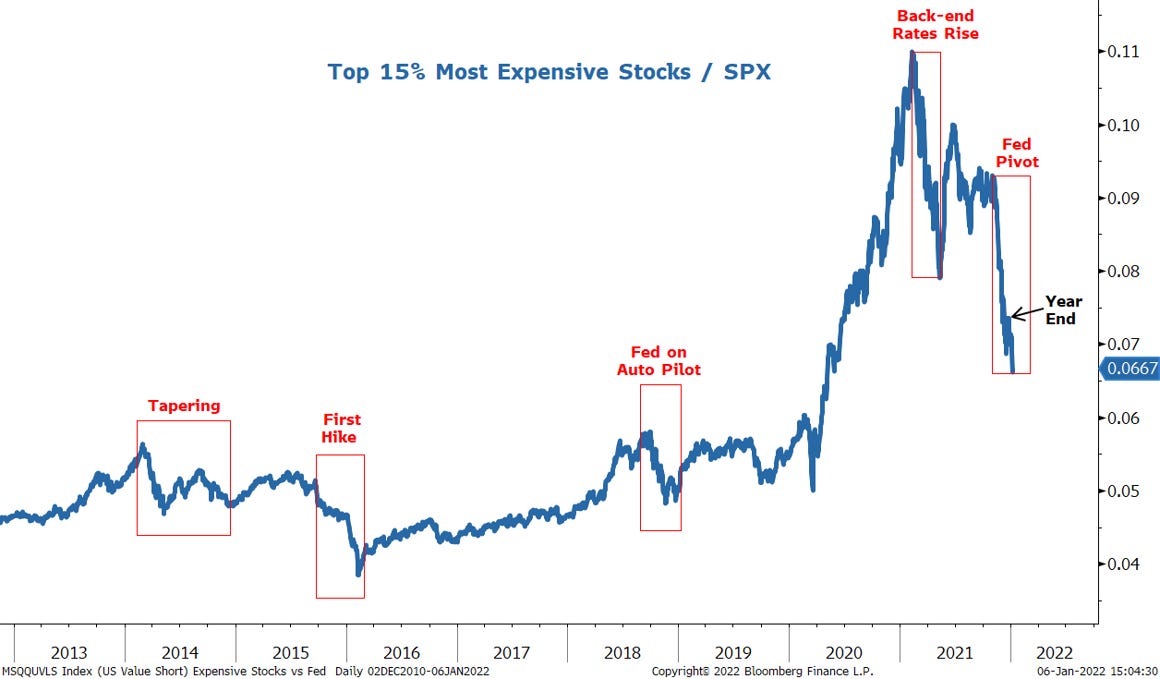
2022 is off to a blazing start with some of the biggest rotations ever witnessed at the beginning of the year. Truth be told, much of this rotation in the equity markets began back in November with the Fed's more aggressive pivot on tapering and rate hikes. More specifically, the most expensive stocks were down almost 30 percent in the last 2 months of 2021. Year to date, this cohort is down another 10%, prompting the number one question we get from clients—is it over yet?
Exhibit 1: De-Rating of Growth Stocks Started Almost a Year Ago—Are We There Yet?
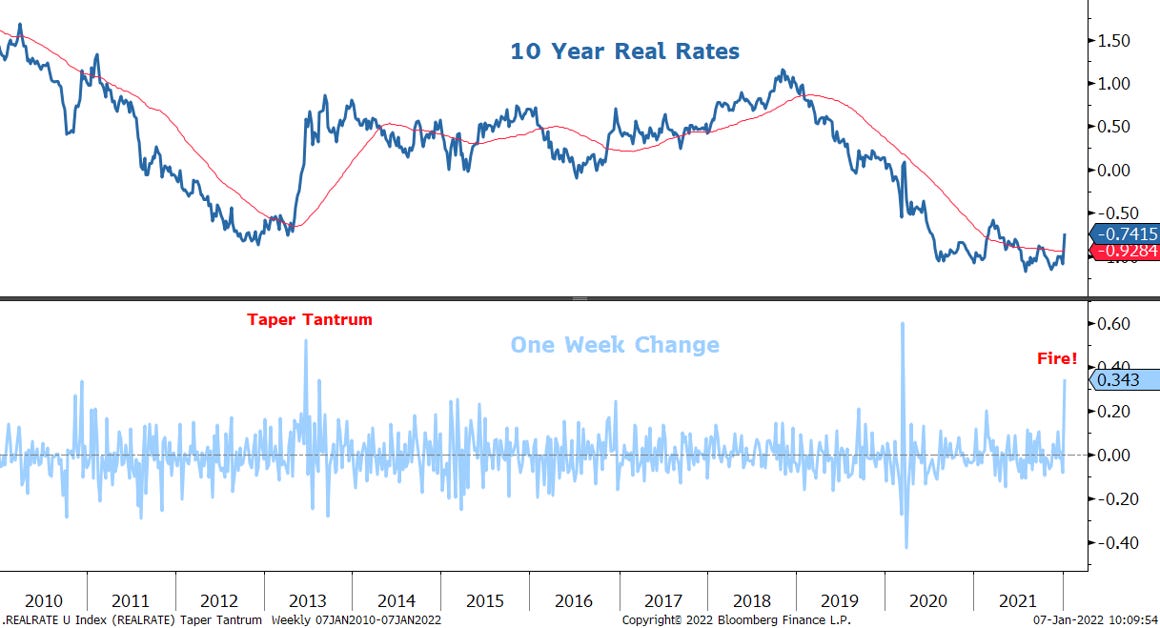
What's changed since the turning of the calendar year is the move in back end rates—both nominal and real. In fact, the move in 10-year real rates is one of the sharpest on record and harkens back to the original taper tantrum in 2013. There is little doubt that such a move is garnering the attention of investors even though it's something we believe equity markets have been thinking about for months. If you look again at Exhibit 1, it's easy to see that the equity market has been discounting this inevitable rise in real rates for months. This fits our Fire narrative and view that the equity market is smart enough to know that the rates market has been influenced by QE, and therefore using the stated rate structure for one's discount rate would be a mistake for any longer term valuation assessment. The obvious question to ask is why is the rates market suddenly waking up to the reality of inflation and the Fed's response to it. After all, this has been telegraphed for months. We think it has to do with several technical support mechanisms that are now being lifted. First, the Fed itself likely increased its liquidity provisions at year end to deal with the typical constraints in the banking system at this time of the year. Meanwhile, many macro speculators and trading desks likely shut down their books in December despite most views that long duration rates should be higher. This combination has now reversed and ignited what seems like an inevitable move that many risky assets have been discounting ahead of time. Based on the move in 2013, it looks like real rates still have further to run, potentially much further. Our rates strategists believe real rates are headed back toward 50bps which is another 25bps. From our perspective, real rates are unreasonably negative given very strong real GDP growth. Therefore, the Fed is absolutely correct to be trying to get them higher. It's also why tapering may not be tightening for the economy even though it is the epitome of tightening financial conditions for markets. Of course, the speed of this move is likely as important as the magnitude.
Exhibit 2: 10-Year Real Rates Accelerating Higher at a Historically Significant Rate
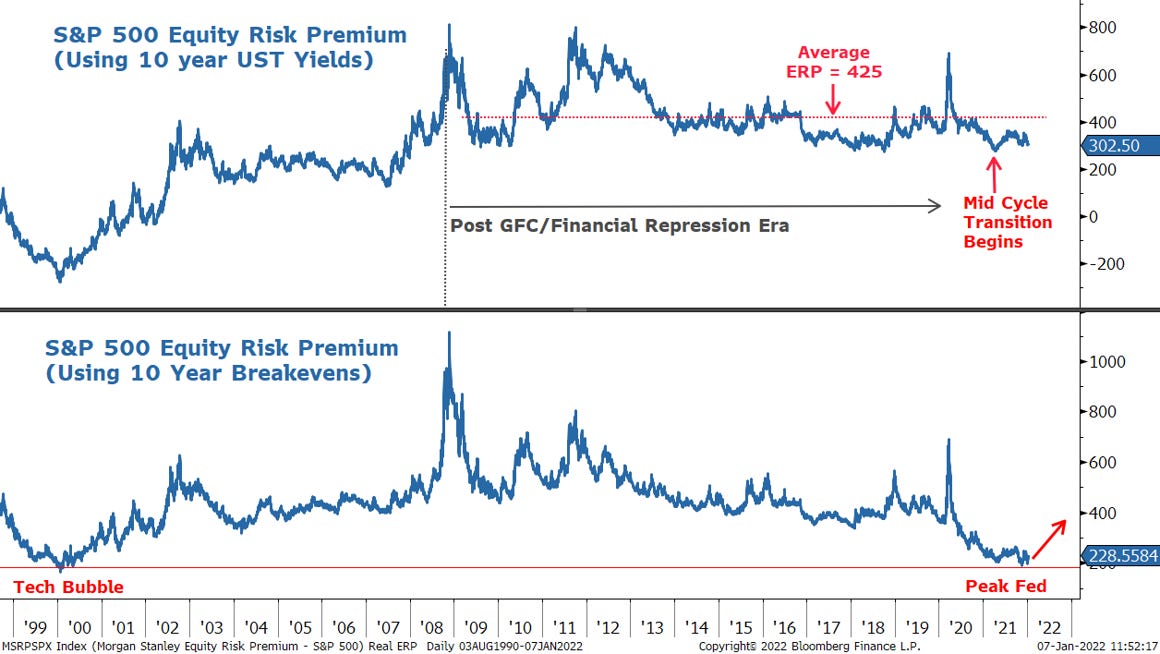
We have discussed this comparison to 2013 in prior research and made the following observations as it relates to equity markets. First, the taper tantrum in 2013 was the first of its kind and something the markets had not been prepared for at all. Therefore, the move in real rates was much more severe and swift than what we would expect this time around. Second, valuations were much more attractive in 2013 based on both P/Es and Equity Risk Premiums which adjusts for the absolute level of rates which are much lower today. Specifically, ERPs were 500 bps when the taper tantrum began in May 2013 (Exhibit 13, bottom panel). This time around they were just 350 bps. As a result, P/Es were much lower at 14x on the S&P 500 in 2013, whereas today they were 20x when the Fed first announced its taper in September. Readers may find it surprising to learn that P/Es are actually higher today than they were when the Fed first announced its plans to taper asset purchases, and ERPs are lower. In other words, valuations have actually increased as the tapering has begun, at least for the broader S&P 500 index…
THE NOTE continues on showing DIFFERENCES between 2013 and today (lookin’ at ERP with a ‘more realistic proxy for the risk free rate — 10yy),
Perhaps the best way to sum up the difference between 2013 and today's situation is by looking at the ERP using a more realistic proxy for the risk free rate. While it's fair to say that the current level of long term rates are likely underpriced for the current and hopefully future levels of nominal GDP growth, that begs the question what is a better one to use and one we can compare over time? In the past we have suggested using 10-year breakevens as a good starting point even though the Fed participates in that market, too. At a minimum, 10-year real yields should be positive unless one is assuming a very bearish growth outlook for the future at which point the earnings estimates will be wrong. By using breakevens as a proxy, one can see that ERPs are as low as they were during the tech bubble. In short, we've never seen stocks this expensive for the overall market which means valuations are likely to come down more before we're through with this correction. This is exactly our call for 2022, and why we think it's not done playing out.
Exhibit 4: Using Breakevens for Our ERP Calculation Shows Extremely Rich Valuation
And so there it is … a guy tasked with SELLING stocks on the sellside is, well, not so hot on them? I mean, you COULD say that the idea is to buy stocks as they are rising so that you too could sell them to ‘greater fools’ theory?
He continues to focus on PMIs and earnings REVISIONS and after a few more words/visuals, concludes with one final zinger … I mean observation…
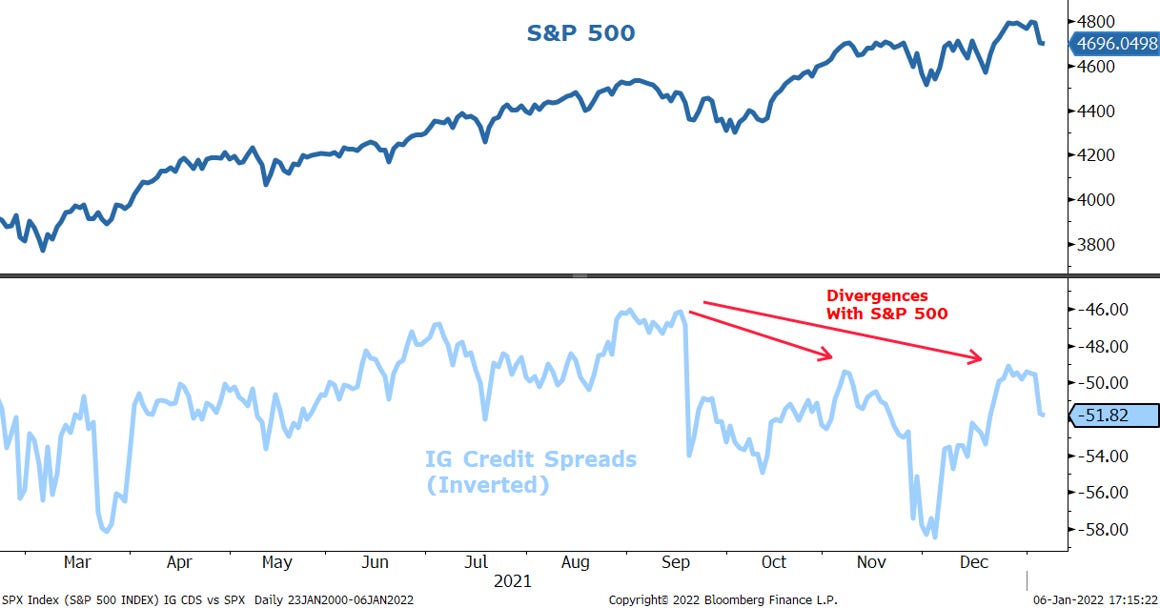
One final observation that suggests the S&P 500 may finally be ready to catch up to the weak breadth under the surface is the recent divergence with IG credit spreads. For most of 2020-21, credit led the rally in stocks, as it typically does coming out of a recession. However, on the last two highs made by the S&P 500 in November and then December, IG credit spreads did not confirm them with new tights. Given the importance of credit spreads to equity valuations via the risk premium channel, we would simply chalk this up as yet another thing to watch for the all clear sign that this correction is over.
Exhibit 13: IG Credit Spreads Have Not Confirmed the Recent New Highs in the S&P 500