('FI lethargy' and downside protection noted) while WE slept; 'Earl now DOWN on year; rent'flation 'plunging'
Good morning …
… here is a snapshot OF USTs as of 705a:
… HERE is what another shop says be behind the price action overnight…
… WHILE YOU SLEPT
Treasuries are mildly flatter on some receiving in 10y+ space seen overnight, though futures volumes are barely scratching 60% of the 5-day average. Positioning continues to show signs of deleveraging, FVH3 contract OI -74k / TYH3 -33k in last 3 session on long & short positions getting washed out in the current range consolidation. Interestingly, last night saw the first official reports out of the Chinese Politburo meeting, which brought indications of looser covid restrictions (see links above). APAC risk-markets traded off the earlier lows, but the lack of a definitive monetary easing bias appeared a disappointment (several articles pointed to “targeted and forceful” monetary policy support). Either way, DAX (-0.4%) and S&P futures (-0.4%) remain on poor technical footing, while 30y yields continue to waffle just above key resistance (3.488%). Flow-wise, there was little to point to in the FI lethargy overnight, though some downside TY protection was noted in chats (111/110 put spreads for 10k).
… and for some MORE of the news you can use » IGMs Press Picks for today (7 DEC) to help weed thru the noise (some of which can be found over here at Finviz).
As far as a few items from Global Wall Streets inbox goes, there’s no shortage of narrative material to go ‘round. THIS first one from John Authers of BBG made me pause and give thanks …
Be careful, here come the analyst predictions for 2023
… The planet takes 365 days to circle the sun, and it’s understandable that a year is an important unit for many of us. But it’s not clear that anyone should care much about exactly what will happen between Jan. 1 and Dec. 31. They’re arbitrary dates. Even if you’re correct in your predictions for 12 months hence, you might still be very wrong.
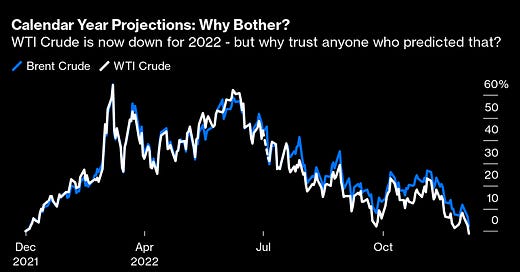
Exhibit A) to illustrate this comes from the oil market. As of Tuesday’s close, West Texas Intermediate crude futures are very slightly lower than they were on Jan. 1, while Brent crude futures have given up almost all of their gains. An energy analyst who predicted a rather dull and flat year for the oil market, with prices ending the year much where they began, would have been right. Except that this only worked out because the massive and largely unforeseen shocks of Russia’s invasion of Ukraine invasion and China’s draconian Covid-Zero lockdowns largely canceled each other out. Both seemed unlikely as the year began; neither can be called a “black swan.” Someone who failed to take account of those possible shocks hadn’t really prepared you for the thrills and spills of 2022, even if their final prediction looked good:
The chances are that anyone who was right about oil this year was right for the wrong reasons. But the pointlessness of basing all your attempts at prediction on a calendar year grows clearer when we move to the stock market.
Stock market analysts and strategists get a bad press (from me, and many others)…
… At present yet another incipient rally is being squelched. US equities ended Tuesday slower following a chorus of warnings from Wall Street executives. The tech-heavy Nasdaq 100 fell 2% after a rout in giants like Apple Inc. and Microsoft Corp. weighed heavily on the market, while the benchmark gauge saw its fourth straight loss.
Like many others, Sonders is bracing for more bouts of weakness in the stock market. If anything, she notes the shift in leadership from mega-cap names (particularly the internet-platform “FANGs”) to what she called the “average stock.” Volatility will continue pending more clarity on whether inflation is getting close to the Fed’s target…
… With less than 20 trading days left in the year,Sonders found quite a direct relationship between 10-year bond yields and the S&P 500, a correlation that has flipped through 180 degrees in the past two decades or so. The culprit: rising inflation.
Also from OD & Co — the first of many references TO Earl being DOWN … here’s a YoY look,
Thats GOOD news as we go into the holidays, right?
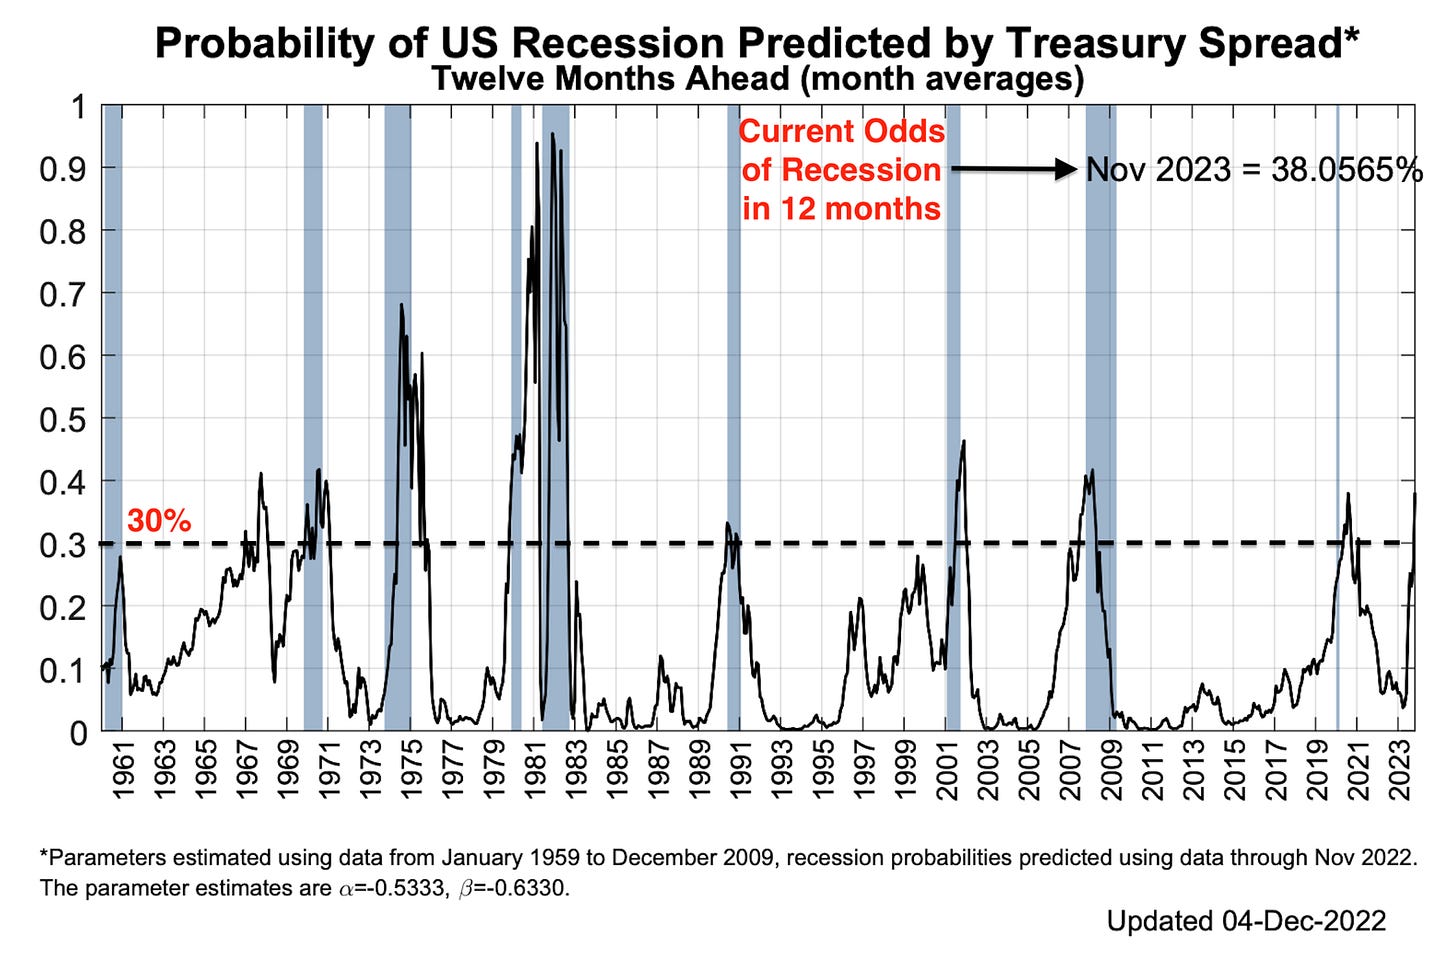
Moving right along AND at the risk of stating the obvious, it would appear the chance of recession is growing and as Nick Colas / Datatrek shows, OVER 30% via the Fed’s own model would suggest it’s coming within the year (or we’re already in one,
The NY Fed chart below, with our annotations in red, shows the model’s output back to 1960. There have been 9 recessions from then to now. In all but 2 cases (1960, 1968), a 30 percent recession probability signified that a recession was either already underway or would arrive in the next year. We have marked the 30 percent level with a dotted line:
All this is something of a problem because, as noted in the upper right-hand corner, the NY Fed’s model is now giving 38 percent odds of a recession in the next 12 months. This is obviously well above the 30 percent level we discussed above. On top of that, unless 10-year Treasuries start to see higher yields very soon, the NY Fed model’s odds will only climb further as the FOMC continues to raise interest rates. Three-month Treasuries yield 4.4 percent today. Chair Powell has said recently that the FOMC will likely increase its view of 2023 Fed Funds from the current 4.8 percent to something higher in the December Summary of Economic Projections out next week.
Takeaway: one-factor economic models may be dramatic oversimplifications of a complex world, but the NY Fed’s Recession Probabilities model has been accurate enough for almost 60 years to merit respect. It is clearly saying high short term interest rates are going to cause a recession in the next 12 months. Moreover, these odds are very likely to increase. Chair Powell will almost certainly have to answer a question about the likelihood of a recession at his post-FOMC press conference next week. He might cite the NY Fed’s model and say, “38 percent”. But, based on the model’s history, the real answer is “close to 100 percent”.
Speaking of MODELS and history, only in the fullness of time will we know if BLACKROCKS model and portfolio will ultimately prove to be most efficient. HERE is latest WEEKLY COMMENTARY (December 5, 2022) and …
A new playbook for a new regime
• The new macro regime is playing out. We think that requires a new, dynamic playbook based on views of market risk appetite and pricing of macro damage.
• U.S. jobs data showed lower workforce participation is propping up wages and confirming labor shortages should help keep inflation persistently higher.
• We’re watching services PMIs and key trade data for more signs of the damage from tighter financial conditions before key central bank meetings next week.… A new playbook is important because three long-term drivers of production constraints mean the new regime isn’t about to change, in our view. The first driver is aging. We see aging populations shrinking workforces and hitting growth. Second, a new world order. We think geopolitical fragmentation will lead to a rewiring of globalization and drive up production costs while also creating mismatches in supply and demand. Third, a faster transition to net-zero carbon emissions. We believe the global transition could accelerate, boosted by significant climate policy action, by technological progress reducing the cost of renewable energy and by shifting societal preferences as physical damage from climate change becomes more evident.
What does this all mean for portfolios? Our new investment playbook calls for more frequent portfolio changes and a granular approach. Take equities, we’re tactically underweight developed market (DM) equities. They’re not pricing the recession we see, but certain sectors are attractive, like healthcare. But we’re neutral in Japan given still -easy monetary policy. Strategically, we’re overweight DM stocks because we see better returns than fixed income over the coming decade. Within fixed income, we tactically like attractive income in investment-grade credit, U.S. agency mortgage-backed securities and short-term Treasuries. We stay underweight long-term government bonds though because we see investors demanding more term premium due to inflation and other risks. Our view that markets underappreciate the persistence of higher inflation underpins our high-conviction overweight to inflation-linked bonds, tactically and strategically.
… Investment themes
… 2 Rethinking bonds
• Fixed income finally offers “income” after yields surged globally. This has boosted the allure of bonds after investors were starved for yield for years. We take a granular investment approach to capitalize on this, rather than taking broad, aggregate exposures.
• The case for investment-grade credit has brightened, in our view. We think it can hold up in a recession, with companies having fortified their balance sheets by refinancing debt at lower yields. Agency mortgage-backed securities can also play a diversified income role. Short-term government debt also looks attractive at current yields.
• In the old playbook, long-term government bonds would be part of the package as they historically have shielded portfolios from recession. Not this time, we think. The negative correlation between stock and bond returns has already flipped, meaning they can both go down at the same time. Why? Central banks are unlikely to come to the rescue with rapid rate cuts in recessions they engineered to bring down inflation to policy targets. If anything, policy rates may stay higher for longer than the market is expecting. Investors also will increasingly ask for more compensation to hold long-term government bonds – or term premium – amid high debt levels, rising supply and higher inflation.
• Investment implication: We prefer investment-grade credit over long-term government bonds
Someone, it would appear, is NOT fully embracing the curve flattening and so, some likely UNDERPERFORMANCE relative TO peers?
And HERE is some GOOD NEWS — um, sort of …
And some MORE ‘good’ ish news of a different flavor — this from Dr. Bond Vigilante Yardeni,
… We know that gasoline and used car prices fell in November. Durable goods inflation probably continued to moderate. Heck, even rent inflation is plunging according ot ApartmentList (chart).
Here comes Santa Claus!
From the depths of the CHARTS department, a couple items / links to note. First, THIS from Chris Kimble on IG
Are Investment Grade Bonds (LQD) About To Rally?
…So, is it a good or bad time to sell bonds?
As November was coming to an end, the Investment Grade Bonds ETF (LQD) recorded its largest one-day outflows in its history at (1). Wow! Could this be a contrarian indicator of a bottom?
It’s worth noting that LQD recorded one of its lowest RSI (Relative Strength Index) readings in history and is turning higher after testing its 61% Fibonacci retracement level at (2).
Will these historic readings / indicators lead to a broader rally in investment grade corporate bonds?
Another chart which caught my eyes is from Bespoke and shows QQQ and TLT YTD returns and I believe is one of those pictures worth a thousand words,
Stocks and BONDS in mind, AllStarCharts makes …
… We know that bonds are likely to have a major impact on the stock market. So with rates across the curve struggling to maintain their recent highs, what is happening underneath the surface?
Would it make sense for Inflation-Protected Treasuries to outperform Nominal Yielding Treasuries if rates are above to fall apart?
And if rates do fall apart, how would stocks react to that?
Um. I know, I know … you gotta subscribe now to get the answer … right, ok fine …
Finally, I’ll quit while I’m behind but before I do, a few weekly macro charts and themes from an operation to always be known as 1stBOSTON,
The downturn in energy-related commodities highlights deteriorating global demand and reinforces our view that US 10yr Bond Yields have confirmed an important top, which should take us back to 3.07/00%.
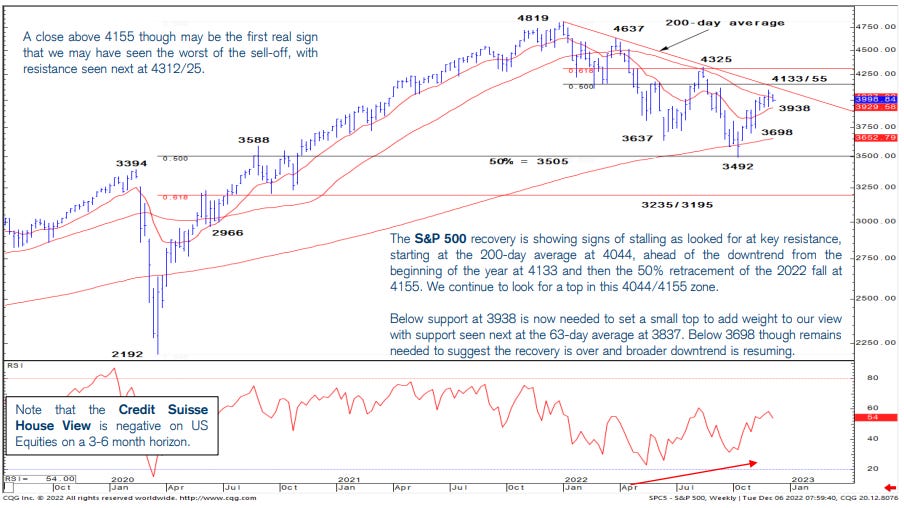
… We continue to look for a top in the S&P 500 at the 2022 downtrend and 200-day average…
Got it. ‘Tis the season SO am asking …
… THAT is all for now. Off to the day job…


