(Bunds lead USTs marginally higher on about avg volumes)while WE slept; % of years since 1793 when the long-term Treasury market rose -WSJ; Tip-flation
Good morning … THIS ONE from FoxBIZ caught my attention,
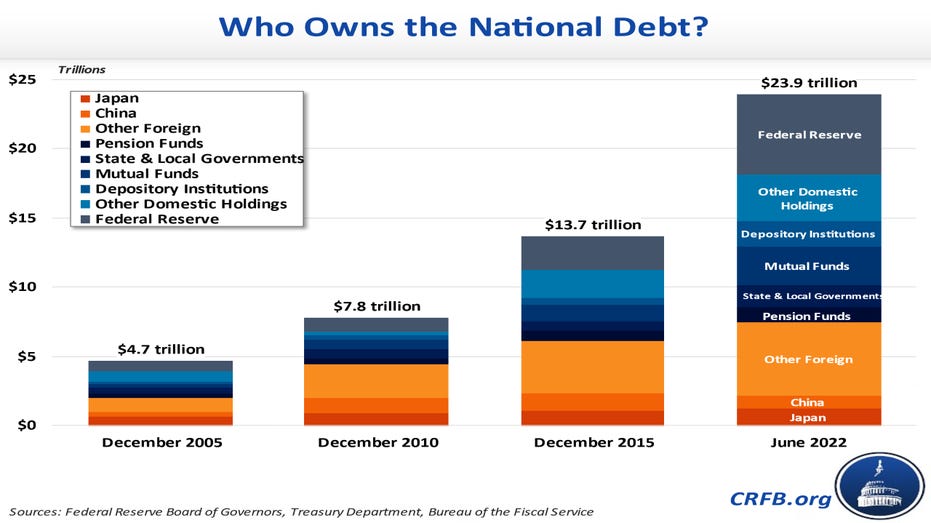
US debt explosion funded by Americans, not foreign countries, posing risks to economic growth — US treasury holdings by China and Japan have been falling
… here is a snapshot OF USTs as of 705a:
… HERE is what another shop says be behind the price action overnight…
… WHILE YOU SLEPT
Treasuries are modestly higher with Bunds outperforming this morning ahead of a nearly bare US economic calendar and a Fed blackout. DXY is modestly lower (-0.2%) while front WTI futures are too (-1.2%) after their $7-handle day yesterday. Asian stocks were mixed, EU and UK share markets are modestly lower (SX5E -0.2%, FTSE 100 -0.3%) while ES futures are UNCHD here at 6:45am. Our overnight US rates flows saw better real$ selling in the long-end during Asian hours, driving a bear steepener in curve before prices rebounded during London hours. Overnight Treasury volume was ~95% of average.… a similar short-term set-up can be seen in the Treasury benchmarks and we threw in the daily chart of Treasury 10yrs to show how it has tested/rejected its similarly-derived resistance near 3.50% while showing the new, tactical bear signal (lower panel) confirmed at yesterday's close. Duration looks like it predictably faces a challenge in the coming week or so via locally overbought prices (short-term positioning), proximity to resistance, etc.
… and for some MORE of the news you can use » IGMs Press Picks for today (6 DEC) to help weed thru the noise (some of which can be found over here at Finviz).
From IGMs Press PICKS to WSJ special MARKETS REPORT addressing what I noted some addressed over the recent days — specifically, are BONDS primed for a better 2023? WSJ,
Bonds Are Primed for a Better 2023, but How Much Better?
Investors might believe that after a horrible 2022, bonds can’t help but have a positive return next year. Not so fast.
… there are several reasons to think bonds won’t see the kind of comeback people want.
The first factor in play is what’s known as “regression to the mean.” People typically think this implies a big reversal in performance. In other words, a losing year is more likely to be followed by a winning year than another losing one, and vice versa.
But this represents a misunderstanding of what regression to the mean actually entails. It doesn’t mean that bonds will necessarily deliver a positive return next year. It instead implies that the second observation in a series—such as a year of market returns—is likely to be closer to the mean, or average, than the prior one, especially when that prior one was extreme. So, if bonds had a terrible 2022, they are likely to have a 2023 that is closer to the mean—returns could still be negative, however, just closer to the mean.
Things get even more complicated when you consider another factor—so-called trend following. This can be just as strong as regression to the mean, if not stronger, and thereby diminish its effects.
Trend following happens—in all types of assets, not just bonds—when a loss is more likely to be followed by another loss than a gain (and vice versa). In other words, the trend in play keeps going rather than reversing.
Prof. McQuarrie’s database shows how this plays out. Consider the years since 1793 in which bonds rose; they rose again the subsequent year 86% of the time. If regression to the mean were dominant, you’d expect this percentage to be higher in a year after bonds fell.
This has not been the case, however. Following declining years, bonds rose less frequently—79% of the time. This suggests that trend following in the bond market is reducing the impact of regression to the mean. Furthermore, this impact becomes increasingly strong the longer the declines last.
TO the Global Wall Street inbox and this first reminder just how quirky Friday’s NFP beat might have been …
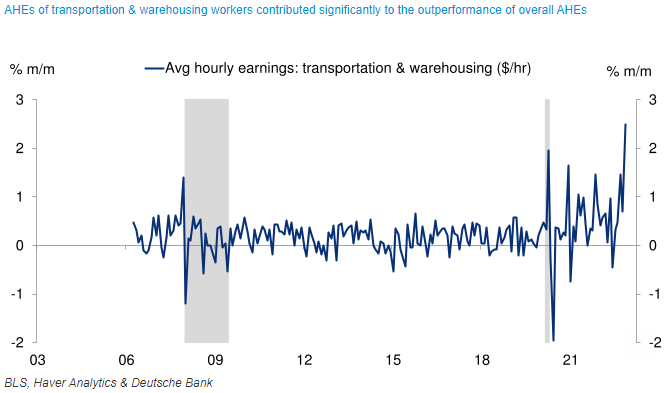
… While we always caution against reading too much into one particular payroll report, the November release may warrant an extra grain of salt. First, the response rate for the establishment survey, which measures nonfarm payrolls, hours and earnings, was just 49.4%, well below the normal 65-70% range and the lowest since 2002. Hence, we could see significant revisions next month as more survey responses are collected. Two, most of the upside surprise to AHEs was due to the transportation and warehouse sector, which showed +2.5% monthly gain - over five standard deviations above the average and by far a record increase. Note, also, that the jump in wages in the aforementioned sector came alongside declines in both hours worked and employment. Three, information services AHEs (+1.6% vs. Unch.) also showed an unusually large gain that was about 2.5 standard deviations outside of the average. Combined, the unusually large increases in these two sectors likely boosted overall AHEs by around one to two tenths in our view.
That said, our overall read on the November employment report is that it is unlikely to change the Fed's perspective. Despite the aforementioned issues with the data, which may look somewhat different upon revision, the picture that Chair Powell painted of the labor market last week remains largely the same – it is still a historically tight labor market that reflects an imbalance between supply and demand…
Quirky beat, then indeed … moving along to something from 1stBos and ZP who has been on the quiet side lately (unless of course I’ve missed something),
I am stunned every time a client asks me if I am worried about the current level of reserves in the U.S. banking system. The market’s search for the level of reserves at which the system “breaks” implies that the market is worried about a repeat of the 2019 repo blowup. Such fears are misplaced. To be clear, there are risks lurking in funding markets, but they have nothing to do with the draining of reserves via QT (watching paint dry). Rather, they have to do with the draining of reserves via geopolitics (Russia responding to price caps).
The fundamental difference between QT during 2018-2019 and QT today is that the first episode of QT happened while balances in the o/n RRP facility were zero. The U.S. financial system didn’t have a penny of excess reserves, except for what banks had over and above their lowest comfortable level of reserves (LCLoR). The bid for repo funding was immense and the marginal repo lenders were banks with excess reserves to lend… until they ran out of reserves to lend.
When the reserves ran out, o/n repo rates spiked and the music stopped until the Fed started to print reserves anew and broadcast them using a new o/n repo facility (the SRF). The chances of the same happening today are low. Worrying about how close banks are to their LCLoR is pointless for three reasons.
First, demand for repo funding is weak today, in sharp contrast to demand during 2018-2019 when demand was breaking new highs every single day…
Second, balances in the New York Fed’s o/n RRP facility represent reserves that the financial system did not bid for during the day. In other words, the balances in the o/n RRP facility represent cash the system does not need…
Third, if for some reason we still end up in a situation of LCLoR miscalibration, the system has two pools of liquidity to tap: the $2 trillion under the mattress (see above) or the SRF. The raison d'être of funding markets is to mobilize excess cash; today, $2 trillion is waiting to be mobilized through funding markets…
From one rockstar to the next, some of the latest updated Global Views from Goldilocks out with some 2023 outlook Q&A suggesting … gulp …
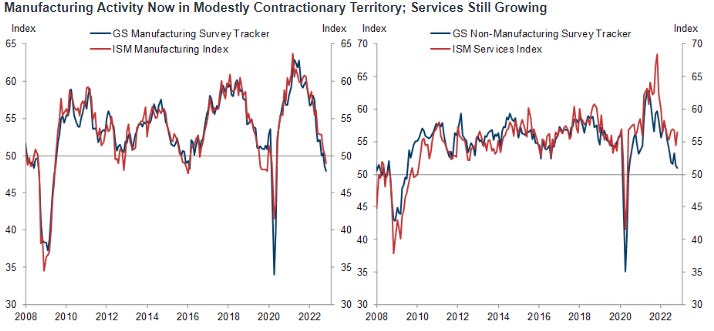
Q: On one side of your narrow path to a US soft landing lies a descent into a near-term recession. With that in mind, do you worry about the drop in the manufacturing ISM to 49.0 and the plunge in the Chicago PMI to 37.2, a level never seen outside a recession?
A: While the manufacturing sector is clearly softening, the Chicago PMI is an outlier. Our manufacturing survey tracker—which includes the Chicago PMI among many other surveys—has fallen only into modestly contractionary territory, broadly consistent with the manufacturing ISM as well as previous slowdown episodes in which the overall economy continued to expand. At the same time, our nonmanufacturing survey tracker remains in expansionary territory, and the nonmanfacturing ISM actually printed a surprise rebound to 56.5 in November.
From its different this time TO the year 2075 the same firm goes …
The Path to 2075 — Slower Global Growth, But Convergence Remains Intact
Two decades since we first set out long-term growth projections for the BRICs economies, we are updating and expanding those projections to cover 104 countries out to 2075. We identify four major themes for the global economy:
Theme #1: Slower global potential growth, led by weaker population growth…
Theme #2: EM convergence remains intact, led by Asia’s powerhouses…
Theme #3: A decade of US exceptionalism that is unlikely to be repeated…
Theme #4: Less global inequality, more local inequality
Demographics matter … SO, whether or not this CYCLE or time is different — and believe me when I say I CAN relate and I think we have ALL had these feelings from time to time — lets continue trying to stay in THIS moment rather than think so far ahead TO 2075. There are, as always, so many cross currents at the moment. Barclays summarizes it quite well,
Global Macro Thoughts: Mixed messages
The macro backdrop is confusing, with a tight US jobs market but softer inflation data in the US and Europe. The oil price cap and EU oil embargo have kicked in, but OPEC has backed off new cuts, and China is easing some Covid curbs. With CPI and the Fed meeting likely to move markets, we turn neutral on risk assets.
…Mixed signals on the inflation outlook from the latest data
Fear NOT as Scott Grannis notes and writes,
Lower interest rates to the rescue
… Another key difference this time around is that the bout of inflation we have suffered was not the result of Fed policy (it is usually is). It was the result of a massive surge in Covid "stimulus" payments which put trillions of dollars into the hands of people who were still hunkered down and unable to spend it. The result was a multi-trillion dollar surge in bank savings and deposit accounts. Once the Covid scare passed, the liquidity dam broke and a tsunami of price increases spread throughout the economy.
So it wasn't low interest rates that caused the problem, it was too much government spending. Higher interest rates came to the rescue, giving people and incentive to hold on to their extra cash, and that minimized the spending tsunami. Now, interest rates can decline and help the economy get back on a normal track fairly easily. It won't all happen at once, but the wheels have been set in motion. Meanwhile, M2 is declining, which means that excess cash is being reduced with the passage of time…… Chart #6 shows the burden of our national debt, which is the cost of servicing the debt as a percentage of GDP. I've estimated what it will be by the end of this year. And as you can see, it will still be very low from an historical perspective because interest rates are still relatively low. If interest rates stabilize or decline from current levels, and the economy remains reasonably healthy, the debt burden is unlikely to reach unprecedented levels.
It all depends on how the economy behaves—how much inflation we have and how much growth. Higher inflation shrinks the burden of debt, because it can be paid back with cheaper dollars. A stronger economy boosts tax revenues, which helps support debt repayment. And in any event, paying back the debt is not equivalent to flushing money down the toilet. Every dollar of interest paid on our debt goes into someone's pocket. It doesn't disappear from the economy.
What's bad about our national debt is not the amount of debt that must be serviced, it's what was done with the money we borrowed. Therein lies the real burden of debt. If the money borrowed is squandered, then that places a huge burden on an economy that has not become more productive or more efficient. Unfortunately, a huge portion of our current debt (about $5-6 trillion) was money that was borrowed—or printed—and then handed out to the public. Using debt to finance spending is terrible, since it doesn't enhance the economy's productivity. We essentially wasted $5-6 trillion that might have been better spent on investments that create jobs. The real burden of that debt will thus be paid by future generations, in the form of a slower-than-average rise in living standards.
Finally, we’ve ALL been there and had that awkward moment but few of us have thought interanally, CREEPFLATION!
… THAT is all for now. Off to the day job…


