Good morning … With 2yr Treasury auction on tap, I thought that might be a fine and dandy way to start us off,
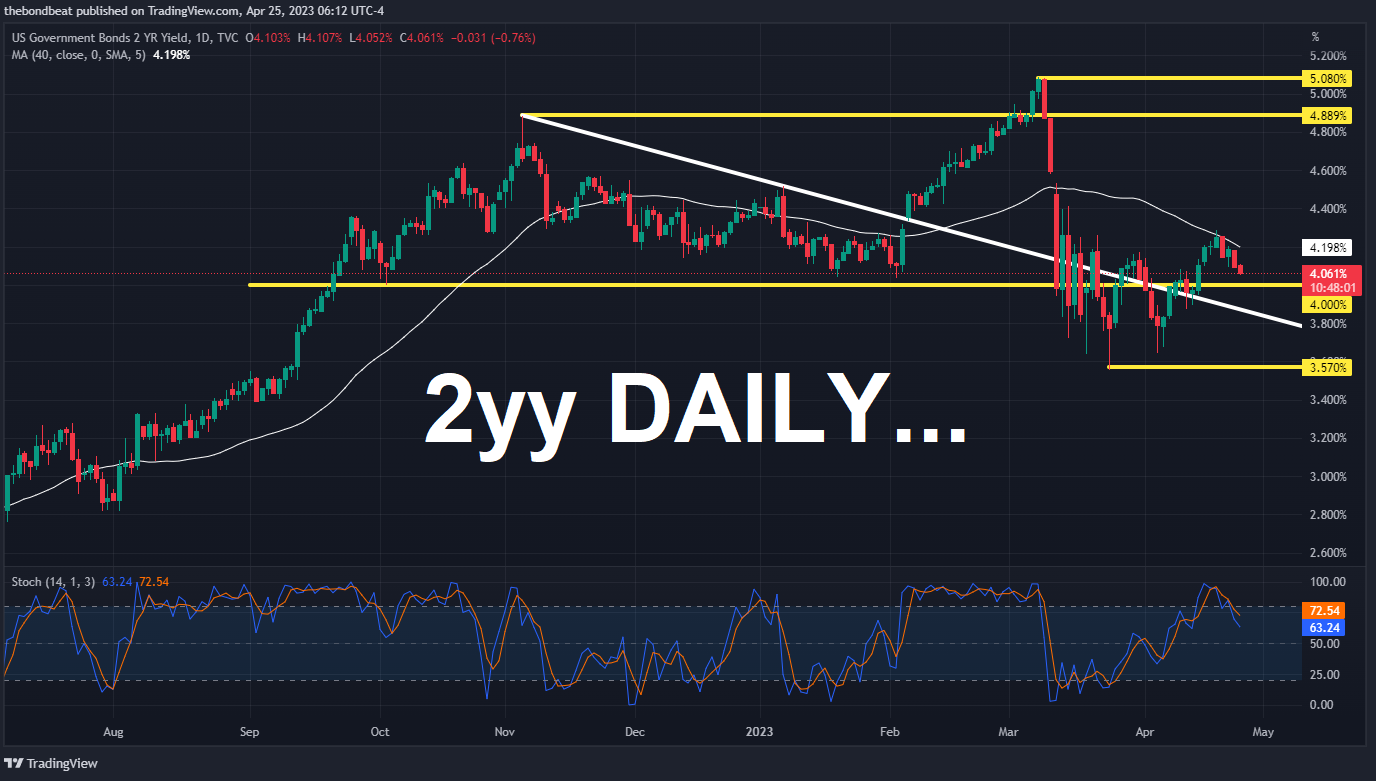
Momentum (stochastics, bottom panel) appear to have crossed just about when 2yy touched their 40dMA (4.25%) and while a rally doesn’t strike ME as an opportune ‘setup’ for this afternoons auction … well, we’ll have to see IF other things out there (ie First Republic, etc) remind folks USTs ARE in fact an alternative.
… here is a snapshot OF USTs as of 705a:
… HEREis what this shop says be behind the price action overnight…
… WHILE YOU SLEPT Treasuries are higher and again being led by the belly and intermediates with German bonds outperforming (see discussion and attachment on this) Tsy and Gilt peers. DXY is modestly higher (+0.1%) while front WTI futures are modestly lower (-0.65%). Asian stocks were mixed again with some countries on holiday, EU and UK share markets are mixed/lower with ES futures showing -0.5% here at 6:55am. Our overnight US rates flows saw a risk-off tone pervade the overnight session after some late day bank earnings yesterday. We saw better receiving in Asian hours with flows turning more mixed during London's AM session. In cash space, London saw better HF selling into the price bounce though some of the front-end selling we saw was likely a supply set-up. Fast$ also added 5s30s steepeners (see attachment and discussion). Overnight Treasury volume was around 70% of average overall.
… Treasury 2yr yields, daily: If one looked up "Bear Flag" (we say bear flag because it guides lower but it's really a bull flag because it's yields not prices of course) online you might see a picture like this one. We said last week that the hold of support near 4.25% was a key sign of strength for 2's and now you can see why. The flag/range is clear (~4.25% above and ~3.77% as a guess below) and this range is our immediate focus. That said, the strong vibe here is one of a 2yr just catching breath before resuming a bull move to a new move low in yields (our target 2.97% in the coming months)
I like their visual better than mine but that’s besides the point … and for some MORE of the news you can use » IGMs Press Picks for today (25 APR) to help weed thru the noise (some of which can be found over here at Finviz).
From some of the news to some of THE VIEWS you might be able to use… here’s what Global Wall St is sayin’ … SOME of these may now be ‘old’ news as I’m continuing to sift thru the inbox and so …
Ever wonder WHO’s WHO in as far as Fed’s {DOTS <GO>}? Well if you had this thought before, a rather large German bank’s got some answers,
Ahead of the Fed’s blackout period, divisions on the path ahead for monetary policy became clearer. In this brief note, we identify the 2023 dots from the March SEP as a way to better understand the nature of these divisions. Notable from this identification is a dispersion of views among voters, which as we note, could lead to dissent risks at upcoming meetings.
From Fed and it’s merry men / women and their dots TO some other clowns in DC who’ve got to get to work ahead of the XDATE. Wells Fargo attempting to help narrow down / spell out a time frame with these moving goal-posts
In mid-January, we published a report on the outlook for the U.S. federal government's borrowing limit, also known as the debt ceiling. Since then, the U.S. economy has evolved tumultuously. However, one thing that has not changed over the past few months is policymakers inability to come to an agreement to increase or suspend the debt ceiling. Our sense is that Congress and the president are no closer to a debt ceiling resolution than they were when we published our last report on January 19.
In the meantime, the U.S. Treasury has leaned on incoming tax revenues, cash on hand and "extraordinary measures" to remain current on all its obligations despite the binding borrowing limit.
The month of April is typically the largest month of the year for federal tax collections because of the annual filing deadline for individual income taxes. As a result, the incoming data on April tax receipts are critical to the outlook for the debt ceiling "X date", or the date on which the Treasury would be unable to meet all of its obligations on time due to the debt limit.
Tax revenues in 2022 were unusually strong, and some payback this year was inevitable. However, April tax collections thus far have been slightly weaker than we anticipated.
Our base case projection for the X date has been early- to mid-August since we laid out our initial forecast in January. In our view, an X date in early August is still the most probable outcome. More specifically, the first three days of August seem most likely to contain the X date.
However, we believe there is a small tail risk that the Treasury could hit the X date in the first half of June. In our view, this presents a difficult risk management question of how high the probability of default in early June needs to be such that Treasury weighs in with guidance that the debt ceiling must be resolved in the next six weeks.
A low but not insignificant probability of a U.S. default is still very concerning, and we would think the last thing Treasury officials want is an X date that sneaks up on Congress. If Treasury gives explicit X date guidance in the coming weeks, we would expect markets to gravitate towards this as the "official" X date.
Ultimately, our economic forecast is predicated on the assumption that the debt ceiling is eventually increased or suspended with little to no collateral damage on the real economy. However, past brushes with default have tightened financial conditions, occasionally in a significant way, such as the summer of 2011.
We covered whether Treasury could adopt a prioritization plan in our January report on the debt ceiling, and we would direct interested readers to that piece for further reading. But as a reminder, even if a payment prioritization plan is implemented by the Treasury Department, such a plan would be entirely experimental and would still come with a litany of legal, technical, economic and political challenges. The economic impact of a default is highly uncertain since that has never happened previously, but economic modeling suggests the fallout could be quite severe.
Goldilocks attempting to frame, historically, banking stress and monetary policy reflex
The Historical Monetary Policy Response to Banking Stress by G10 Central Banks ■ Central banks have turned less hawkish following the emergence of banking stress in the US and Europe in March, leading to lower rates pricing. In this Global Economics Analyst we show that the change in policy stance is consistent with historical G10 central bank responses to banking stress, although the size of the rate pricing move appears somewhat overdone.
■ Consistent with the more dovish policy outlook, central banks have cut interest rates within 6 months in 70% of pre-GFC historical banking crises. Even in crises in which the economy avoids a recession, they are four times more likely to lower than to raise interest rates. Cuts have historically been moderate, however, typically totaling 50-100bp after 6 months.
■ Furthermore, a rapid pace of pre-crisis rate hikes and inflation has historically not been an impediment to rate cuts. In our sample of G10 banking crises, there is no meaningful relationship between central bank monetary policy responses and pre-crisis policy rate changes or pre-crisis inflation.
■ Comparisons to full-blown banking crises may overstate downside policy risks, however, as banking stress has eased recently in both the US and Euro area. We therefore develop a set of banking and broader financial stress indices and combine them with a regression model to test more precisely how banking stress affects monetary policy actions. We again find that banking stress historically lowers the policy rate trajectory, and that central banks tend to respond more strongly when stress spreads to the broader financial system or they have a stronger financial stability mandate.
■ Our model predicts a moderate downward shift in end-2023 rate pricing in most economies due to banking stress, although on average not as large as the shift in market pricing since early March. This discrepancy appears even larger if we exclude recessions from our estimation sample—as would be appropriate if our forecast that banking stress will not cause near-term recessions is correct—and particularly large in the US in either case.
■ Taken altogether, these patterns support our view that the global hiking cycle is now in its home stretch, but that current rates markets pricing looks downbeat.
From EPB Research and in the case you missed … some reasoning for bonds in a portfolio … ok, well NOT directly so BUT implicitly because,
… Going back to the late 1960s, the average recession start date occurred when the Leading Index registered a growth rate of -4.8%. The Conference Board sets a recession threshold at -4.2%, which is the median of the past recession start dates.
In either case, today’s growth rate of -8.1% is far worse than the average recession start.
Leading indicators are broadly sounding a loud and imminent recession signal. Coincident data has been drifting lower, but has not “plunged” into recessionary territory yet…
The worst is yet to come, eh? Welp … Seems like Eric is NOT alone in his process of thought … Professor Siegel's LATEST Weekly Commentary,
… I still believe the cumulative effect of tightening rates and the banking reverberations will slow things down dramatically and make it hard for the stock market to break out from these high levels it has reached several times before. I remain uncharacteristically cautious until the Fed ‘gets it’ and not only pauses but says it is starting to look at rate cuts. I believe the real interest rate is too high to sustain normal growth at this point in the cycle.
Is it time to ‘Sell in May and Go Away’ as the famous market mantra suggests? We are approaching a challenging time for the markets. Summer rallies used to be quite a prominent market feature in 1960s and 1970s, but it has not been particularly good more recently. April has been a stronger month, particularly the first half. In short, seasonals and the Fed’s over-hawkishness are working against strong stock performance at the moment, yet increasingly there are signs the October lows will certainly hold.
In as far as BONDS as hedge putting / keeping the ‘40’ in 60/40,
… Now that the dust has settled, I believe the renewed classic intermarket relationship between stocks and bonds and the familiar patterns of risk-on/risk-off behavior bodes well for the overall market.
Especially when you consider easing volatility…
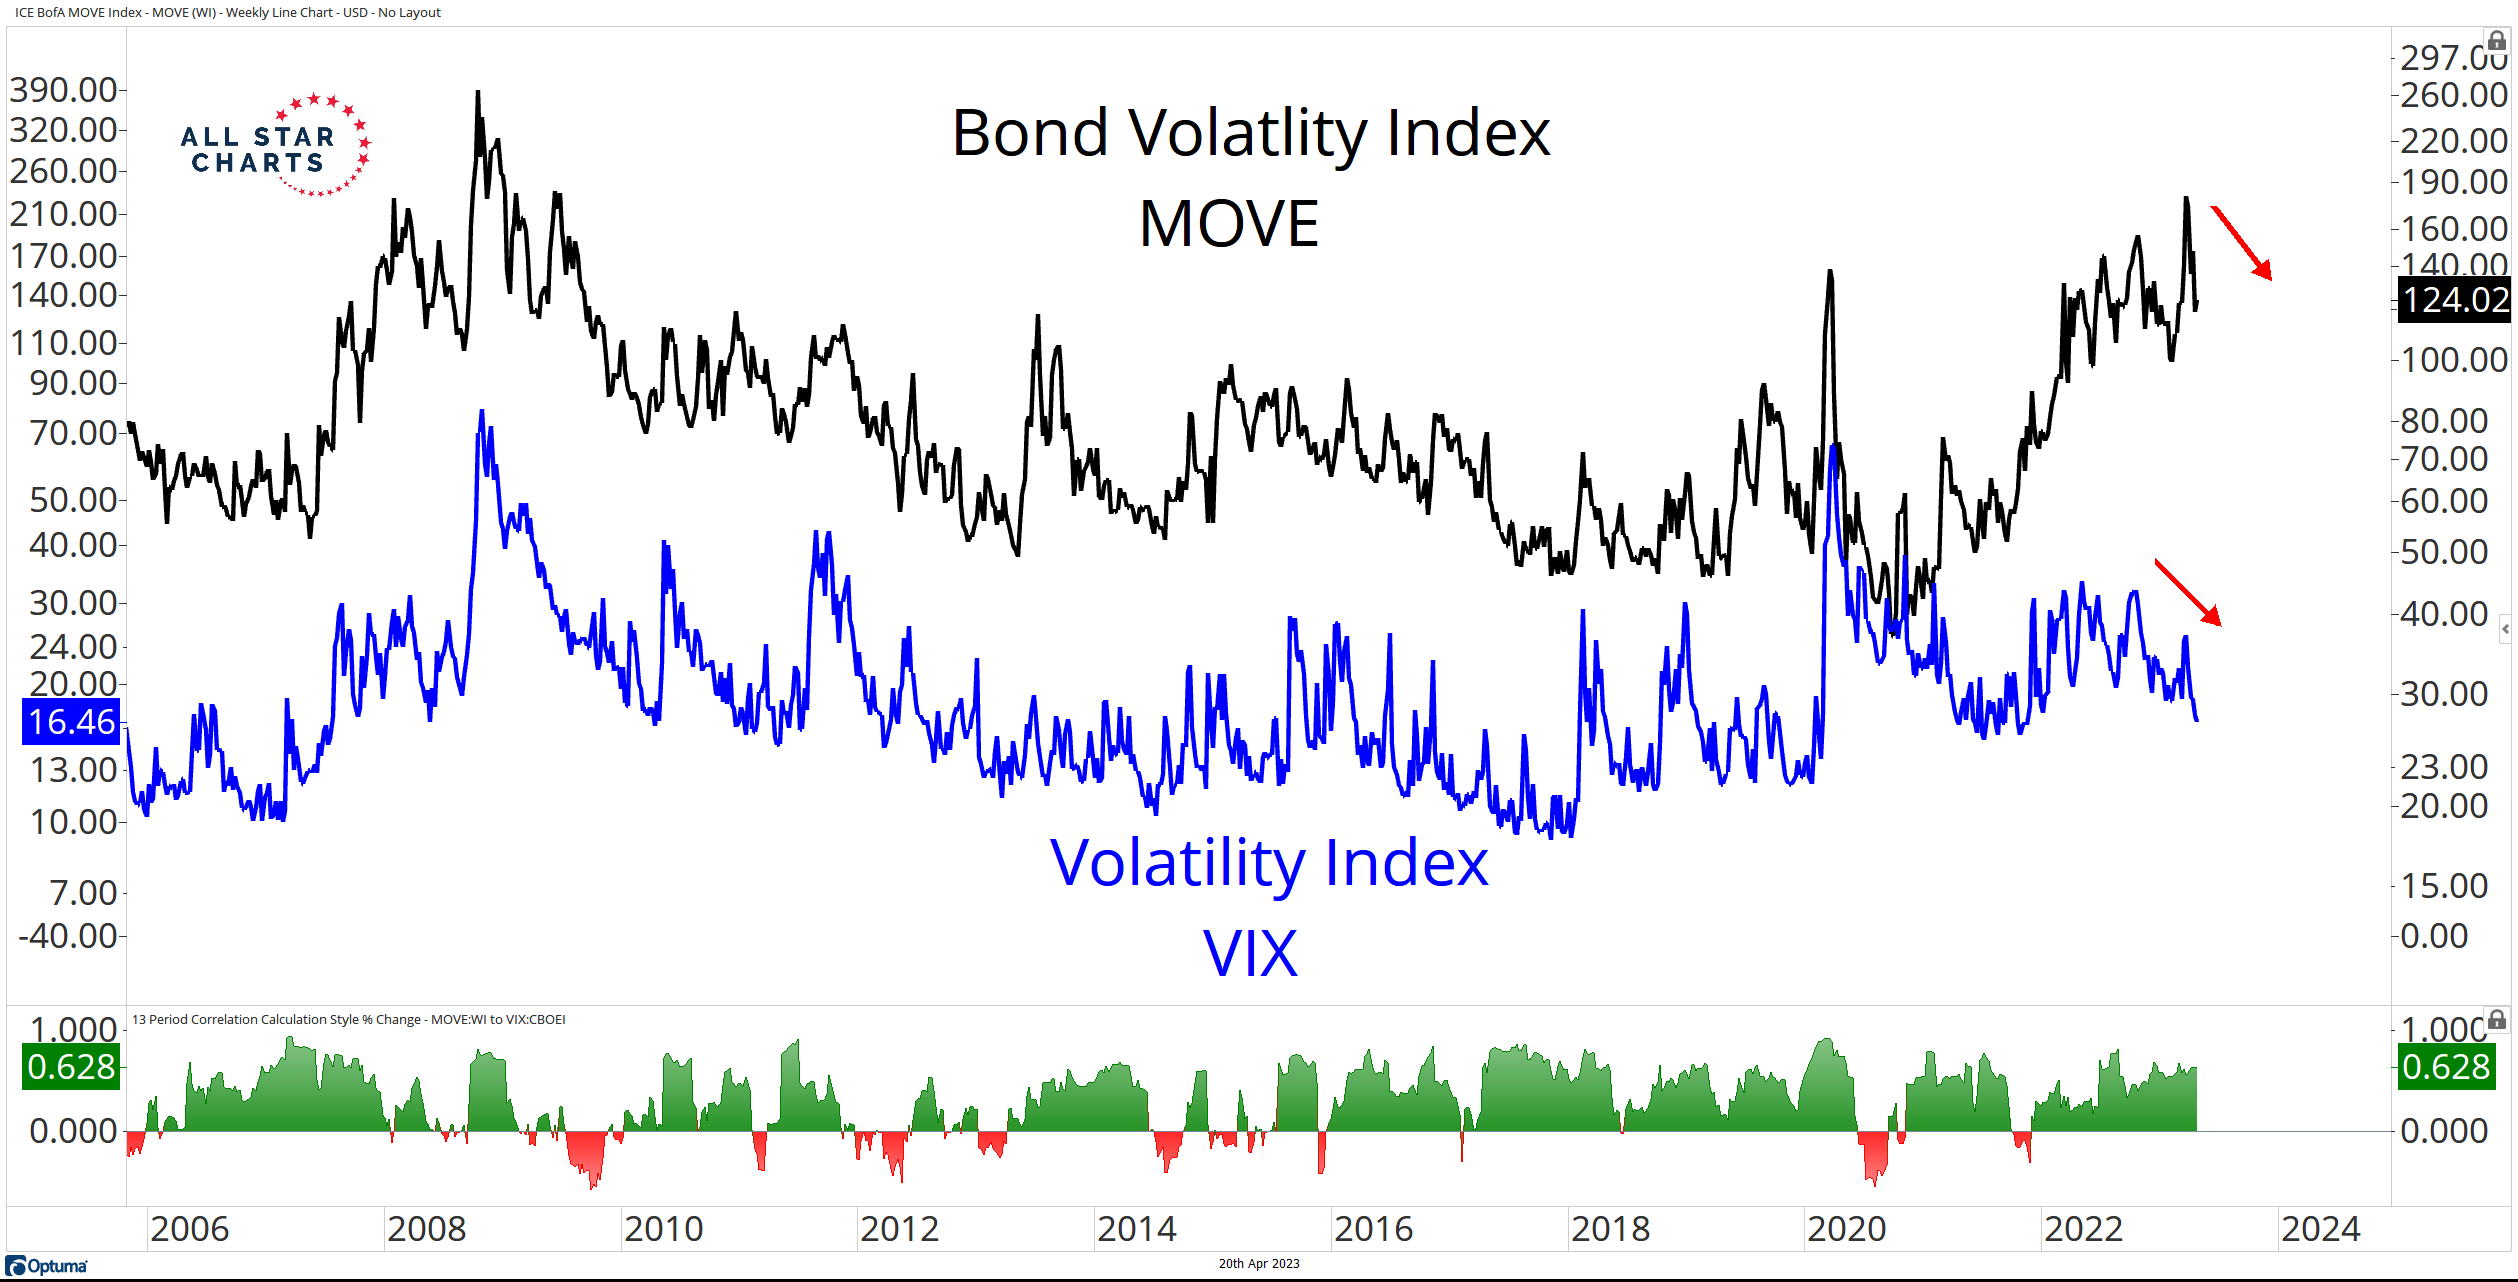
Here’s an overlay chart of the Bond Volatility Index $MOVE and the S&P 500 Volatility Index $VIX:
Both indexes shot higher last month as markets struggled to reprice bank stocks in light of added risks. The MOVE index rose to its highest level since the financial crisis. And the VIX revisited levels from last Oct.
But the levels aren’t that important. Instead, the directional moves carry far greater weight. Serious problems occur when the MOVE and VIX indexes trend in opposite directions…
AND for somewhat MORE on the 60/40 portfolio, this reminder,
… So here’s the thing – we don’t know how risky the 60% slice of stocks is in the coming years. But we know, with a high probability that the 40% slice of bonds is becoming much more attractive. So yes, as Josh notes in his interview, these criticisms were more valid in 2020 when interest rates were at 0%. But in today’s environment the aggregated components of a 60/40 look much more attractive than they have in a very long time in large part because we know that the 40% slice is a lot more attractive than it has been in decades.
Finally, reiterating a couple charts from MS
US Equity Strategy: Liquidity Has Been Driving US Stocks US stock indexes have been resilient, which our US Equity Strategists attribute in part to many investors’ belief that the beginning of 2023 will mark the low point for earnings growth. But they highlight another factor that has been driving asset prices: Global liquidity. Using global M2 as a proxy, global liquidity has seen a major improvement since October 2022, when stocks bottomed globally. Further, because the S&P 500 is arguably the highest-quality and most liquid risk asset in the world, our team argues that liquidity has been the most meaningful driver of that index’s higher, more stable price action. Given Morgan Stanley’s house view that credit availability will tighten, they believe M2 growth in the US, which is already slowing, could fall further.


😀
Did Professor Siegel update his Seasonality Algorithm for Climate Change?
"Sell in early April, and go away, and never come back ...?"