(belly BID on strong volumes)while WE slept; bullish belly; holiday spending; "...the outlook for bonds seems likely to improve faster than for equities..."
thebondbeat.substack.com
(belly BID on strong volumes)while WE slept; bullish belly; holiday spending; "...the outlook for bonds seems likely to improve faster than for equities..."
(belly BID on strong volumes)while WE slept; bullish belly; holiday spending; "...the outlook for bonds seems likely to improve faster than for equities..."
With BAD in mind, central planners — and The Fed’s #2 specifically — watchin’ …
Brainard says “I think it will probably be appropriate soon to move to a slower pace of rate increases” and “We are highly cognisant that in a world where many central banks in large jurisdictions are tightening at the same time, that is greater than the sum of its parts”.
… here is a snapshot OF USTs as of 701a:
… HEREis what another shop says be behind the price action overnight…
… WHILE YOU SLEPT Treasuries have been led higher by the belly overnight after weak Chinese data (IP, retail sales) and on emerging optimism that the Fed will step-down their rate hikes from 75's. DXY is lower (-0.6%) while front WTI futures are too (-0.6%, see attachments). Asian stocks were paced higher by China-linked Tech names (Hang Seng China Ent +4.84%), EU and Uk share markets are mixed while ES futures are showing +0.65% here at 6:45am. Our overnight US rates flows saw a tight range during Asian hours with real$ names buying intermediates while selling the long-end. Prices did find a bid into the London open despite two TY block futures sales earlier. And during London hours the desk noted still-solid demand for front end paper- perhaps on hope that intervention-related selling in the sector is a risk now behind us. The desk also noted resilient end-user demand for the long-end too. Overnight Treasury volume was ~120% of average overall.
… The daily chart of Treasury 5yrs looks bullish still with a return to local resistance (early October rate low) near 3.765% appearing likely in the days and few weeks ahead. Note too how 5's broke their multi-month bear trend at the end of October, revisited that trend from below earlier this month before finally making yield tracks southbound.
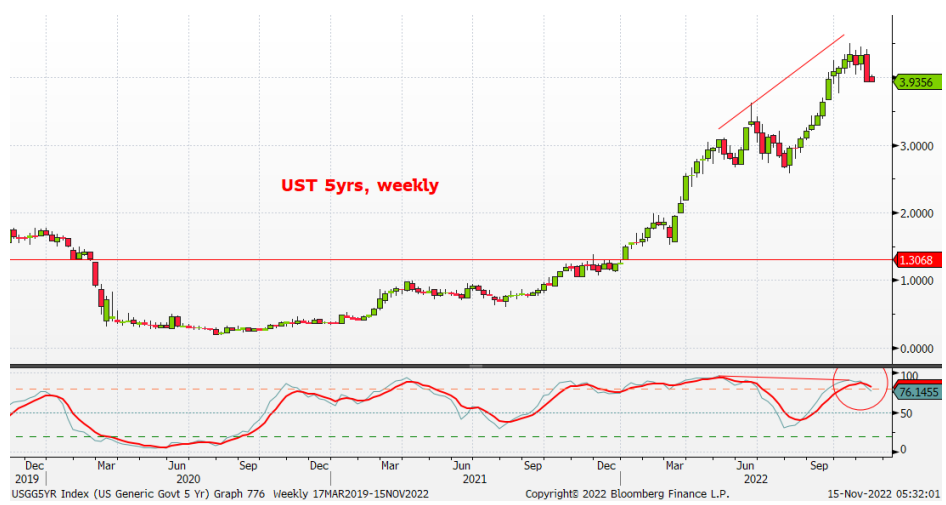
More importantly, the weekly chart of 5yrs is shown next and last week a new, medium-term bull momentum signal was confirmed at the week-end close. What's key here is the bullish divergence (drawn in) that has now been confirmed as higher highs in yields since the spring have come with lower highs in the deeply oversold weekly momentum study (lower panel). Set-ups like this are typical at trend turning points and the idea is that a complete reversal of the last uptrend (ever-weakening, internally, and in place since early August) in 5y rates could be completely corrected. If true, a return to the ~2.70% trend starting point is a legitimate risk now for the few months ahead. At least that's what prices and their associated momentum now warn.
Wrapping a bow on this is the monthly chart of Treasury 5's that we show next. Long-term momentum (lower panel) has been deep in 'oversold' readings for much of this year with the set-up very similar to the same months witnessed in 2018. Meanwhile, 5yrs have been trying to press into their 2006-2007 range (roughly 4.37% up to 5.23%) but generally respecting support from that range floor this month and last. If the signal in the weekly chart is a valid one, and 5yr yields make sustained tracks lower, as intimated, then long-term momentum is quite likely to flip to a new, long-term bull phase this month or maybe next. In essence, Treasury 5yrs look totally 'sold-out' right now based on simple price momentum work. Thus, our bullish bias….
… Updating the technical grid below, we were reminded that we cited the key resistance near 4.05% in Treasury 30yrs yesterday- the confluence of recent rate range lows and a well-defined bear trend in place since early August. That resistance was just closed through yesterday and 30yrs have extended their breakout gains overnight. We'd spot next-resistance in the 3.82%-3.85% area, from the looks of things. The 30y benchmark was also the last of its peers to break its multi-month bear trendline...
… and for some MORE of the news you can use » IGMs Press Picks for today (15 NOV) to help weed thru the noise (some of which can be found over here at Finviz).
In as far as a few items of interest from the Global Wall St inbox,
Our US cards data suggest a solid October retail sales report, with support across a broad range of categories, including notable strength in those that the control group excludes. The implied 1.1% m/m headline gain (0.7% control group) is just shy of consensus and Barclays Economics' expectation for a 1.4% gain.
Charts that caught MS brass’s eyes,
(1) Cross-Asset Strategy: The current environment is among the most attractive we’ve seen for “income” assets.
…(3) Consumer: Our AlphaWise holiday spending survey is bearish for retail and electronics, and bullish for Airlines.
Fed officials largely reiterated Chair Powell’s message from the November FOMC press conference, shifting the emphasis from the pace of rate hikes toward the destination for the fed funds rate. That said, not all policymakers appeared to agree with Chair Powell’s assertion that the terminal rate may be higher than what officials had penciled in at the September SEP – notably, Vice Chair Brainard. However, all policymakers made clear that the decision to downshift to a slower pace of tightening was in no way a signal that the Fed was finished with its tightening campaign on the cusp of pausing – the data will determine when they will stop. With respect to slowing the pace “at upcoming meetings”, Vice Chair Brainard, Dallas Fed President Logan and Chicago Fed President Evans appear to support slowing the pace “soon”, signaling a step-down to 50bp move in December. Governor Waller commented that he is looking at the potential to downshift at next meeting. Richmond Fed President Barkin, Philadelphia President Harker, Boston Fed President Collins and KC Fed President George noted the benefits from the deliberate and more measured rate increments and advocated the downshift at upcoming meetings. That said, with inflation still staying at a very elevated level and upside risks alive, all of them stressed that there is still “ways to go” and ongoing rate increases are necessary, and it is “very premature” to consider pausing. In our view, some softening in the October spot inflation data should allow the Fed to follow through on their recent signals and downshift to a 50bp rate hike in December, consistent with the Fed communications across hawk-dove spectrum. We also maintain our view of a 4.9% terminal rate, which will be delivered via 25bp rate hikes in February and March (See October CPI recap: Downside miss sets course for Dec Fed downshift).
Finally with hopes and visions of PEAK FLATION capturing the hearts and minds of everyone, everywhere, 1stBOS notes
October US CPI data virtually confirm that US inflation has peaked; headline almost certainly at 9.1%yoy in June and now core at 6.6%yoy in September. We expect inflation to continue moderating, but expect core to still be above 4% at mid-2023 and at just over 3% in December next year.
Bond and equity returns have historically improved following peaks in inflation. The median quarterly return to US 10yr Treasuries rose from -0.8%qoq during periods of high and rising inflation to +2.1%qoq during periods of high and falling inflation. Median equity returns shifted from +0.3%qoq to +2.2%qoq, respectively.
The 1980 inflation peak is a key exception, in part because the Fed pushed interest rates higher for some time after the peak. Sound familiar? We expect the Fed to hike 50bps in December and then another 50bps in Q1 2023. To be sure, in the wake of October CPI data surprising to the downside, senior Fed speakers continued to guide markets to expect more hikes.
Yet, the outlook for bonds seems likely to improve faster than for equities. If the next couple of inflation prints show a continued deceleration, then markets should gain confidence that Fed Funds will peak at about 5%. This should allow rates volatility to fall and skew to shift toward eventual cuts, with commensurate benefits for cash yields.
The US inflation picture also now looks attractive relative to Europe and Japan. US inflation has peaked sooner; its inflation breadth is now falling, whereas it is rising in Europe and Japan; and the US core inflation premium to G7 core inflation is closing. These factors may skew flows toward US rates markets.
The equity outlook remains more challenged in our view. Although equities should benefit from reduced interest rate volatility, slowing nominal GDP growth implies slowing revenue growth while labor cost growth appears sticky and financing costs are still rising. Crucially, given that the Fed is likely to continue hiking into Q1 next year, the recession risk that comes from the lagged effect of monetary tightening is likely to remain high or rise well into 2023.