(avg volumes as USTs dragged lower by BUNDS after Spanish 'flation) while WE slept; pension FUNDed status = UST demand?
Good morning …
BP cuts long-term forecast for oil and gas demand and, as ZH notes (and is not alone) markets reacting MORE to hot ‘flation from Spain
ZH: Broad based hawkish reaction seen following hot Spanish CPI - Newsquawk US Market Open
… here is a snapshot OF USTs as of 706a:
… HERE is what another shop says be behind the price action overnight…
… WHILE YOU SLEPT
Treasuries have been dragged lower by the underperforming German bund market after Spain's January inflation rate surprised to the upside this morning. A slight downside miss in German Q4 GDP (-0.2% QoQ) seemed to have little impact. DXY is modestly lower (-0.2%) while front WTI futures are little changed. Asian stocks were little changed on balance, EU and UK share markets are lower (SX5E -1.2%) and ES futures are showing -1% here at 6:30am. Our overnight US rates flows saw a pick-up in activity during Asian hours with Lunar New Year now over. Treasuries had a bid for much of the Asian session (real$ buying seen across the curve) until prices reversed lower during London's AM hours on the back of Spain's HICP inflation beat. We should note that Belgium's January CPI just printed 8.05% YoY, down from 10.35% YoY in December- BBG. Overnight Treasury volume was about average overall with relatively high average turnover seen in 2's and 3's overnight (~165% of ave each).… Our first attachment this morning picks on the daily chart of 5yr Treasury yields where daily momentum (lower panel) aims higher for rates after the run-up in prices during the first half of this month. All duration charts from 1y1y rate out to 30yr bonds look like this right now.
… and for some MORE of the news you can use » IGMs Press Picks for today (30 JAN — and STILL SPORTING THAT NEW LOOK!!) to help weed thru the noise (some of which can be found over here at Finviz).
From some of the news to some VIEWS you might be able to use. Global Wall St SAYS:
Morgan Stanley (via ZH): You Can Stop Worrying About Wage Inflation
Both headline and core inflation in the US have peaked and are falling. But with a tight labor market and wage inflation still elevated, the story goes, inflation’s descent could stall, and we are likely to see sticky, high inflation. The story is intuitive, because labor is roughly 60% of total value added in the US and therefore should be key to production costs. This inflation fear is a common concern among clients, but here are some thoughts to put things in perspective.
… There are several reasons why we do not worry about this particular mechanism, illustrated by the charts below. First, the lion’s share of the acceleration in other services was in transportation. Other services inflation went from about 1%Y in January 2021 to roughly 6%Y in December 2022, and roughly 4 percentage points of the increase is explained by transportation. Within transportation, airline fares are the key component, but the recent surge in airline fares was more a function of fuel prices and pent-up demand for travel amid capacity restrictions … not a rise in wages. Moreover, nominal wage acceleration has been widespread across services industries, but only transportation CPI inflation has increased. Indeed, because wage inflation has been generally lower than price inflation, real wage growth has been negative, pointing away from a cost-push story. Taking a longer-run view, over the past 35 years, the consumer price inflation we have now is unknown, but the peak in wage inflation is not particularly exceptional.
… But as I said at the start, few things can be predicted with precision, and other services inflation has been particularly hard to predict recently. We might be wrong, but all the information at hand simply points to a low probability that current wage inflation is a critical issue – even within services.
It would appear Barclays is also sticking with this ‘theme’ noting CBs are,
Far from finished
Core G10 central banks that are meeting this week — the Fed, BoE and ECB — are likely to stay on a tightening course
In as far as whatever this may mean for ‘markets’, one can begin to insert whichever narrative one wants. The latest from MSs stock-jockey-in-chief asking,
Are Month-End and the Fed the 1-2 Knock-Out Punch?
With 2023 off to a surprisingly good start for stocks, investors look for a new narrative to justify it. While there have been several positive developments, we think the good news is now priced, and reality is likely to return with month-end and the Fed's resolve to tame inflation.…In our current situation, we have slowing growth and a Fed that is still tightening. As we have noted since October, we agree the Fed is likely to pause its rate hikes soon, but they are still doing $95B a month of quantitative tightening,and are potentially far from cutting rates. This is a different set-up in these respects from January 2001 and 2019, and arguably much worse for stocks. A Fed pause is undoubtedly worth some lift to stocks but once again we want to remind readers that both bonds and stocks have rallied already on that conclusion. That was the call in October,not today.Finally, let's not forget the help on the liquidity front we got last fall—another reason we turned bullish in October was this injection of liquidity from both the Treasury General Account (TGA) and the draining of the Strategic Petroleum Reserve (SPR). Our QDS team has highlighted the relationship between the aggregate liquidity backdrop and the S&P, which is now showing the first major divergence in a while (Exhibit 2). As for the SPR, it's more likely these reserves are re-filled with oil prices now ~$80, particularly given still unsettled geopolitical tensions.
Granted this particular measure illustrated above does not include effects of a weaker dollar or the BOJ's recent efforts to defend the Yen and JGB market. Both of these positive effects cannot be ignored although one must admit the move in the dollar has been extreme and almostunprecedented in terms of the speed. Therefore, it too may be old news and/or priced…
And for somewhat more economically speaking, EPB Macros weekly macro update,
… Here are the most important themes from this past week’s economic data and market action. (Jan. 22nd - 28th)
Baring revisions, the economy has likely descended into recession.
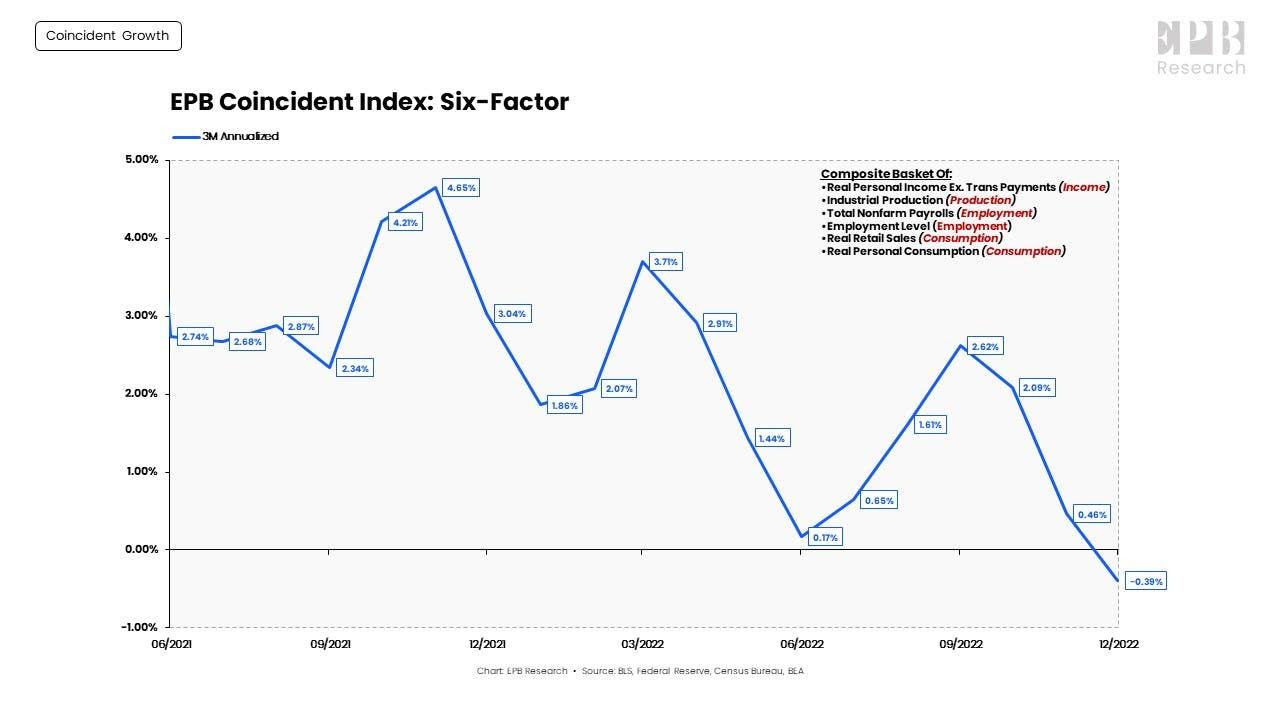
Aggregate coincident data peaked in October and has contracted on a 3-month basis.
Inflation is also cooling. The collapse in nominal growth is dramatically under appreciated.
The cyclical engine of economic growth continues to contract which means more downside for the broader economy is ahead.
Chart of the Week
The momentum of the economy over the last three months is very striking, which is why it appears the economy has descended into recession already while many market participants are still looking toward the back half of 2023.
On a 3-month basis, the coincident index is now contracting.
So real growth, defined by the six NBER indicators, is negative.
The contraction must persist for an official recession, but it's clear that growth has saw-toothed lower from late 2021 and through 2022. The economy is now on the verge of contraction based on our six-factor composite index of real personal income, industrial production, employment, and consumer spending.
Dr EDs latest ‘MARKET CALL’
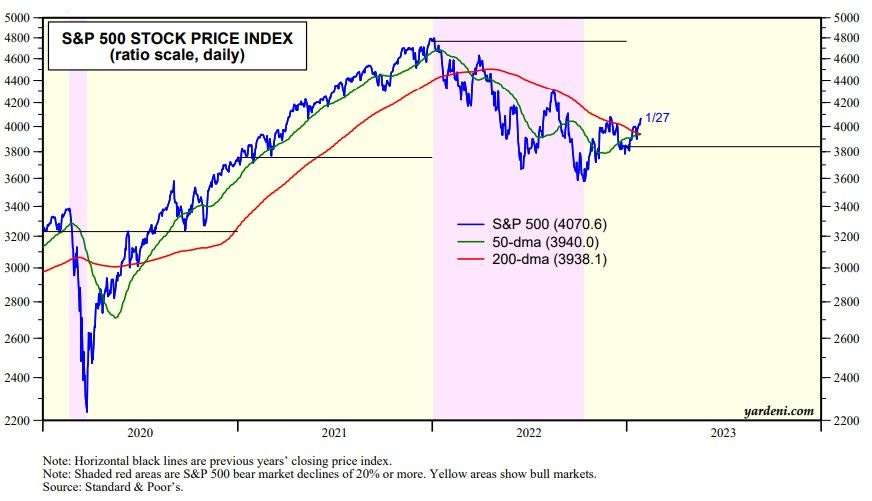
… The S&P 500 has risen above its 200-day moving average in recent days. This is the fifth attempt by the index to rise above this average since early 2022 (chart). It might fail like the previous four attempts if Fed Chair Powell's presser on Wednesday is much more hawkish (again) than widely expected.
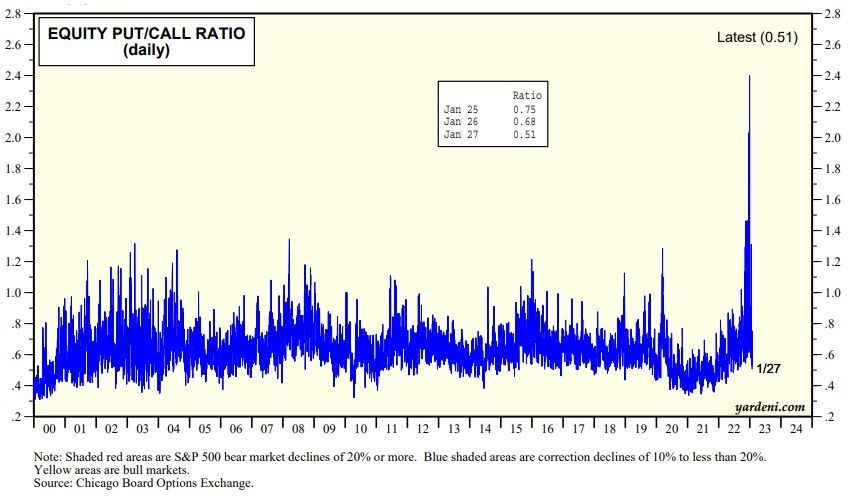
Sentiment may be too bullish as Feshbach suggests. The put/call ratio fell to 0.51 on Friday (chart).
Nevertheless, we still think that the bear market ended on October 12 of last year and that the S&P 500 will rise above last year's close this year.
Dr. EDs Week AHEAD: The Economic Week Ahead, Jan. 30 - Feb. 3 and finally, from BBG,
… Global bonds are on the verge of their best January since at least 1990, and the good times may be set to get even better. US corporate-defined benefit plans are sitting on their biggest surplus for two decades and that means they may be set to spend as much as $1 trillion on fixed-income assets that will allow them to lock in the returns that they need for the coming years.
Such a wave of buying could drive yields down significantly from here, even as it muddies the waters for those looking to US Treasuries and other government bonds as a guide to the economic outlook. It would also threaten to wipe out any impact from the Federal Reserve’s quantitative tightening, which has so far shrunk the central bank’s balance sheet by $494 billion. While that raises concerns in the medium term as to where yields may go once this wave of buying passes, the immediate future looks bright for bonds. The news is less pleasing for equities, seeing as pensions will be switching away from them in this scenario.
Just a few items to start the day and week as you plan your trades and TRADE your plans … THAT is all for now. Off to the day job…


