Good morning … especially for Team Rate CUT (and others long of USTs) Treasury borrowing release …
ZH: US Treasury Unexpectedly Reports Sharp Drop In Debt Borrowing Needs, Rates Slide
… What we didn't say, because we didn't know it (and neither did anyone else), is what the Treasury reported as an endnote to its borrowing needs paragraph, namely that "the current quarter borrowing estimate is $53 billion lower than announced in February" which indicates that DOGE is indeed working and the US funding needs are actually declining …
… Finally, looking at the historical data, during calendar Q1 which ended March 31, 2025 quarter, the treasury borrowed $369 billion in privately-held net marketable debt and ended the quarter with a cash balance of $406 billion. In February 2025, Treasury estimated borrowing of $815 billion and assumed an end-of-March cash balance of $850 billion. The $446 billion difference in privately-held net market borrowing resulted primarily from the lower end-of-quarter cash balance. However, excluding the lower than assumed end-of-quarter cash balance, actual borrowing was $2 billion lower than announced in February.
In other words, DOGE is working: in Q1, US debt funding needs were $2BN less than the Treasury forecast in February, and in Q2 the Treasury is expected to need $53 billion less than it forecast 3 months ago.
This unexpected drop in pro forma debt issuance (because one way or another, the debt ceiling constraint will go away), may be the reason why yields have been sliding all day, and at 4.21% are at session lows …
… sucks, on the other hand, for all those selling short the ‘40’ of 60/40 and fading usefulness of USTs in portfolio construct?
Good morning … if yer an AUTO MAKER …
April 29, 20253:40 AM EDT Reuters: Trump to reduce impact of auto tariffs, commerce secretary says
Lutnick touts "deal" to help domestic manufacturers
Duties on foreign parts to be reduced
Auto companies appealed to Trump
… AND … just good morning. I’m going to take a step back and gazing at bigger picture(s) for a moment … here’s a monthly and a weekly (LINE) graph for your consideration …
… until it bends … momentum on longer-term (MONTHLY) basis continues to careen towards overBOUGHT but not yet there … can 2s hit (down)TLINE sub 2.50%? I suppose so, esp with rate cuts … NOT a base case :)
… otherwise known as the “X” that marks the spot … momentum here offering NO signal (so, more noise) and i’ll continue to lean on / watch psychologically important round numbers …
Once again, this all likely hinges on … rate CUTS and USD (and ensuing flows) as far as weather or not overseas investors believe in the US and our dollar dominance. And so, rate CUTS related, on to some of the data with an economic impact, yesterday …
I believe the Dallas Fed Mfg survey didn’t actually say this but …
ZH: "Please Lower Interest Rates" - Texas Manufacturing Survey Collapses, Respondents Decry "Chaos At The Federal Level"
… And finally, one respondents reached out to The Fed directly for relief:
"Please lower interest rates. We need it in order to boost the economy due to the uncertainty and tariffs."
"There is too much uncertainty, including a possible recession. Interest rates are too high. The Federal Reserve always seems to be late for their own party."
Interestingly, these responses were receiuved AFTER the 'pause' on reciprocal tariffs were announced (and stocks rebounded from post-Liberation Day lows).
… um, OKIE DOKIE, then … they actually DID say that … I stand corrected.
I’ll show myself out … but first … here is a snapshot OF USTs as of 705a:
… Same shop with an overnight word or two AND a visual for consideration ahead of Conference Bd data …
…While You Slept Treasuries are modestly bear-flattening, with the 5y point leading underperformance. With Japan closed for holiday, futures traded lightly during the Asia session, while the London open saw selling in 10s from real$ clients. Into the US handoff, the desk reported a general steepening bias returning (2s30s +1.5bps), with thematic steepening interest from fast$ (mainly in 5s30s, 10s30s). Volumes are 80% of the recent average, with S&P futures showing -3pts here at 7am, Crude -1.5%, Gold -1%, and DXY +0.3%.
…JOLTS, Conference Board & Curve - We’re not expecting a major dislocation in stale March Job Opening and Turnover data, with Citi Economics expecting a nearly unchanged 7580k (vs 7568k prior) print. Still, the ‘actions items’ in the form of hiring, quits and layoffs will remain the least-noise-y of the components, with our team expecting a sharper deceleration in the first two items by May-June updates. In the Conference Board suite of indicators, while a further headline decline to 87.1 (Citi’s estimate) from 92.9 will keep the ‘soft data’ recession theme intact. we will be paying more attention to the labor market differential, which could decline further towards the SEPT ’24 lows as the labor market starts to re-soften. Lastly, we’ll be at least intellectually curious to see how the continued divergence in the Expectations - Present Situation spread vs the US 2s10s curve works out, with the curve ‘outperforming’ the traditional leading indicator (perhaps indicating more ‘recession premia’ than anything).
… for somewhat MORE of the news you might be able to use … a few more curated links for your dining and dancing pleasure …
NEWSQUAWK US Market Open: US equity futures & USD modestly firmer with focus on reports of Trump easing auto tariff impact, Canada’s Liberals win election … Fixed benchmarks are relatively contained into a packed US session … A contained start for fixed income given the Japanese holiday (Showa Day) overnight, meaning that there was no cash trade. USTs currently at the lower-end of a very thin 111-22 to 111-30 band and one that is within Monday’s 111-10 to 111-31 confines. Focus ahead is on, US Consumer Confidence, Advance Goods Trade and JOLTS Job Openings.
Finviz (for everything else I might have overlooked …)
Moving from some of the news to some of THE VIEWS you might be able to use… here’s some of what Global Wall St is sayin’ …
This first note offers an alternative view and one that isn’t so bearish / recessionary (yet) …
28 April 2025 Barclays: Alternative Data View: High-frequency alt data: no red flags (yet)
Daily credit card transaction and job openings data thus far show little cause for concern about US activity. The most recent momentum in spending and new job postings is about in line with – and never far below – point-in-time comparisons with prior years.
We look at signals from alternative data sources—US Barclays credit card spending and LightCast job openings data – for additional reference points on US activity. We do not find red flags in either of these sources – at least, not yet. We will continue to monitor these high-frequency data series for potential cracks appearing.
Our key takeaways are:
Mid-April credit card spending data show that in nearly all retail sales categories, 2025 spend growth matches or exceeds the point-in-time spend growth average from previous years;
The latest card data show possible front-loading of spending in anticipation of tariff-induced price hikes continuing in a few categories like autos (Figure 1). Consumer spending on eating out is oftentimes taken as a barometer of consumption strength, and recent restaurant spending does not portray much, if any, consumer weakness;
We believe our approach to comparing momentum in credit card spending with previous years would indeed flag if an inflection point in consumption occurs, given, among other factors, our cards' data correlation with retail sales, strong March retail sales numbers that were consistent with same-period card spending momentum, and with similarly lagging card spending momentum during the COVID pandemic;
In daily job openings, aggregated at the industry level, we do not (yet) observe worrisome drops. For most industries, 4w new job openings are down from the previous 4 weeks, but this is in line with seasonal trends. Moreover, for the majority of industries this year's downtrend is less severe than that of 2023 and 2024, implying new job opening momentum that actually seems relatively strong.
Figure 1. Latest 4w spend growth in 2025 is on par with or better than the point-in-time growth average of previous years for nearly all retail sales categories, and shows front-loading of spending for some (eg, cars)
Not lookin’ good … flows into USD assets, that is …
Is it possible to track this thesis in real-time? Official balance of payments data are heavily delayed and often distorted by valuation effects. Here, we propose two alternative measures of tracking US inflows that are as close to real-time as one can get. Our conclusion from both metrics does not look pretty: there has been a sharp stop of foreign investor inflow into US bond and equity markets over the last two months. What is more, despite a recent softening of US trade policy, there are few signs that capital inflows are returning at the time of writing.
ETF data. We have collected data on close to 400 large ETFs that invest in US equity and fixed-income markets. The key filtering criterion we apply is that the ETF has to be domiciled outside of the US. This allows us to distinguish between domestic (US-based) buyers and foreigners. The vast majority of these ETFs are located in Europe. As an example of what this data covers, if a European retail investor wants to buy US equities, they would typically purchase a euro-denominated ETF domiciled in either Luxembourg or Ireland that subsequently converts the cash to USD and invests in the S&P 500 or other index. We can track flows by calculating the nominal value of the net change in the shares outstanding of all these ETFs on a daily basis. As the figures show, there has been persistent selling of US equities and bonds by foreigners over the last two months. Equity selling peaked during the week of the tariff announcements but has remained negative since then (Figure 1). Fixed-income selling started earlier in March and has also persisted (Figure 2).
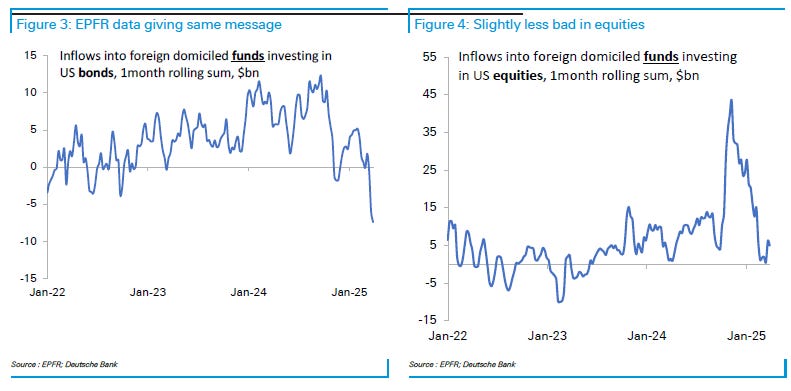
EPFR data. This data tracks the same flow but across a wider range of funds - passive and active, closed and open-ended. It is available weekly and is a useful cross-check to our high-frequency (daily, one-day lag) ETF data. The message is slightly different here, with an abrupt end to buying in equities (but no selling, Figure 3), but more aggressive selling in bonds (Figure 4). The difference is likely reflecting the different investor universe in this data set, including more funds outside of Europe, as well as a likely slower-moving investor base.
Our broad takeaway is that the flow evidence so far points to an, at best, very rapid slowing in US capital inflows and, at worst, continued active disinvestment from US assets. Either interpretation we think poses a challenge to the USD as a twin deficit currency. Importantly, our daily ETF data show persistent bond and equity outflows last week despite the recovery in US asset prices.
As a final observation, it is important to remember that our analysis does not attempt to provide an overall flow picture for US assets but merely foreign activity. For every seller of an asset there will always be a buyer. What we think matters for the USD is what foreign investors are doing and, so far, based on our analysis the evidence is that they remain on a buyers' strike on US assets. We will continue to track these flows closely in coming months.
… maybe reason things aren’t lookin’ good is dislocations here …
29 April 2025 DB: Mapping Markets: What are the biggest market dislocations? April 2025
Markets often behave inconsistently, with patterns that don't make obvious sense across asset classes. This got us thinking about where some of the biggest dislocations are today, considering what looks odd, and therefore what might be ripe for a correction.
Several sprung to mind over the last month. For instance, investors have simultaneously priced in more Fed rate cuts and higher US inflation - a combination at odds with the Fed’s reaction function in 2022, as well as Chair Powell’s recent comments. Meanwhile in Europe, 10yr bund yields have almost completely unwound their moves after the shock fiscal announcement in early March, which is striking given the magnitude of what's been proposed. Both these dislocations speak to a broader issue, which is that front-end yields are pricing a much stronger chance of a slowdown compared to risk assets.
Elsewhere, we look at the breakdown between the 10yr UST-bund spread and EUR/USD, and also note how German assets have outperformed others in Europe since Liberation Day, despite Germany's economy being one of the most exposed to the tariff shock
So what are some of the biggest market dislocations right now?
1. Over the last month, investors have priced in more rate cuts from the Fed, alongside much higher inflation. This combination is at odds with the Fed’s reaction function in 2022, as well as Chair Powell’s recent comments.
…3. The first two points fit into a broader dislocation, which is that front-end yields are pricing a much stronger chance of a slowdown compared to risk assets.
After tactically closing our directionally bullish call on European equities ahead of “Liberation Day” in late March, we now turn back bullish on European equities. We had called for peak fear on April 7, and the start of a de-escalation on tariffs on April 9. Both materialized and the situation continued to improve since. The tonality on tariffs softened, sentiment indicators surprised positively, hopes for a ceasefire have re-emerged, earnings revisions were sharply down and now leave room for positive surprises and there is “no intention to fire” Fed Chair Powell any longer. Furthermore, European and especially German politics continue to be more market-friendly.
It took a 19% drop from peak to trough in the S&P 500 and a sharp sell-off in Treasuries to trigger the “Trump Put” this time, but it worked. Although “the put” is likely back out of the money after the positive market reaction, approval rates are still falling and should keep the strike rather close…
‘bout that money supply …
April 28, 2025 First Trust: Don’t Watch “Cash on the Sidelines”
As we have written…The Era of Easy Everything is ending. Part of this involves bringing inflation back to the Federal Reserve’s target of 2.0%. We could debate that number, but the Fed is getting closer…
…The M2 money supply has nearly tripled since 2008. Yes, people have multiple bank accounts, and, yes, some people have more cash than others. But if the M2 money supply has tripled, that means, all else equal, the average checking account tripled as well. In other words, if we adjusted for this increase in M2, deposit insurance levels should be $750,000.
That’s how much money the Fed has created!! In just the past 18 years. We look at this as a negative, but others talk about “cash on the sidelines” that could lift stock prices.
The basic problem with this theory is that it treats the stock market as if it were some sort of sinkhole for liquid funds, which it is not. The theory is that if investors or potential investors have big fat bank deposits or money market accounts, they could put these funds into stocks, which would send equity prices higher.
But if one investor decides to draw down their bank deposits or money market funds to buy stocks, the person whose shares they buy will end up with fewer shares but more money in bank deposits and money market funds. On net, the amount of cash on the sidelines doesn’t change.
Does this mean that cash on the sidelines is completely irrelevant? Not really…Cash on the sidelines has been rising since 1913.
Yes, US stocks are down from their peak earlier this year. But equities are still modestly overvalued and can go down further in spite of all that “cash on the sidelines.”
A brief recap of yest …
April 28, 2025 MS: Global Macro Commentary: April 28
USTs bull-steepen after soft Dallas Fed Manufacturing data; GBP gains amid reports of an EU-UK-agreement; Canadian election ahead; ECB's Rehn sees downside risks to inflation; Bunds bear-steepen as equities advance; CLP underperforms; DXY at 98.93 (-0.5%); US 10y at 4.208% (-2.7bp)
USTs bull-steepen (2y: -7bp) absent specific catalysts, with the move accelerating after the Dallas Fed Manufacturing Survey falls ~20 points to -35.8, reaching the lowest level since May 2020…
More on USD stature in global macro context …
April 28, 2025 MS: Global Macro Forum: USD’s Changing Role in Global Markets
Recent market moves have seen USD and USD-denominated assets underperform other global assets, and an observation that “DM is trading like EM”. We explore how the theme is playing out across assets in terms of relative returns and correlations, and debate which steps – if any – can reverse this phenomenon.
Challenges to long-held cross-asset correlations – US equities versus FX: The correlations between US equities and FX are nearly two standard deviations above their average over the last five years, with USD weakening as equities have sold off – a pattern more associated with emerging than developed markets.
The safe-haven question: Consistent outperformance of growth as well as higher yields in the US relative to other DMs along with policymaking that has been consistent if not infallible, with clear lines of demarcation between the executive branch and the central bank, have driven capital flows to the US, both during periods of stability as well as stress. That growth differential advantage may no longer hold – the positive growth differential the US enjoyed versus the euro area may disappear in 2025 and turn negative in 2026. However, the quantity of global safe-haven assets excluding US Treasuries has declined meaningfully in the last 15 years. While alternatives such as government bonds in select European countries are potential candidates, their scale, size, depth, and liquidity are meaningfully lower.
US equities: S&P 500 priced in a recessionary PMI reading for April. There has been a significant pick-up in the mentions of “tariffs” and “uncertainty” in 1Q earnings calls, implying a higher risk of recession/layoffs. The weak USD is a positive for relative US earnings and stocks.
We remain bearish on USD: In recent weeks, policy uncertainty in the US has weighed on the US stock market, long-end US Treasury yields, and the US dollar. As a result of these moves, USD has been positively correlated to US equities and bond prices, which has diminished its attractiveness as a portfolio diversifier. Furthermore, there is ample room for additional USD-hedging flows. USD now trades at a roughly 4% discount to where its previous relationship to yields would have implied, representing a negative risk premium that can expand if policy uncertainty and the aforementioned positive correlation remain.
Everyone’s got a right to an opinion … even this guy … a Brit weighing in on DJT as if …
29 Apr 2025 UBS (Donovan): 100 days of uncertainty
US President Trump is to mark their 100th day in office with a partial retreat on auto-part trade taxes, and a speech. The speech risks further erratic policy pronouncements—Trump declared very negative approval ratings to be “fake news”, but may want to blame external forces for their poll performance. That might lead to policy pronouncements on immigration, trade, or some other economically significant issue. Uncertainty about such policy shifts has economic consequences.
Canadian Prime Minister Carney is expected to remain in government after yesterday’s elections, although it is not clear whether the Liberals will have an absolute majority in parliament. Carney marked the victory with some politely hostile comments aimed at the US administration…
…US March wholesale and retail inventories are due. These reflect the before times, but will be closely watched for evidence of stockpiling ahead of the aggressive trade tax increases. The more inventory was built up before tariffs, the longer the economic damage of tariffs can be delayed.
AND a flashlight in the FOMC darkness …
April 29, 2025 Wells Fargo: May Flashlight for the FOMC Blackout Period Waiting for the Fog to Lift
Summary
We expect the FOMC will leave its target range for the federal funds rate unchanged at 4.25-4.50% at its upcoming meeting on May 6-7, a view widely shared by financial markets and economists. Market pricing currently implies only a 9% probability of the FOMC cutting the fed funds rate by 25 bps.
Since the FOMC concluded its last policy meeting on March 19, the Trump administration has announced unprecedented changes to trade policy. While some of these plans have been temporarily paused, tariffs remain significantly higher than what was generally anticipated prior to the April 2 "Liberation Day" announcement. After severe turmoil in financial markets initially following the announcement, markets have calmed somewhat, but financial conditions remain tighter than when the FOMC gathered nearly six weeks ago.
"Soft" survey data on consumer and business sentiment have also weakened sharply over the past six weeks. Yet, "hard" economic data have remained in good shape. Steady initial jobless claims point to the labor market maintaining its footing, while the year-over-year rate of core PCE inflation is on track to ease to a four-year low of 2.6% when data for March print on April 30.
Public comments by Fed officials during the inter-meeting period have emphasized the uncertainty that hangs over the outlook as a result of the changing trade environment. Higher tariffs present a tricky challenge for the Committee, as they threaten to both weaken the labor market and raise prices. There seems to be broad consensus on the Committee that the current monetary policy setting is well positioned to respond to changes in the outlook that threaten either side of the dual mandate.
Our current forecast looks for the FOMC to reduce the federal funds rate by 125 bps this year, starting with the June meeting. Some dialing back in the U.S. posture on tariffs, the relatively benign run of recent "hard" data and the patient comments from key Fed officials in recent weeks lead us to believe the risks are skewed toward the first rate cut occurring later than the June meeting. That said, with monetary policy still somewhat restrictive and weaker economic growth expected to weigh on the labor market in the months ahead, we still think the FOMC will reduce the federal funds rate this year by more than the 50 bps implied by the median projection in the March meeting's summary of economic projections.
Finally …
Apr 28, 2025 Yardeni: Bonds Are Stirred, Not Shaken
The S&P 500 is down roughly 10% from its record high on February 19. Considering Trump's Tariff Turmoil (TTT), that's not too bad. Also recall all the angst unleashed when the 10-year US Treasury bond yield spiked from 4.00% to 4.50% right after President Donald Trump announced his "Liberation Day" reciprocal tariffs. Now it is back down to 4.20% (chart).The stock and bond markets may be getting support from expectations that the Fed may ease soon.
Federal funds rate (FFR) futures show that tariff-related growth fears are real, and the Fed will likely look through tariff-related price increases and cut the FFR. Futures suggest that the FFR will be cut from 4.33% to 3.50% by year-end, and continue to be cut through the first half of next year down close to 3.0% (chart).
… And from the Global Wall Street inbox TO the intertubes, a few curated links …
An NFP precap …
April 29, 2025 Apollo: The Employment Report on Friday
The employment report for April will come out on Friday, May 2, and some leading indicators suggest we could see a dramatic weakening in the labor market over the coming months.
Importantly, the survey week for the employment report was the week after Liberation Day tariffs were announced. In other words, the establishment survey and the household survey were carried out during a week with extreme levels of uncertainty for businesses.
The consensus expects 130K jobs created in April. There are significant risks the number is going to be lower, perhaps even negative, see chart below.
Once again, everyone has a right to an opinion and ALL are created equally … here’s a view of what we should REALLY worry ‘bout …
April 29, 2025 Bill Blain: Blain’s Morning Porridge April 29th 2025 – Enough about Trump. Worry about the real stuff; Treasuries and Innovation.
… Today we have a whole different set of risks to consider – not the least of which is the debt loads of highly indebted nations, and how uncertainty around these will impact markets. I have serious doubts on just how sustainable the USA’s debt load now is, given the policy decisions that have been taken by Washington which have seriously impacted the stability of the Treasury market.
Trump has shaken confidence in the USA’s virtuous sovereign trinity of a stable currency, a sustainable bond market, and political competency.
He’s alienated allies and competitors alike unnecessarily. His stress on America First policies makes it perfectly acceptable for other nations to abandon common purpose with the USA.
Attempts to stem the deficit through DOGE are cosmetic and likely to increase instability than enhance it.
Tax cuts are incompatible with addressing the debt load.
Over the coming years I expect to be writing an awful lot about the Treasury market in terms of what the potential end of the dollar-era means, what falling global investment into Treasuries means for rates on the economy, and how that then feeds into higher rates in company formation and growth in the economy.
The issue around the USA is not Donald Trump’s presidency, but whether the USA has the political competency (which has relevance to how effectively the tri-partite system of US governance: legislature, executive and judiciary, can deliver a working solution) over the coming decades to manage its debt, maintain the health of its economy and continue to exhibit the kind of exceptionalism that made it the most successful economy for decades.
Or has the US already past its peak, and the recent surprises in the tech markets, when new competitors from Asia have shown innovation is not a US monopoly, and that they can do stuff better and cheaper point towards a new, new world?
Out of time.. and back to finding a day job….
AND another VIEW …
April 29, 2025 at 5:00 AM UTC Bloomberg: Only in America — 100 Days of the Anti-Reagan How Trump 2.0 is stacking up against other presidents — and even Churchill.
… Mohi-Uddin adds that US investors could themselves drive future dollar weakness. “If US managers also start raising their foreign assets in response to this year’s shocks,” he says, “the USD will keep trending lower, too.”
Of late, the dollar’s problem is centered on individual foreign investors, many of whom are affronted by the Trump administration’s tactics. Saravelos shows below that flows into foreign-denominated exchange-traded funds holding US assets have been sharply negative (although in the case of equities this is largely a function of the extreme enthusiasm that followed Trump’s election):
There’s no sign of any recovery among foreigners in the last couple of weeks as the US stock market has rebounded. If the tariff climbdowns have buoyed confidence, it’s been at home, not abroad. EPFR’s data for foreign-domiciled US funds not traded on exchanges shows a broadly similar pattern, although the data do reflect a slight return of demand for equities in recent days:
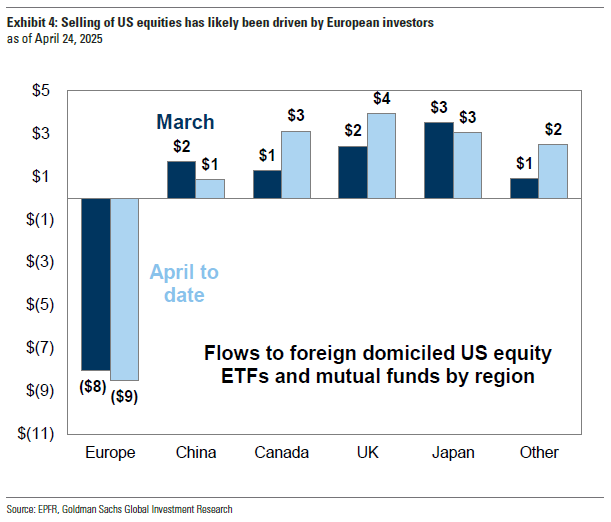
The selling has mostly come from Europeans. Goldman Sachs’ David Kostin offers this chart showing that they’ve staged a dramatic exit from US equities while other foreign investors have generally held on. These figures incorporate both mutual funds and ETFs:
That can be explained by the confluence of foreign policy and an overpowering need for economic balance…
Macro Institute dropped this visual yesterday morning after I hit send …
April 28, 2025 Macro Institute: Macro Monday - A Classic He Said Xi Said
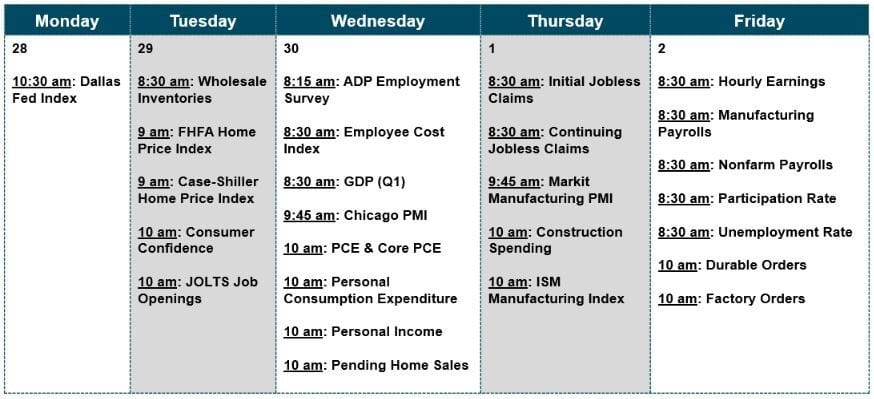
This week’s economic data is coming in hot, and it’s the underdogs stealing the spotlight. While April’s PMI on Thursday and Friday’s payrolls will occupy most of the headlines, don’t sleep on the other players in the lineup.
First up, Tuesday brings the JOLTS report. Normally this is not the most exciting series, but this update on job openings might have something interesting to say.
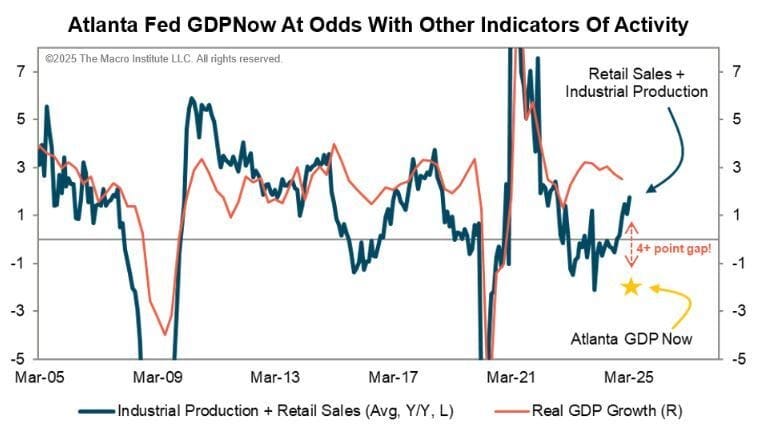
Then on Wednesday, we get Q1 GDP. Usually this is a nonevent given the data’s lag time and the fact that it’s already priced into the markets, but this time might be insightful. The Atlanta Fed's GDPNow estimate is sitting at a gloomy -2.5%, though that’s with a big asterisk (hello, gold adjustment).
Want a sneak peek? Averaging retail sales and industrial production provides us with a decent crystal ball, and it’s hinting that GDP might not be as dire as the market’s doom-and-gloom consensus expects.
So, keep your caffeine handy as Wednesday could be interesting…
…The Macro Week Ahead
A Classic He Said Xi Said
Equity market prices currently reflect a trading regime focused squarely on rumors and statements regarding tariff negotiation between President Trump and the U.S. and President Xi Jinping and China. Early last week, President Trump suggested progress was being made while representatives from China refuted that idea. Last week, Treasury Secretary Scott Bessent indicated that a deal between the two nations may take years to formalize. Then, Friday morning we learned that China might exempt some U.S. imports on medical equipment and industrial chemicals. Stocks fell into the close on Friday as President Trump said tariffs of 20-50% in a year from now would be deemed a “total victory” and import tariffs will not be dropped unless China offers something “substantial.” Despite the uncertainty, the S&P 500 increased 4.6% last week with the Technology and Discretionary sectors leading the charge up 8.1% and 6.6%, respectively. These were the hardest hit sectors following Liberation Day.


Yields back to where we were, prior to the panic....looking good......