Good morning … tariff reprieve or not. Weekend news being priced in as BULLISH for stonks. Narratives ALWAYS follow the price action and, well, why NOT have futures RAMP this morning … Last I checked, there are several rate CUTS still priced before years end (CME FedWatch HERE) and on that / them, a quick check in on the belly …
5yy DAILY: RANGE triangulating, narrowing w/4.25% supp and 4.01 res …
… and here we are nearly in the middle of the aforementioned RANGE with momentum shifting swiftly from overBOUGHT (sub 3.60) to now overSOLD and rolling over once again — short-term RENTAL? Why NOT bonds, too, everything ELSE is bid this morning …
… AND while this view is more short-term in nature, the vigil continues for HIMCOs longer term quarterly thoughts so I’ll just quit while I’m behind, here and now … here is a snapshot OF USTs as of 707a:
… HERE is what this shop says be behind the price action overnight…
… WHILE YOU SLEPT
… for somewhat MORE of the news you might be able to use … a few more curated links for your dining and dancing pleasure …
NEWSQUAWK US Market Open: Sentiment boosted by tariff exemptions, with NQ +1.7%, but USD extends losses … USTs are firmer but much more modest than has been the case in recent days. As it stands, USTs are rangebound just below the 110-00 mark and well within Friday’s 109-08 to 110-21 band. Focus this morning is, as usual, on tariffs. Risk sentiment has been supported by the announcement of some tariff exemptions for smartphones etc, however, Trump clarified this weekend that there are no exemptions with the measures just moved into different categories i.e. fentanyl.
In a world of such dramatic fundamental policy and economic disruptions, financial chart patterns and trends may seem a little beside the point. But some of these remain important for investment funds and strategists who rely on market momentum signals. One of the most basic is how the stock market is trading relative to its long-term 200-day moving average. The S&P500 fell below this on March 11 and has lost more than 500 points since then as the tariff war ensued. Another closely watched momentum signal is when the shorter-term 50-day average moves above or below the 200-day line. And it's now about to slice below it for the first time in more than a year, a move ominously dubbed a "Death Cross". The last time this happened in 2022, the S&P500 lost almost 1,000 points over the subsequent six months.
Yield Hunting Daily Note | April 11, 2025 | Rebound Fizzles, Cornerstone Rights, JQC Rights, PPI
Finviz (for everything else I might have overlooked …)
Moving from some of the news to some of THE VIEWS you might be able to use… here’s some of what Global Wall St is sayin’ …
THE Bank of the land …
11 April 2025 BAML: Global Rates Weekly The art of the repeal
The View: Treasury markets trigger Trump put Reciprocal tariffs are suspended. Data and central banks should move back into focus next week. We expect both the ECB and the Bank of Canada to cut rates. Retail sales provides another spot check on the health of the US consumer.
Rates: Bonds now beautiful US: Recommend 2s5s30s fly on delayed Fed cuts & supply/demand imbalance, re-set target on 30y spread short, favor short 1y inflation
… Duration = Fading recession likelihoods on tariffs suspension drove a mean reversion of yields back to fair / marginally cheap levels vs fundamentals (see Exhibit 4 and Monthly rates models: Apr ’25 edition). Wecontinue to favor trading US rates with soft long bias & targeting longs in 5y tenor. We recommend adding 5y exposure around 4.1-4.25% levels & lightening up at 3.75% levels (consistent with the market pricing a Fed cutting trough of near 3%). With rates market volatility likely to remain elevated, we also recommend buying the TY futures basis which serves as a cheap way to position for extreme rate moves (see: Buy futures basis = cheap options)…
… Bottom line: We continue to favor trading US rates with soft long bias & targeting longs in 5y tenor. US Treasury liquidity & investor confidence is being tested. Recommend 2s5s30s fly on delayed Fed cuts & supply/demand imbalance, re-set target on 30y spread short, favor short 1y inflation.
… Technicals: US 10Y yield top invalidated, trend flipping? Previously, US10Y yield formed a top with targets of 3.86% (reached), 3.70% and 3.45%. The reversal this week invalidated it. On April 9 we closed our US5s30s steepener.
….Previously, US 10-year yield formed a head and shoulders top with targets of 3.86% (reached), 3.70% and 3.45%. We said it would be ideal for yield to remain below the 200d SMA at 4.22%. The top would be invalidated if above 4.40%. Both levels broke this week. Therefore, the trend has turned neutral/range bound with upside risk to 4.51%, 4.66% and possibly 4.80% while above 4.22%.
France (revising growth f’cast AND GETTING NEUTRAL DURATION) …
13/04/2025 BNP: Sunday Tea with BNPP: Vulnerabilities despite tariffs ‘pause’
KEY MESSAGES
With no signs of the US or China backing down over tariffs, markets remain prone to (dis-)investment decisions driven by uncertainty, apprehension and risk deleveraging.
We lower our US growth forecast while still maintaining a bullish view on Europe. Accordingly, even after taking profit on our long EURUSD position, we remain watchful for opportunities to buy on dips.
A sharp repricing of term premium across G4 bond markets has contributed to a rare twist steepening of curves, albeit in line with our view. We booked a profit on our EUR 2s10s steepener trade and remain on the lookout to re-enter.
… Revising down our US growth forecast: Our new base case for the US is for little growth (0.5% y/y in Q4 2025), a lot of inflation, and still no rate cuts this year. Achieving this outcome, however, depends crucially on the White House continuing to moderate its trade policy by sharply reducing tariffs on China in the very near term. While we attached a 60% probability to this scenario, with China announcing a 125% tariff increase on US goods on Friday, the market may still price in greater risks of a US recession (which we have at 25%). A stagflationary environment could nonetheless be the worst outcome for the market as it could result in 100bp of rate hikes, we think.
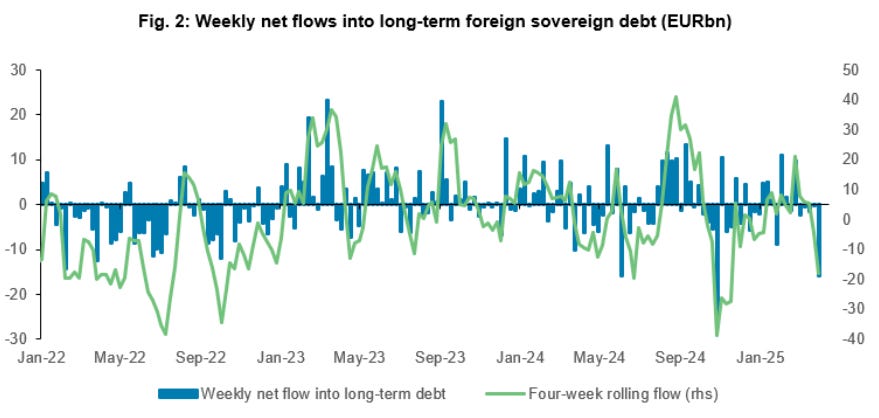
Losing faith in the US Treasury market? Facing considerable uncertainty, amply illustrated by more open-ended outcomes priced in by SOFR option contracts, early signs of cracks in the US Treasury market have started to emerge; namely, a substantial cheapening of US swap spreads across the curve; a tailed 3y auction at a time when more Fed cuts were nonetheless getting priced in; and evidence of speedy bond basis deleveraging and substantial repricing of US term premium, which saw US 2s30s twist steepen during peak stress. All of which suggests to us that the perception of US Treasuries is taking a meaningful hit given their inability to provide a hedge against recession and risk-off. Perhaps the first sign of this is to be found in the weekly data from the Ministry of Finance which showed that Japanese investors sold EUR16bn of foreign debt in the week ending 4 April.
Consequently, we have turned neutral on duration and continue to believe that the best opportunities in the US rates market are to be found in the inflation space. We remain paid 1y CPI swaps.
When techAmentalists see something positive, we’re supposed to pause, read and possibly react …
US equity futures see weekly slow stochastics cross from oversold territory, which has been a bullish indicator in the past. We expect to see such a crossover in SPX and Nasdaq composite as well. With the worst of the noise seemingly behind us, we stocks could see a modest rally in the short term. Longer term picture, however, does not look as rosy.
S&P e-minis (ES1): S&P e-minis weekly slow stochastics have crossed higher from oversold territory. As we mentioned in our last note, this is a bullish indicator (and we expect a similar crossover in SPX once markets open).
We revisit the building blocks
While we did not hit the 200w MA of the 55-200w MA, we came close with a low of 4832.
This is the 6th time we have seen a cross higher from oversold territory in the past decade. In the five times it has happened previously, we saw gains of >10%.
Together, we turn short term bullish, with some of the 'worst of tariffs' noise seemingly behind us in the short run. We think we could see a rally towards a convergence of resistance at 5800 (55d Ma, 200d MA, psychological level, December 2024). ~10% rally suggests we could hit levels around 6000 again, IF we break that level.
For support, 4800-4832 (Recent lows, psychological level) will be the first area to watch.
… so a RENTAL, not yet a buy.
Germany with a (p)review of TARIFFying price action …
13 April 2025 DB: Early Morning Reid - Post–Liberation-Day Performance Review
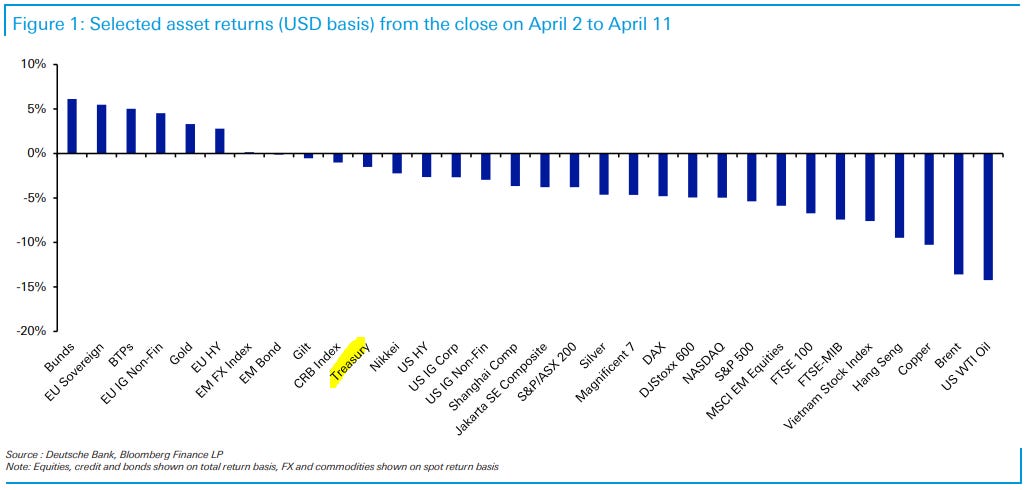
Before financial markets reopen on Monday, we thought this would be a good opportunity to pause and look back at the 7 business days since Liberation Day and assess how global assets have performed relative to each other.
Since the reciprocal tariff announcements on April 2, financial markets have experienced one of their most tumultuous periods in living memory. In many cases, the scale and speed of the moves haven’t been seen in decades. For instance, this period has seen the S&P 500 post its worst day since the pandemic turmoil of March 2020, as well as its best day since the GFC in 2008. Moreover, the 10yr Treasury yield has just posted its biggest weekly jump since 2001, and the 10yr Treasury-bund spread has just seen its biggest weekly widening in data going back to German reunification in 1990.
In this special edition of our performance review, we take a brief look at what’s happened each day since the tariff announcements, along with how different assets have reacted over the last week and a half.
…How have different asset classes performed? …Rates: Unusually in a risk-off environment, US Treasuries have lost ground since the announcement, with investors questioning their ability to continue acting as a haven in times of stress. In total return terms, they’re down -1.5%, and the 30yr yield is up +37bps since the close on April 2. However, sovereign bonds elsewhere have seen a stronger performance, with Euro sovereigns up +0.8% in local currency terms and +5.5% in USD terms. That included a -15bps decline for the 10yr bund yield. So that’s led to a huge widening in the 10yr UST-bund spread, which posted its biggest weekly widening last week (+50bps) in data going all the way back to German reunification in 1990…
AND back to the good ‘ole USofA on uncertainty (NOT a good thing …)
April 13, 2025 MS: Sunday Start | What's Next in Global Macro: Even After the 'Pause', Uncertainty Prevails
What a week this has been. Without a doubt, it was the most stressful week of my career in financial services. While we got a 'pause' on US reciprocal tariffs ex China, uncertainty remains high. For a macroeconomist, the issue is uncertainty weighing on corporate confidence, which can cause a material deceleration in capex and trade. To me, the lesson from the 2018-19 experience with tariffs is precisely that slowing capex and trade will be the key drags on growth, affecting all economies…
… In the near term, we think that US-China trade activity will be disrupted. Reports indicate that freight bookings on the China-US route have fallen by two-thirds over the past seven days, and more trade disruption may lie ahead. But we would reiterate strongly that the bigger challenge is that uncertainty will prevail for some time, as it will take a while for Asia ex China economies to conclude deals and the timeline for China appears to be even longer.
As long as tariff uncertainty persists, corporate confidence could continue to ebb, which would imply meaningful downside to capex, and Asia’s growth momentum would soften even more. Policy easing would likely accelerate but can’t be enough to offset the growth drag in that situation. Moreover, potential non-linear effects could still take hold, and that’s why we see the risks to Asia’s growth outlook as skewed to the downside.
Continuing right along with more views from this same shop, ON RATES …
April 14, 2025 MS: Fool Me Once, Shame On You. Fool Me Twice, Shame On Me | Global Macro Strategist
Investors should prepare to be fooled many more times. Hold your convictions loosely and keep your stops tight. If a master plan exists – e.g., offset the negative economic impact of tariffs with fiscal and monetary easing – it's unlikely to work in the way the US administration envisions.
Key takeaways
Tariffs raise prices, harm confidence, and weigh on activity before Fed easing helps. Higher bond yields, on additional supply, hurt before fiscal easing helps.
The supply of global, fixed income safe havens – those with a median AAA or Aaa rating – sits near multi-decade lows as demand for them reaches local highs.
We create a proxy for US outflows from foreign investors based on changes in shares outstanding of equity and bond ETFs filtered by investor location.
ETFs point to a gradual reduction in exposure to US equities from investors outside the US in 2025, while fixed income exposure remained stable.
… and on STOCKS ….
April 14, 2025 MS Weekly Warm-up: The Worst May be Over, but the Coast Is Not Clear
Offsetting forces mean we're likely in a trading range of 5000-5500. The 90-day pause on reciprocal tariffs and further concessions over the weekend lessen the near-term probability of a recession, but uncertainty remains high, the Fed is on hold and back-end rates are a headwind.
In a Trading Range...Offsetting forces mean we're likely in a trading range of 5000-5500 (~18x-20x) for the S&P 500. On the positive side, the 90-day pause on reciprocal tariffs and further concessions over the weekend lessen the near-term probability of a recession. Perhaps most importantly, they demonstrate that the administration is willing to course adjust—an unknown dynamic for stocks just 1 week ago. On the negative side, the back and forth on policy is still likely to exacerbate uncertainty for businesses and consumers. Further, the Fed remains on the sidelines in terms of offering monetary policy support, and long-end rates have jumped over 60bps in a week. To the extent the shift in tariff policy was due to the move in back-end rates, we have yet to see the relief desired. Bottom line, the equity market will likely remain in a wide trading range with high volatility until we have more certainty on the depth of the growth slowdown and the timing of a recovery.
What Would Get Us Out of This Trading Range on the Upside or the Downside...On the upside, we think a more dovish Fed would be one variable. However, our economists don't see the Fed cutting this year, so this outcome would likely require weaker labor data or stress in funding/credit markets. While both of these scenarios would likely be equity market negative initially, that adverse reaction function could be short lived if the Fed responds aggressively and a recession is not imminent (like last summer/fall). This is feasible, but it's a tough needle to thread. A drop in the 10-year yield back toward 4% would also be helpful for equities as long as it's not accompanied by recessionary growth data. Finally, a larger trade deal with China that significantly reduces tariffs still in place at high rates is also not in the price in terms of an upside catalyst. On the downside, we think the main risk to equities is a further deterioration in earnings and/or corporate confidence that leads to a labor cycle. 10-year UST yields above 5% could also lead to a break below 5000 and a retest of last week's lows.
What to Expect into Earnings Season...Leveraging input from our analysts, revised forecasts from our economists and stress tests of our leading earnings model, we mark to market our base case earnings forecasts post the series of recent tariff events and other flagged headwinds. 2025 EPS moves to $257 (6% growth) and 2026 EPS moves to $281 (9% growth) in this base case scenario. While not our baseline, the probability of a mild recession remains elevated (~40%). Thus, we also include EPS estimates for this alternative scenario—2025 EPS of $240/-1% growth; 2026 EPS of $249/4% growth. As has been the case over the past several weeks, we would expect market pricing to continue to lean back and forth between both outcomes—i.e., expect volatility to persist within the aforementioned trading range. In today's report, we also introduce a new industry framework as we head into reporting season (based on what's priced from a forward EPS growth, PMI and valuation perspective). Using this tool, we would recommend looking for single stock opportunities in industries where the set up is more derisked—Transports, Materials, Semis, Autos, Pharma/Biotech, and Tech Hardware. Conversely, we would continue to lean short in areas that are not as de-risked into earnings—both Consumer Discretionary (where China tariff exposure is also present) and Consumer Staples stand out.
… AND finally, more economically speaking …
April 14, 2025 MS: The Weekly Worldview: No Country for Free Trade
We highlight the complexity that these tariffs bring to the economic forecasting process, highlighting in particular country versus sector tariff approaches.
The tariff tango continued last week. The administration’s tariff policy took a few sudden turns... a Boleo if you will. The detour saw both escalation and de-escalation on tariffs, though the constant was a focus on China. These immense changes in tariffs make elasticities of trade volume near impossible to compute. Not only is the scope of the tariff globally hard to grasp, but the uncertainty means businesses will have little confidence in their planning. That is why we titled our latest US economic update, Still Living on the Edge. The title was not just a metaphor – the US economy literally is sitting on the edge of a cliff. Greater policy uncertainty increases the risks of a business shutdown, which could drive a recession faster than any economic model might predict…
…The uncertainty of tariffs mean that the market will find it hard to find a price equilibrium. We are constantly asked to estimate the GDP implication of tariff policy. But the reality is that growth will be a function of tariff, fiscal, immigration, and other policies. One cannot isolate just one policy in a proper forecasting process. As a result, the risk we run is that while we are looking in one direction, we get hit by another policy. Markets seem to be experiencing this same dilemma. In the end, like in No Country For Old Men, we are all looking for profits but sometimes there may be none to be had.
… And from the Global Wall Street inbox TO the intertubes, a few curated links …
These first links / visual is the real fear recession’istas been warning about for while …
April 14, 2025 Apollo: The 60/40 Portfolio Continues to Underperform
The 60/40 portfolio has basically gone nowhere since the beginning of 2022, with only a 2% annual return for the past three and a half years, see chart below.
April 13, 2025 Apollo: Consumer Confidence Is Weaker than During the 2008 Financial Crisis
The April survey of consumer sentiment from the University of Michigan shows the following:
Consumer sentiment is declining rapidly both for households making more than $100,000 and less than $100,000 (see the first chart).
Consumers’ worries about losing their jobs are at levels normally seen during recessions (see the second chart).
A record-high share of consumers think business conditions are worsening (see the third chart).
Households’ income expectations are declining (see the fourth chart).
Inflation expectations are rising at an unprecedented speed (see the fifth chart).
The bottom line is that consumer sentiment is very weak, and the fear is that this will spill over to weaker actual spending.
… on THAT note, cannot WAIT to see latest from HIMCO … still waiting …. While we wait, a couple from The Terminal dot com …
April 13, 2025 at 7:00 PM UTC Bloomberg: Bond Market’s Steepener Bet Gets Turbocharged Amid Tariff Mayhem
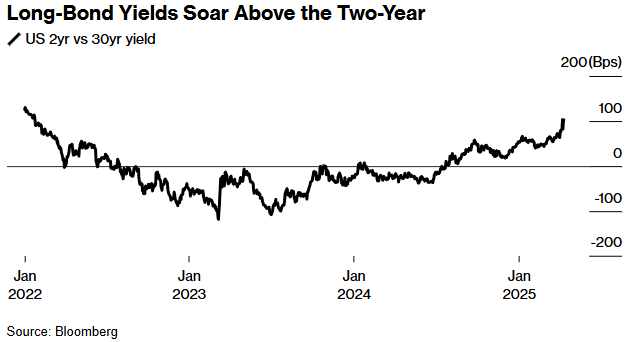
A go-to wager in the Treasury market is seeing one of its best runs ever as investors flee long-term US bonds amid President Donald Trump’s escalating trade war.
In a sign of how Treasuries’ status as a global haven during times of turmoil may be fading, rates on longer-term debt soared last week as equities convulsed, turbocharging bets on a steeper yield curve.
The extra yield that investors demand to own 30-year Treasuries over two-year maturities has increased for nine straight weeks, a streak seen only one other time since Bloomberg began collating the data in 1992. Last week, that gap reached levels last seen in 2022, giving a boost to money managers such as DoubleLine that are positioned for such a move.
The appeal of long bonds dimmed last week in part on speculation that Trump’s tariffs will sap international demand for Treasuries at a time when already-bloated US deficits could swell further with Congress debating tax cuts. Meanwhile, with worries around the economy growing, shorter maturities fared better versus longer-dated debt because of expectations the Federal Reserve will soon lower interest rates.
For DoubleLine, anticipating an even steeper curve from two to 30 years is the way to play this dynamic.
“That’s the cleaner expression for us,” said Bill Campbell, a portfolio manager at the firm. “And it’s a curve positioning that continues to remain prudent at this time, given those longer-term factors.”
There were other forces feeding into the outsized selloff in longer maturities last week. There was speculation that hedge funds were unwinding leveraged trades, or that banks were dumping the debt to raise cash to meet clients’ liquidity needs as the trade war darkened the corporate outlook…
April 14, 2025 at 5:16 AM UTC Bloomberg: This Passover, everyone has questions The message from markets is that it’s time for some serious answers.
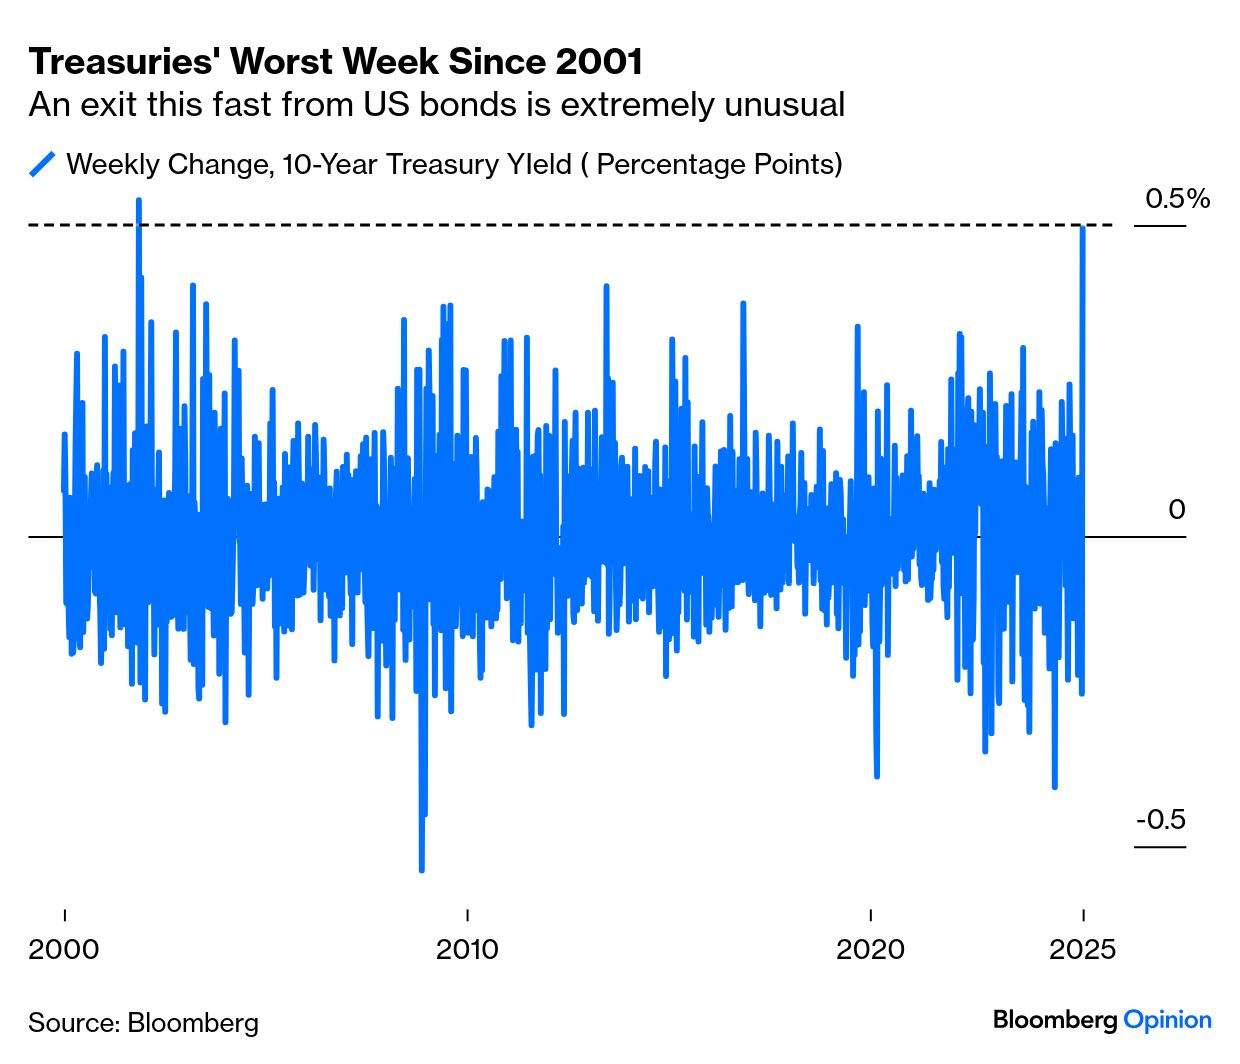
… It’s true that US yields still aren’t all that high. At Friday’s close, the 10-year yielded just under 4.5%; it hit 4.8% in January, and briefly topped 5% in 2023. But the speed demands attention — it gained 50 basis points last week. The last time that happened was in November 2001:
Another problem: The week’s price action tends to confirm that bond yields are in a rising trend that started five years ago. Such things matter in the bond market, which tends to follow long cycles:
Put all these together, and the only explanation is a loss of confidence in the US as a destination for funds. Last week's combination of rising yields and a falling currency is reminiscent of any number of emerging markets crises, and of the one for gilts and sterling that followed Prime Minister Liz Truss’s unfunded UK tax cuts in 2022. It’s amazing that such a fate can befall the US. Truss capitulated and sterling rebounded; that’s generally the pattern that emerging crises follow. Amazingly, that is now the template for the US.
Number of the day? 42 …
April 14, 2025 The Daily Number: The S&P 500 just experienced a Death Cross
The 10-week moving average of the S&P 500 has fallen below the 40-week moving average for the 42nd time since 1950.
Here’s the chart:
… The Takeaway: The trend is your friend until it bends, and the S&P 500 has been in an uptrend for the past 115 weeks.
But that changed last week when the S&P 500 experienced a Death Cross, which adds to the evidence in favor of Bears.
But what exactly is a Death Cross?
A Death Cross is a technical indicator that occurs when a short-term moving average (10-week moving average) crosses below a long-term moving average (40-week moving average). This indicator is used to identify a shift in market trends from bullish to bearish.
Some people may place limited emphasis on the Death Cross pattern because it is often considered a lagging indicator. However, historical data suggests that if the short-term moving average remains below the long-term moving average, it could pose challenges for stocks moving forward.
I have done the math, and the results are bearish for the stock market… Take a look at the table above for more details.
On average, the S&P 500 has poor performance over the next 1 to 3 months.
Is this the kind of environment where we want to invest our capital? The impact on stocks in the near future will depend on how long it takes before we see a Golden Cross, which is the opposite of a Death Cross.
As we collectively continue to wait for the good Dr (Hunt) quarterly, lets review some updated WEEKLY positions in futures where you’ll note everyone moved to one side of the boat …
12 APR 2025 Hedgopia CoT: Peek Into Future Through Futures, How Hedge Funds Are Positioned
Non-commercials raised net shorts in 10-year note futures by 24.9 percent this week to 1.08 million contracts – now merely 6.1 percent from the record 1.14 million contracts set in the week to October 1st last year. Holdings then dropped to 567,935 contracts by the week to January 14th. Back then, the 10-year treasury yield ticked 4.81 percent on that very day, that is January 14th, and headed lower, subsequently reaching 4.11 percent on March 4th and 3.89 percent on Friday the 4th this month. Rates then shot up over six sessions to tag 4.59 percent intraday Friday this week, closing out at 4.49 percent, up 51 basis points for the week.
As these traders began to add to their holdings mid-January, they were obviously wrong initially, as yields continued lower. But, as mentioned earlier, the 10-year surged this week – past both the 50- and 200-day moving averages (4.34 percent and 4.22 percent respectively). Strangely, long-term treasurys and the dollar both took it on the chin at a time when investors were avoiding risk; traditionally, these two assets are treated as safe-haven. This could very well carry an important message. Time will tell.
For now, should the 10-year continue to rally, trendline resistance from October 2023 when it peaked at five percent extends to 4.75 percent.
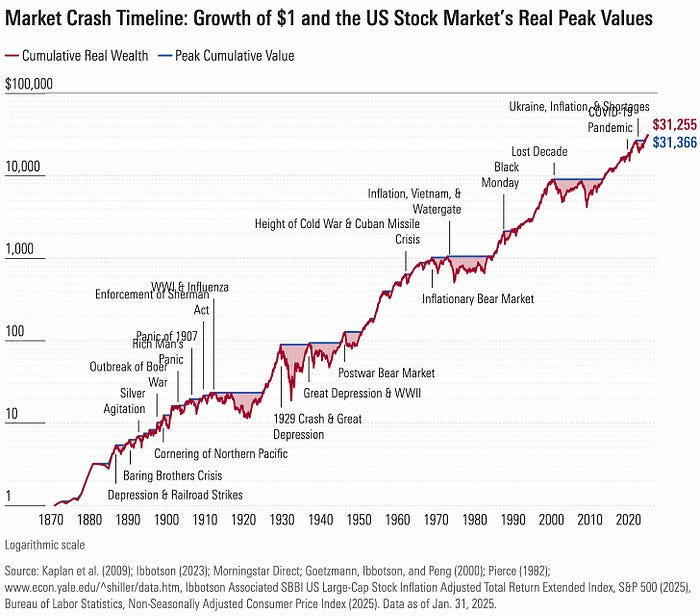
Stock markets crash all the time and this next post has an excellent annotated visual …
April 13, 2025 The Pareto Investor: Lessons from 100+ Years of Stock Market Crashes
… Consider the numbers: a single dollar invested in a hypothetical U.S. stock index in 1871, adjusted for inflation, would grow to $31,255 by January 2025.
This staggering growth didn’t come without turbulence — 19 bear markets (drops of 20% or more) pockmarked the journey.
The “Lost Decade” (2000–2013) saw a 54% decline over the dot-com bust and Great Recession, taking 12 years to recover.
The COVID-19 crash of March 2020 dropped 19.6% but rebounded in just four months — the fastest recovery in 150 years.
The December 2021 crash, triggered by the Russia-Ukraine war and inflation, fell 28.5% and took 18 months to heal.
These ups and downs illustrate a market that’s volatile yet relentlessly upward over time.
This next link is a good reflection and helps contextualize valuation as it’s not always a great timing tool … AND some snazzy charts, as usual …
Apr 13, 2025 TKer by Sam Ro: Put the P/E ratio in timeout for now
… With stock prices falling the way that they have been in recent weeks, the P/E ratio could be creating the illusion that stocks have gotten cheaper than they are in reality.
Forward P/E ratios have come down. But is the E accurate? (Source: FactSet)
Generally speaking, it’s not a great idea to be trading in and out of the stock market, especially during periods of stress. It’s especially treacherous to be trading based on P/E ratios, more so when the Es are unreliable.
Unfortunately, we might not get a clean E any time soon.
“There is a reasonable probability that absent some resolution/clarity, transparency could be compromised,” BofA’s Savita Subramanian wrote on Thursday. “Companies tend to shut down guidance amid uncertainty.”
This sentiment is in line with Goldman Sachs’ David Kostin, who expects “during upcoming quarterly earnings calls fewer companies than usual will provide forward guidance.“ This is because recently announced tariffs have made it very difficult to project where business is headed.
If you’re going to trade, be careful about trading based on expectations for the near future. The savviest minds in the market caution this is a guessing game…
Finally, Wolf on 10s …
Apr 12, 2025 WolfST: 10-Year Treasury Yield Snaps Back to February’s 4.5%, Yield Curve Re-Un-Inverts, Mortgage Rates Back at 7%
The aggressive Bash-Down by the White House of long-term Treasury yields and the dollar since January worked. Until it didn’t.
The 10-year Treasury yield rose to 4.49% on Friday, back where it had been on February 20. It has snapped back by 50 basis points from the recent low on April 3 of 3.99%, after a hard plunge.
By comparison: Starting in mid-September, the 10-year Treasury yield surged by 116 basis points to 4.79% on January 10, 2025, and there was no talk of an impending catastrophe. But now that the 10-year yield has risen by only 50 basis points, to only 4.49%, and is once again barely above the effective federal funds rate (blue in the chart below), the media – pushed by the crybabies on Wall Street – is generating piles of scary headlines about an impending catastrophe? …
… The 30-year Treasury yield closed at 4.87% on Friday, back where it had been on January 31, and below the near 5%-rate on January 10, and well below the 5%-plus range where it had been in October 2023.
It has traded in a fairly narrow range since mid-2023, and the recent snap-back from the drop, when seen over this time frame, wasn’t much to write home about.
Finally, before hitting send, did you catch latest biz update over weekend? How bout that ‘Big-A$$ Box of Bisquick’, eh?