while WE slept: USTs a touch lower (tariffs) but...; GDP was <fine, terrible or awsome> choose one; GDP is lookin' back and #HIMCO lookin' fwd; 30yy to peak at '07 levels? stock & bond ylds since 1870
Good morning … the Fed paused in what can be classified as a hawkish hold (contrary to what was expected to be more a dovish pause) and on heels of that, GDP comes in a bit light (with some bright spots) …
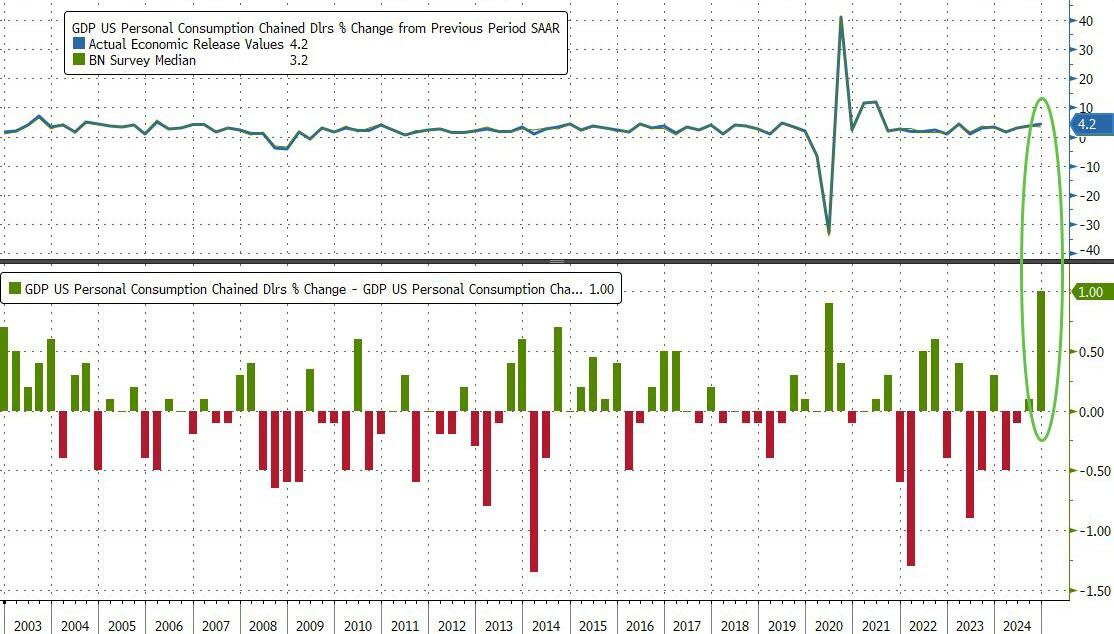
ZH: Q4 GDP Growth Comes In Unexpectedly Light Despite Red Hot Personal Spending Beating Estimates By A Record…
… As shown in the chart below, the 4.2% personal consumption print was the biggest beat to consensus expectations (of 3.2%) on record!
… The GDP figures capped another solid year for the world’s largest economy driven entirely by record debt, which helped defy expectations for a marked slowdown as consumers hung tough in the face of persistent inflation and high borrowing costs. That helps explain why the Federal Reserve is taking a more measured approach to future interest-rate cuts.
None of this proves anything about the future and I’m not sure why but now seems like as good a time as any to re-insert thought process of none other than Lacy Hunt.
On 24 Jan I noted his latest quarterly view …
The Global Capacity Glut Factories across the world are growing increasingly idle. Global industrial capacity utilization (CAPU) has fallen significantly, and a rising unemployment rate has followed suit, signaling that the available factors of production globally are progressively more redundant. The reason this is relevant is that since 1990, this thirty-four year correlation is consistent with the U.S. experience where data has been available for seven decades. As such, CAPU appears to be the dominant supply-side variable in determining inflation in the United States, China, Japan, U.K. and the EU.
… CAPU - At Recessionary Levels In the United States, CAPU has plummeted to levels lower than at the start of all of the cyclical recessions since 1967 (Chart 1). This vividly reflects a significant underutilization of resources, a circumstance which has historically led to moderating economic growth. Based on nearly complete fourth quarter 2024 data, the U.S. CAPU is estimated to have been 76.9%, a significant 3.2 percentage points lower than the post-1967 average and 6 percentage points below the historical level of 82.9%, which is the average entry level for the cyclical recessions. This surplus capacity reflects an irregular cyclical decline in industrial production from the fall of 2022…
… Inflation and Bond Yields Historically, on an annual basis, there has been a high correlation between the thirty-year Treasury bond yield and the inflation rate. That relationship did not hold in the past two years when the long bond yields rose even though the inflation rate moved downward. Despite this recent divergence, inflation and the long bond yield moved in the same direction for 71% of the years since 1954, when Treasury bond yields started trading freely. Historically, such divergences have been brief.
The previously discussed fundamental determinants of inflation indicate the prospects for slower price increases are even more significant than in any year since the late 1990s. In addition to the growing factory capacity glut and rising UR, the percent decline in modernized world dollar liquidity (WDL) reached another record low in the fourth quarter. The accelerating decline in WDL will intensify the liquidity/money squeeze domestically and globally. We estimate the trend adjusted real M2 declined further in the fourth quarter. Since the Fed's first reduction in the policy rate in September, critical consumer and small business borrowing rates have remained unchanged or increased. Such considerations argue that lower inflation will lead to a surprising drop in thirty-year Treasury bond yields in 2025.
Make if Q4 GDP whatever you wish. Frankly I’m not certain and to some degree, am skeptical of the initial ‘emergency’ 50bp rate CUT. Thankfully there was not any emergency then and this does not preclude one from coming. The Fed has plenty of room SHOULD they need and that is good. Lacy Hunt is good and I hold his view in very high regards and HOPE he’s wrong. His views should be considered, though and in the case he’s NOT wrong, well, connecting some dots as far as the what next.
On THAT note AND as 10s continue to romance 4.50%, it’s becoming increasingly important as the day / week and MONTH come to a close (at 4p today), to keep ‘all eyes’ on MONTHLY closes.
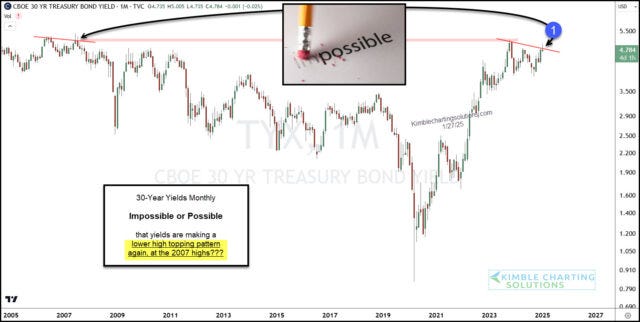
Here are long bonds, monthly, dating back TO 2007
KIMBLE: Historical Deja Vu: Will 30-Year Treasury Bond Yields Repeat 2007?
We have repeated several times the importance and implications of rising/falling interest rates.
And today we come back to this theme while discussing long-term US treasury bond yields.
Above, we share a “monthly” chart of the 30-year treasury bond yield. And, as you can see, we highlight a potential topping pattern set up by a bearish reversal this month.
But this isn’t any old topping pattern; this is a potential deja vu!
Currently, yields are potentially repeating the very same topping pattern that marked the 2007 highs… at the 2007 highs!!
This could be a BIG DEAL for interest rates and have implications for the economy. Stay tuned!
I’ll attempt to have a look at and craft my very own monthly visual(s) over the weekend. For now, though, well … here is a snapshot OF USTs as of 620a:
… for somewhat MORE of the news you might be able to use … a few more curated links for your dining and dancing pleasure …
newsquawk US Market Open: DXY mixed ahead of PCE, NQ bid with AAPL +3.5% pre-market, Bunds outperform on soft state CPIs … Fixed benchmarks bounce on cool German State CPIs, which has led to outperformance in Bunds … USTs are in the red, weighed on by the latest Trump-tariff rhetoric. Action which has propped up yields stateside with the short-end leading ever so slightly given the potential near-term tariff implications of any measures. Action which took USTs to a 108-31 trough in the early European morning. However, the complex began to make its way gradually off lows as no late-Thursday announcement came from POTUS as some had guided us towards. Additionally, a WSJ sources piece implied that officials are working to find a way to dial-back the tariff rhetoric/situation. US PCE due.
Finviz (for everything else I might have overlooked …)
Moving from some of the news to some of THE VIEWS you might be able to use… here’s some of what Global Wall St is sayin’ … One part GDP recap and victory lap-A-thon and a bit of UST reFUNding / nfp pre-caps sprinkled in …
Wait, I thought we were all singing the ‘drill, baby, drill’ tune NOW, after that GDP report, we’re singing a different tune …?
BARCAP: US Economics: Advance Q4 GDP: Spend, spend, spend
The BEA's advance report placed Q4 GDP growth at 2.3% q/q saar, driven by strength in consumer spending. More broadly, private domestic final spending (PDFP) remains on a strong trajectory, boding well for Q1 growth. Tomorrow's monthly PCE estimates will clarify carryover effects.
From looking backwards to looking forwards TO NFP, a pre-cap …
BARCAP: US Economics: January employment preview: Revision time
We expect the January employment report to show a 175k job gain, returning to a more-normal pace after payback-distorted estimates in prior months. We expect the unemployment rate to be unchanged at 4.1% and hourly earnings to grow 0.3% m/m (3.7% y/y).
AND then there is a note from this shop on the ‘equity risk premium’ and for the uninitiated, a google search will define as, “…quity Risk Premium is the difference between returns on equity/individual stock and the risk-free rate of return. The risk-free rate of return can be benchmarked to longer-term government bonds, assuming zero default risk by the government…”
BARCAP: U.S. Equity Strategy: Food for Thought: Paying the Premium
Equity/credit risk premiums are at decade-plus lows while Treasury term premium pushes to historic highs, reflecting cross-asset views coalescing around a pro-growth outlook. Narrow equity risk premium has been around for most of this bull market, but be wary of macro/rates volatility.
Risk premiums have fallen to decade-plus lows as term premium climbs to historic highs We estimate the S&P 500 equity risk premium (ERP) to be hovering a few bp below zero while IG OAS spreads are below 80bp. Both are close to the lowest readings seen over the last decade. Meanwhile, Treasury term premium has risen aggressively since the Fed's initial rate cut and is now above the 99th percentile of observations over 10 years. We think this aligns with our rates strategists' view that reduced safe-haven demand (amid tight labor markets, front-loaded Fed cuts and a new pro-growth US administration) is pushing real yields and term premium higher (Global Rates Weekly: Jitters, 10 Jan 2025), also as gov bond fund flows shift to favor shorter duration. In turn, equity/credit risk premiums are tightening as cross-asset views coalesce around a "no landing" scenario. To be fair, low ERPs were a feature rather than a bug of the record-setting equity gains over the last 2 years, but we would still keep an eye on it, as increasingly consensus risk-on positioning could lower the bar for bearish surprise (such as UST 10Y yields breaking out above 5%, uncertainties around the deficit, or a Fed hike, though the latter is still not our base case).
A quick look at some back of the envelope math on heels of the GDP and only one possible conclusion could ever be drawn … buy stonks …
BNP: US Q4 2024 GDP: Better than it looks, adds upside risk to Q1
KEY MESSAGES
The Q4 2024 GDP print was stronger than the 2.3% q/q saar headline suggested (BNPP est.: 2.4%; consensus: 2.6%) and supports our view that momentum will continue in H1 2025.
The details add upside risk to our current estimate of 2.5% growth in Q1, as robust consumer momentum is likely to leak into the period and special factors that weighed on Q4 are likely to recede.
The report is very consistent with our view that the Fed will be on hold for quite some time – we think into next year.
They say bull markets love supply, right? Guess we’re waiting to see what the reFUNding brings …
DB: Refunding preview: Softening the guidance (on coupon size increases)?
The February quarterly refunding announcement should produce relatively few surprises, with the Treasury expected to keep nominal coupon auction sizes unchanged for the fourth consecutive quarter. We expect coupon sizes to begin rising at a modest pace starting in November, in line with the consensus.
The most interesting aspect of the refunding announcement will be Treasury’s guidance on future increases. With the Treasury potentially needing to adjust its previous guidance as the anticipated increases approach, there is a possibility that any strong revision could be negatively perceived by the market.
We anticipate a $1bn increase in TIPS auction sizes over the next quarter, with $10bn in new 30Y TIPS in February, $18bn in 10Y TIPS reopening in March, and $25bn in new 5Y TIPS in April. The increase to 30Y TIPS is a close call. If the Treasury perceives insufficient demand or market liquidity too weak to support a larger auction, it may well decide against an increase at this time.
TBAC documents accompanying the refunding could potentially offer useful insight into dealers’ latest views on Fed QT and the future composition of the Fed balance sheet. We discussed our latest QT thoughts here.
Some reading this ‘Stack may very well be doing so for the very last time and are completely disappointed by its contents and its style. For that I’m sorry … perhaps this ‘Stack is not completely unlike today’s GPD …
ING: Robust underlying growth despite US GDP disappointment
US GDP expanded "only" 2.3% in the fourth quarter, but this masks consumer strength via a big run down in inventories and the Boeing strike action that depressed aircraft-related investment. These factors will unwind this quarter, but the downside risk is surging imports as US companies seek to avoid potential tariffs that could kick in from this weekend
GDP not bad. Thanks to you all for consuming more than just this ‘Stack …
MS: US Economics: 4Q GDP: Consumption leads the way
Real GDP rose at a 2.3% a.r. in 4Q. Consumption surged 4.2% on durables. Inventories were a 0.9pp drag. Core PCE prices +2.50% were below expectation, adding slight downside to our Dec 0.17% m/m core PCE forecast. For early 2025 GDP, consumption momentum and inventory rebuild add upside risk.
… Real consumer spending rose 4.2%, above our and consensus' 3.2% estimate. Both goods and services came in stronger than expected, with specific strength in durable goods. Real goods spending rose at a 6.6% q/q a.r. following 3Q's already strong 5.6%. Real durable goods spending rose 12.0% in 4Q, the third quarter in a row of acceleration. Motor vehicle sales, likely affected by hurricanes, contributed to the strength, rising 13.9% in 4Q, but other durables such as recreational goods and vehicles were strong as well. Nondurables spending growth slowed from 4.6% in 3Q to 3.8% in 4Q, but some components such as clothing were stronger. Real services spending picked up despite our expectation for a slowdown, increasing 3.2% in 4Q after its 2.8% increase in 3Q. The surge in overall consumption in 4Q was probably partly because of Hurricanes, but there's momentum as well, with discretionary spending accelerating across 2024, capped by the booming 4Q.
The saving rate dropped slightly from 4.3% in 3Q to 4.1% in 4Q----not signaling new household strains despite the surge in spending. Real disposable personal income was accelerating, +2.8% in 4Q versus 1.1% in 3Q. Labor compensation rose 5.8% on a nominal basis, accelerating from the prior two quarters. Rental income picked up after a weak 3Q as well, increasing 7.0%…
…For the Fed, the progress in inflation progress looks no different from how it did. The 4Q surge in consumption is, at the margin, a reminder that the labor market and household incomes remain strong, unthreatened, which allow them patience.
For somewhat more on consumer who’s cruisin’ AND a look at the economic week ahead …
Consumer spending on durables propelled the economy to a strong finish in 2024. Less downside risk to activity and labor markets is one factor that raises the bar for further Fed easing. Although the Fed retained its easing bias in January, Powell emphasized it is "not in a hurry" to act.
Key takeaways
Private consumption spending rose 4.2% q/q saar in Q4, with spending on durables surging 12.1%. Spending on services was up 3.1%.
Business spending took a surprising step back. We see this at odds with corporate profits and the surge in imports of industrial supplies at year end.
Chair Powell retained confidence that inflation would move lower, keeping the door open for rate cuts, but he expressed no urgency to move.
… Preview of upcoming data … Employment situation. We estimate that the wildfires in California and the swing toward colder weather across the country held payrolls to a 140k gain. The unemployment rate moves sideways at 4.1%, and average hourly earnings rise on trend 0.3%. The benchmark revision will lower the average monthly payroll change for the 12 months through March 2024 by about 70k, but we do not see much passthrough into more recent readings.
While the headline print may have been ‘light’, the pace of spending was ‘blistering’ …
… the two pieces of news were how weak domestic investment looked and how strong real consumption looked. In our forecast last Friday we expected real GDP of 2.3%, but with real PCE expanding 3.5%, and with investment looking not as bad as the published data today. However, real consumption expanded a blistering 4.2% annualized in Q4, ahead of our expectations (3.5%) and further ahead of consensus (3.2%)…
AND same shop talkin’ taxes as you know, it IS ‘bout that time here …
US President Trump reiterated their intention to aggressively tax US consumers of products from Canada and Mexico, possibly excepting oil consumers. Several US refineries are set up to process Canadian and Mexican, not US, oil. The speed of Trump’s retreat from taxing US coffee drinkers is a reminder of the unpredictability around tariff policy.
How quickly would US consumers experience higher prices? Oil and food prices would likely react within a month. US stock levels determine the timing of other price increases. Second-round price increases also matter. These tariffs partially relate to the war on drugs, but if the political focus shifts to broader inflation perceptions, the duration of any taxes could be short. US egg prices (a campaign focus) have soared since Trump was elected—food prices rather than drug prices may matter more.
Inflation is certainly a market focus today. The US December PCE deflator core inflation measure is expected to be stable in year-over-year terms, with food and fuel adding a little to the headline rate. French and German preliminary consumer price data are also due…
… oh, not what I might have thought … and again, there’s not going to be any ‘tax’ on consumption (which was a blowout yesterday …) IF, say, these tariffs are ultimately short-term in nature. Too soon to tell and / or price in conclusions. Paul here is doing what all the popular kids are doing, though, and trying to scare up market conclusions…
If we look backwards, heck, things looked pretty darned good (for now) …
WELLS FARGO: U.S. Economy Ends 2024 in Solid Position
Summary The U.S. economy expanded at a 2.3% annualized rate in Q4. Growth was held back by a slower stockpiling in inventories, but boosted by solid consumer spending, both of which may partially reflect a pull forward in demand ahead of potential tariffs. The economy entered the year with momentum, but tariff risks loom.
As things looked so good, wondering WHY that might be … hmm …
WELLS FARGO: G10 Central Banks Start the Year in a Dovish Overall Mood
Summary
It was a busy week for foreign central banks, with several institutions offering their first monetary policy assessment of 2025. The European Central Bank lowered its policy rate 25 bps to 2.75%, while repeating that inflation should converge to 2% by late this year and that growth remains weak. We expect 25 bps rate cuts in March, April, June and September, for a terminal policy rate of 1.75%.
The Bank of Canada cut its policy rate 25 bps to 3.00%, but did not offer any future policy guidance amid tariff-related uncertainty. We would not interpret that as a hawkish signal, however, and indeed the central bank's modeling suggested higher tariffs would have a relatively rapid and substantial impact on economic growth, and a somewhat more gradual impact in boosting inflation. Our view remains for 25 bps rate cuts in March, April and June, which would see the policy rate reach a low of 2.25%.
Sweden's Riksbank cut its policy rate 25 bps to 2.25%, while its accompanying statement was mildly dovish in tone. We think an accumulation of benign inflation and subdued activity data will see the central bank deliver a final 25 bps rate cut by May. In Australia, the latest inflation figures slowed more than forecast and pointed to an easing in domestic price pressures. We now expect the Reserve Bank of Australia to start its easing cycle with a 25 bps rate cut in February, and look for a cumulative 100 bps of policy rate cuts this year, to a low of 3.35%.
Ahead of the incoming NFP report, a(nother) pre-cap …
WELLS FARGO: Can't Remember a Time I Was Wrong: Job Revisions Incoming
Summary The January Employment Situation, to be released on February 7, will bring a number of routine changes to the establishment and household surveys made annually by the Bureau of Labor Statistics. Could upcoming revisions pull the rug out from under the apparent orderly moderation in the labor market?
Benchmark Revision: The BLS annually re-aligns the estimated level of employment from the establishment survey to "observed" employment from administrative data.
In August, the BLS' preliminary benchmark estimate indicated the total level of nonfarm employment could be 818K lower in March 2024 than previously reported. The January Employment Situation will incorporate the final benchmark revision.
If realized, the preliminary estimate would mark the largest downward revision since 2009 and suggest the average pace of payroll growth in the 12 months through March 2024 registered 178K versus 246K as currently published…
… Incorporating our expectations for these revisions, the January jobs report will likely continue to indicate the labor market has softened over the past year, but not to an alarming degree. We expect job growth in January to slow to 185K from December's currently reported gain of 256K and for the unemployment rate to remain at 4.1%.
The first Treasury refunding announcement of 2025 will offer a glimpse into how the United States Treasury is thinking through the fiscal outlook and federal government's financing need in the wake of the U.S. election.
We project a federal budget deficit of $1.9 trillion in fiscal year (FY) 2025, a modest widening from the $1.8 trillion deficit registered in FY 2024.
We believe the end of the Federal Reserve's balance sheet runoff program, more commonly known as quantitative tightening (QT), is coming into view. We expect QT to run at its current pace through the end of May. Starting in June, we expect the Federal Reserve to keep the size of its balance sheet unchanged through at least the end of the year.
The looming cessation of Treasury security runoff and eventual return to Treasury security purchases should help keep the government's financing need relatively flat over the next year despite some growth in the federal budget deficit.
Current coupon auction sizes are raising enough money on a net basis that changes are unlikely to be announced at the February 5 refunding. We look for nominal coupon and floating rate note auction sizes to remain unchanged until the November refunding announcement.
If coupon auction sizes follow our projected path, we forecast that privately-held net coupon issuance will total $1.9 trillion in calendar year 2025, accounting for 93% of the privately-held net marketable borrowing for the year.
The debt ceiling is once again a binding constraint. So long as it is in effect, the Treasury General Account (TGA) will grind lower, and Treasury bill paydowns generally will continue unabated. We expect a debt ceiling resolution to be paired with the budget bill(s) that are enacted ahead of the March 14 funding deadline, long before Treasury risks a default.
Looking through the debt ceiling noise, we project net T-bill issuance of $140 billion in 2025. T-bills as a share of the Treasury market will likely drift lower over the next couple of years even if coupon auction sizes are left unchanged until late this year.
… For one, the FOMC cut its target range for the federal funds rate by 100 bps between September and December. Although this has not reduced intermediate and longer-term interest rates, it has brought down yields on shorter-dated Treasury securities, most notably yields on the $6.2 trillion of Treasury bills outstanding. This in turn should help slow the growth in the federal government's interest outlays, at least in the short term (Figure 2). Furthermore, some Biden-era outlays on student loans and deposit insurance look set to return to more normal levels in FY 2025. Solid economic growth as well as strong asset price returns in 2024 bode well for federal revenues come the April tax filing deadline…
… And from the Global Wall Street inbox TO the WWW … a few curated links …
I like charts. Longer term and the more context, the better. This next twit …
at topdowncharts
Long-term perspective on stock & bond yields...
Makes you wonder what the next 150 years will look like